When you set up a network, one of the first software packages you will need is a network monitoring tool. WhatsUp Gold from Progress (formerly Ipswich) is a rising star in this category, so in this review, we’ll examine what’s behind its strong following.
What does Progress WhatsUp Gold do?
In order to monitor a network, a management tool needs to communicate with each device connected to a network and keep in touch with them. This is the core function of WhatsUp Gold. It maintains a constant status report on the health of all the hardware connected to the network.
Key Features:
- Automated Discovery: Uses SNMP to automatically detect and catalog network devices.
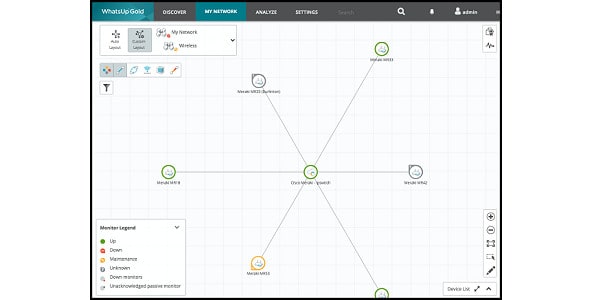
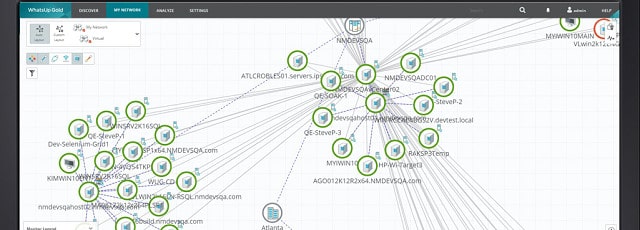
- Network Mapping: Visualizes network connections and device dependencies for better status reporting.
- Performance Monitoring: Continuously updates device statuses using SNMP.
- Server Monitoring: Tracks detailed metrics for servers, including CPU, memory, and storage.
- Alerts System: Integrates SNMP traps for real-time notifications and customizable alert policies.
- Wireless Network Monitoring: Extends performance monitoring to wifi networks and unifies network maps.
- Cloud & Storage Monitoring: Maps and monitors both on-premises and cloud-based servers.
- Distributed Monitoring: Consolidates multiple site networks into a single WAN for centralized management.
- Customizable Dashboard: Allows personalized report layouts and dashboards for different users.
Automated Discovery
When you install the WhatsUp Gold software, you don’t need to enter all of your hardware details into the console. The autodiscovery function sets up all of that for you. The process is based on the procedures of a system called the Simple Network Management Protocol.
SNMP is a very widely-implemented networking standard. Any equipment that can connect to a network will already have SNMP capabilities loaded into it. This means you don’t need to visit each device on your network to install client software because the SNMP agent is already there.
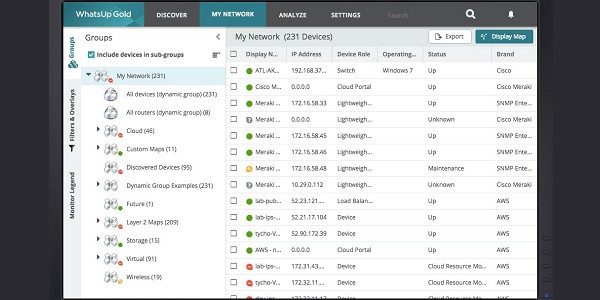
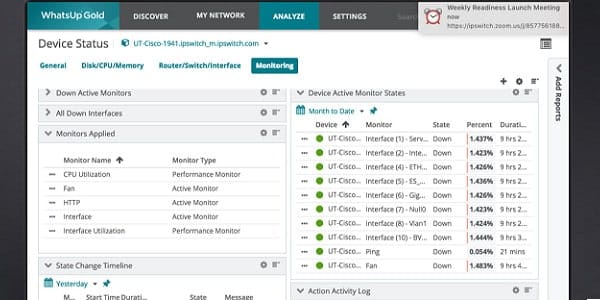
Once the inventory is compiled, you can see each device, its IP address, its type, its manufacturer, and its status. The discovery processor assigns a role to each device, which allows you to see at a glance which nodes are endpoints and which are network equipment.
Network Mapping
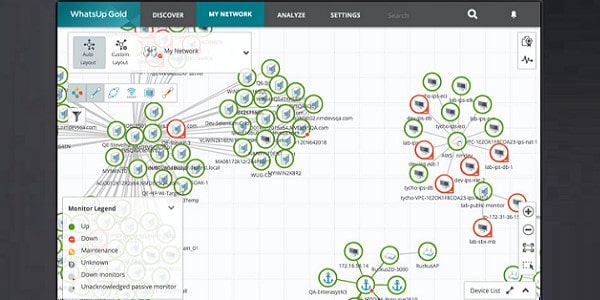
The discovery process sets up a map of your network. You can see which devices connect to which and then specify more accurate status reporting. An error in one device can cause a parent device to report an error as well. When you understand the dependencies between devices, you can categorize alerts and filter out repeats so warnings only come from the originating devices.
Statuses are color-coded in the network map to show which devices are in good health, which have issued warnings, and which are in alert status.
Network Performance Monitoring
The WhatsUp Gold Network Monitor keeps contacting the devices on the network at regular intervals. The inventory and network map statuses are near-live. You don’t have to command a system sweep because statuses are constantly updated via SNMP procedures. Essentially, it regularly reruns the network discovery process.
Server Monitoring
The status feedback collected by WhatsUp Gold varies depending on the piece of equipment being monitored. Servers provide more detailed physical statuses including CPU, memory, and storage capacity and utilization.
Alerts
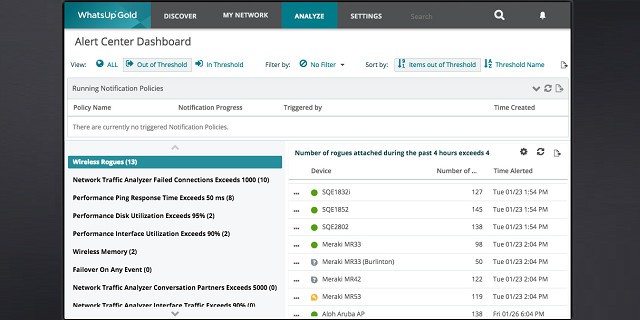
The SNMP system includes a channel for each device agent to notify the central controller of an alert condition rather than waiting to be asked during the regular system sweep. These notifications are called “traps,” and WhatsUp Gold integrates them into its alert notification system.
In the settings of the monitor, you can specify how the system deals with alerts. These “action policies” instruct the monitor to notify a team member by email or SMS message.
The policies allow you to escalate or ignore certain alerts depending on their source and warning type. Alerts notifications don’t all have to be sent to the same person. You can specify who gets what alert according to the type of device that originated the error message. If support services were included with the purchase of equipment, you can send error notifications straight to the manufacturer’s support team.
When an alert arises, you can automatically run actions like logging, restarting, or launching a script.
Wireless Network Monitoring
The performance monitoring of WhatsUp Gold extends to wifi networks. The network discovery process maps your wireless network equipment and traces the endpoints connected to each. If you have a hybrid wired and wireless network, all of the nodes of both systems appear on a unified network map.
Cloud & Storage Monitoring
Network storage on your premises is regarded as a server and so is mapped and monitored along with all of your other network-connected servers. These days, many businesses employ cloud services for storage, both as a backup system and for extra off-site capacity, and to get cloud-based apps for staff. The standard package of WhatsUp Gold includes cloud and storage monitoring.
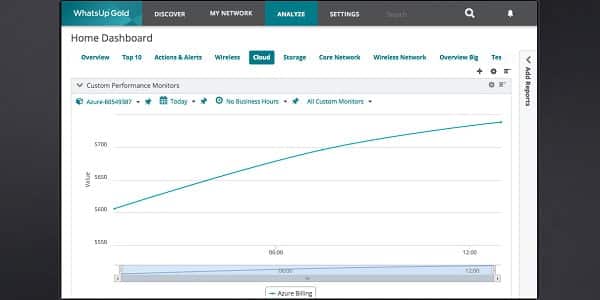
Azure and AWS off-site servers are shown on your network map. You can zoom in on the map to view connections to cloud services. You can see how off-site services integrate into your network and focus on the performance of each server, checking the throughput that your business generates on each, which is very useful information if you use a metered service.
All of the monitoring metrics that WhatsUp Gold provides for networks apply to cloud services, so you can set up alerts for connection delays or traffic volumes to improve visibility. You can also see downtime of each off-site server.
Distributed Monitoring
If your enterprise has several sites, you can integrate their networks into one single WAN and monitor it all from a central location with WhatsUp Gold. Centralized network management requires distributed monitoring, which is included in the standard WhatsUp Gold package.
You will have to buy a separate license for each site; however, you don’t have to run separate instances of the monitor. If you do have network staff at remote sites, you can make the performance monitor available there, and transfer performance data to your central network management HQ.
The central map of the network consolidates the networks at each site and presents them as one network.
Customizable Dashboard and Reporting
WhatsUp Gold ships with a standard dashboard and pre-written reports. The layout and design of these screens and reports are well-planned, but you don’t need to stick to them.
Create your own customized report layouts to present information of specific interest to different stakeholders. You can even make a report console available to different people in your organization, limiting the available reports according to that user’s role.
Similarly, WhatsUp Gold lets you create different dashboard layouts. With this widget-based console, you can generate different views of the network and assign varying alerts to each user or user group. This flexibility even means you can grant limited access to a specialized dashboard to customers, service providers, and other external parties. Customized alerts allow you to send network messages and schedule announcements to team members.
WhatsUp Gold packages
All of the features listed above are available in the lowest level package of WhatsUp Gold. The standard package is available in three editions: Good, Better, and Best. You get more features if you take on a higher-priced package.
The Good package includes the features described above. You can buy a number of add-ons that in addition to these utilities. The Better package bundles the Network Traffic Analysis add-on. The Best package includes the Network Traffic Analysis and Configuration Management add-ons. Progress also offers a Total Plus package that contains almost all of the available add-ons. These are:
- Network Traffic Analysis
- Configuration Management
- Application and Web Monitoring
- Virtualization Monitoring
- VoIP Traffic Monitoring
- Scalability Pollers
One more add-on, paid for as an extra service no matter which package you buy, is the Failover Manager.
You can read more about these add-ons below.
Network Traffic Analysis
Network problems are often caused by devices, but just checking on device status doesn’t give you the whole picture of your network’s health. Traffic flows are very important to network service delivery. The Network Traffic Analysis add-on of WhatsUp Gold effectively keeps track of those factors.
Different manufacturers include messaging systems with their network equipment. These built-in notification languages give a lot of information about the traffic flows on your network. However, they need to be captured and interpreted before they become useful.
The Network Traffic Analyzer focuses on these notification messages and can process messages written in the NetFlow system of Cisco Systems, Juniper Networks J-Flow, and also the sFlow, NSEL, and IPFIX systems. This enables you to implement class-based Quality of Service by tagging and prioritizing certain traffic.
Data flow information can isolate heavy traffic events such as downloads and schedule them for low-demand hours. Using such methods, you can avoid expanding the network and smooth out demand instead.
The analyzer stores traffic metrics for examination in its planning module. You can predict potential traffic congestion caused by new applications based on standard traffic flows from the current demand for your infrastructure.
See also: NetFlow vs sFlow
Configuration Management
The Configuration Manager add-on stores the configurations of all of your network devices. Once this baseline has been created, you can set it to monitor for unauthorized changes to the setup of any device.
Those unauthorized changes might be performed by a system administrator. In this case, we are talking about accidental changes or errors made during the configuration update process. Thanks to the backup store, the original setup can be restored at the touch of a button.
The Configuration Manager integrates SNMP alerts to let you know when anyone changes the settings of a network device. All actions related to device configuration are logged, giving you a timeline of changes.
Application and Web Monitoring
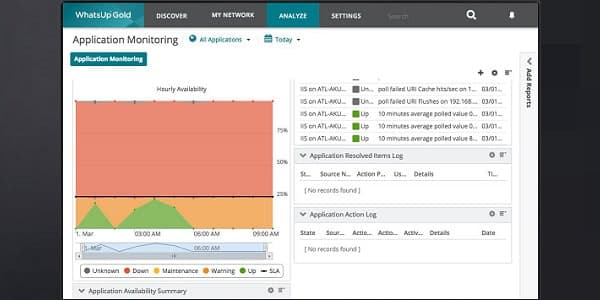
Adding application monitoring to WhatsUp Gold gives greater detail on traffic monitoring efforts. This module identifies which applications and protocols generate the most traffic on your network.
Adding application monitoring to WhatsUp Gold gives greater detail on traffic monitoring efforts. This module identifies which applications and protocols generate the most traffic on your network.
Typical applications covered by this module include Apache web server, SQL Server, IIS, Active Directory, Exchange, and Sharepoint. If you install the applications monitor, you can refine the alerts generated by WhatsUp Gold. As well as getting traffic alerts by volume, you can set application-specific triggers that notify team members of out-of-bounds events. You can set up custom alerts that monitor the performance of any applications developed in-house.
Virtualization Monitoring
If you implement Hyper-V or VMWare virtualization, you should consider the Virtualization Monitor, which keeps a closer eye on your virtual environment than the standard network monitoring that WhatsUp Gold can deliver. A map of your virtualization displays hosts, guests, host/guest relationships, clusters, and live statuses.
The server data given by the Virtualization Monitor lets you see utilization metrics for CPU, memory, and storage. You can monitor the load on interfaces and see which server/guest path generates the most traffic. The monitor integrates performance alerts and you can plan your machine to server allocation better once you see the load on each host.
VoIP Traffic Monitoring
The WhatsUp Gold VoIP traffic monitor generates reports on call quality. The dashboard of the VoIP monitor shows damaging problems such as jitter, packet loss, and latency. If any of these gets out of control, it is time to act and adjust the settings on your VoIP devices.
The monitor integrates SNMP messaging and Cisco IP SLA standards to gather source data for the interface. You can generate graphs of performance factors, such as the Mean Opinion Score and the Capacity Planning Impairment Factor.
The performance monitor extends its reach out over the internet and can keep track of site-to-site performance on WANs.
Scalability Pollers
Scalability pollers add extra network data agents that expand the monitoring capabilities of the WhatsUp Gold system.
Certain operations cannot be monitored by scalability pollers and must be left to the standard reporting agents built into the WhatsUp Gold package. You could probably get away without buying any extra pollers, so it would be best to buy the main WhatsUp Gold package and wait to see whether you need extra agents before investing in scalability pollers.
Failover Management
The Failover Management module offers both automatic and manual failover actions. This system diverts monitoring traffic to alternative servers should problems occur with the server that hosts WhatsUp Gold. Failover conditions can be set as rules to create an automatic failover. A manual failover gives you the option of setting diversions temporarily, such as during maintenance of essential equipment.
Pros & Cons
Pros:
- Intuitive Visualizations: Provides at-a-glance insights with simple, effective visual tools.
- Modular Pricing: Offers flexible pricing based on selected features.
- SMB-Friendly: Ideal for small to medium-sized business environments.
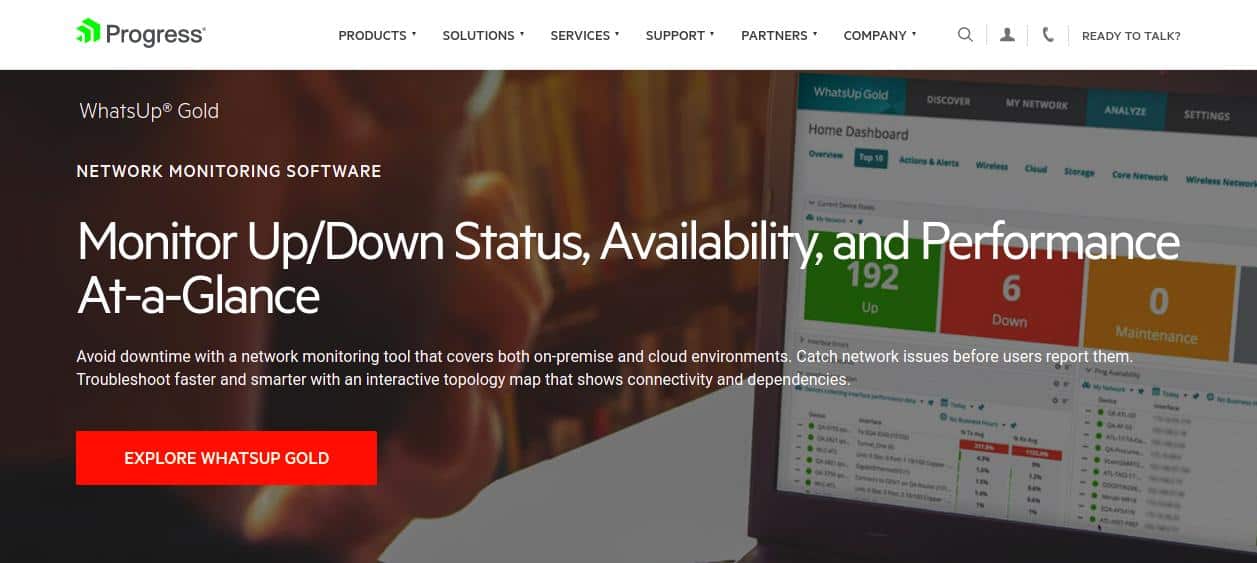
- High-Quality Dashboards: Features excellent visuals for dashboards and reports.
- Comprehensive Monitoring: Monitors LANs, WANs, and cloud applications, including container environments.
Cons:
- Modular Upgrades: May not suit users who need a comprehensive monitoring solution out-of-the-box.
How much does WhatsUp Gold cost?
You can get WhatsUp Gold on an annual subscription, or opt to buy a perpetual license. The main edition of the system is called Premium and is available in three flavors: Good, Better, and Best.
The Good package offers all of the basic modules, as explained above. This costs $990 per year and covers 50 devices.
The Better pack covers 100 devices and includes the Network Traffic Analysis add-on. It costs $1,990 per year.
The Best pack also monitors 100 devices and includes the Network Traffic Analysis and Configuration Management add-ons. It costs $2,990 per year.
To get any of these packages perpetually, you have to contact the Progress sales team. The minimum price for the Good pack comes in at $2,656.50 for a permanent license.
The Total Plus pack isn’t available on subscription. This includes all of the WhatsUp Gold add-ons except for the Failover Manager. A license for this package starts at $7,950.
What are the system requirements?
WhatsUp Gold runs on:
- Windows Server 2008 R2
- Windows Server 2012
- Windows Server 2012 R2
- Windows Server 2016
The demo version runs on:
- Windows 7 Pro
- Windows 8.1 Pro
- Windows 10 Pro
For the smallest monitoring footprint of 100 devices, your server should have:
- 8 GB of RAM
- 25 GB of space on your hard drive
For an implementation of 2,500 devices you need:
- 16 GB of RAM
- 415 GB spare on your disk
To monitor 20,000 devices your server needs:
- 64 GB of RAM
- 2,715 GB spread across the application, database, and log servers
You need to be running SQL server 2014 for the smaller network implementations of WhatsUp Gold and you will need SQL Server 2008 R2, 2012, or 2014 for a larger network.
WhatsUp Gold Assessment
Those of us who have been monitoring the evolution of WhatsUp Gold over the years have noticed the system is now starting to challenge industry leaders. Progress has invested a lot in presentation as well as back-end functions, creating a very attractive dashboard with a large number of widgets to choose from.
The adaptability of the Dashboard and the ability to assign different views on the application to different user groups mean that this network monitoring utility will be of great interest to large corporations with networks that require a team to manage them. WhatsUp Gold can now cater to all sizes of enterprise.
Progress offers a 30-day free trial of WhatsUp Gold, so you can assess the tool for yourself risk-free.





WUG looks very pretty, but personally I have found many usability issues, and when setting up performance monitoring there are quite a few things you can’t do which seem quite obvious tasks, like having parameters defined for the measurement instance on the host which get passed to the scripts in the library.
Despite the steep learning curve, and it not being as pretty, Zabbix would be my preferred monitoring solution, particularly since it works more effectively across different platforms.
Hi, Paul,
Thanks for sharing your opinions. I know what you mean about Zabbix, I really like that one, too. What size of network do you manage? I would rank WhatsUp Gold as a good fit for a medium-sized network. I would recommend Zabbix for a smaller network. The reason for that is because WhatsUp Gold is able to split out the control screens so you can create different user accounts for team members. You are right about the steep learning curve on WhatsUp Gold. When you take it on, there is a lot of work needed to decide which worker function needs which dashboard features. Once you split out the capabilities by job title, things get a whole lot easier.