Ensuring the health and performance of an organization’s IT infrastructure is essential for minimizing downtime and optimizing operations. To achieve this, network monitoring tools play a crucial role by providing real-time insights, tracking performance metrics, and alerting administrators to potential issues before they become major problems.
Among the most popular network monitoring solutions are Paessler PRTG Network Monitor and SolarWinds Network Performance Monitor (NPM), two industry-leading platforms that offer reliable features for managing and troubleshooting network environments.
SolarWinds NPM is known for its user-friendly interface and powerful monitoring capabilities, offering extensive features for monitoring network devices, servers, and applications. Its scalability and ease of integration make it a preferred choice for medium to large enterprises looking to ensure network uptime and performance. With its customizable dashboards and automated alerting system, SolarWinds NPM allows network administrators to quickly identify and resolve issues, providing a view of the network infrastructure.
On the other hand, Paessler PRTG is a versatile network monitoring tool that offers an all-in-one solution for monitoring a wide variety of devices and systems. PRTG is designed with flexibility in mind, providing a comprehensive range of sensors to monitor everything from bandwidth usage to server health. It offers an easy-to-use interface and features such as automatic network discovery and real-time reporting, making it an ideal choice for businesses of all sizes.
This guide will compare SolarWinds NPM and Paessler PRTG Network Monitor, examining key features, ease of use, scalability, and pricing to help businesses choose the best solution for their network monitoring needs. By understanding the strengths and differences of each tool, organizations can make an informed decision to enhance their network management strategy and improve overall performance.
Overview
Below we’ve included a table with an overview of the features of each product showing how they stack up against each other:
| Features | SolarWinds Network Performance Monitor (FREE TRIAL) | Paessler PRTG Network Monitor (FREE TRIAL) |
|---|---|---|
| Autodiscovery | Yes | Yes |
| Customizable dashboard | Yes | Yes |
| User Interface | Windows GUI and Web-based GUI | Windows GUI and Web-based GUI |
| Alerts and Notifications | Email, SMS, custom trigger conditions | Email, SMS, Push Notifications, Mobile App, Create own scripts |
| Network Monitoring and Flow Support | SNMP (NetFlow, J-Flow, IPFIX, sFlow and NetStream w/ SolarWinds NetFlow Traffic Analyzer | SNMP, WMI, NetFlow, sFlow, IPFIX & J-Flow |
| Reporting | Customizable and 100 default templates | Customizable and scheduled reporting |
| Pricing | Available from $2,955 (£2,269) | Available for free for less than 100 sensors, paid versions starting from $1600 (£1,228) |
Setup
The setup process is one of the most important factors to consider when deploying a new program. The ease with which you can complete the setup process determines how easy it is to deploy your program of choice. Paessler PRTG Network Monitor operates with a core server and one (or more) probes. This keeps the setup process relatively simple as you monitor your entire network with a single server.
You can download Paessler PRTG Network Monitor for Windows in about five minutes. You are taken through the configuration process by the Configuration Guru which requests information from the admin so that you have login credentials for future use. The setup process is quicker than other products as Paessler PRTG Network Monitor stores data in its own unique system rather than an SQL database.
Paessler PRTG Network Monitor’s setup also has the advantage of fostering scalability for larger organizations. The setup is multilayered and you can upscale your servers, probes, and sensors to keep up with your requirements no matter what size your organization is.
In comparison, SolarWinds Network Performance Monitor requires a little more investment. SolarWinds Network Performance Monitor requires around 800 MB of space to install, which is considerably more than Paessler PRTG Network Monitor. You also need a number of additional Windows solutions such as Microsoft SQL Server 2005 SP3 or later and Windows server 2003 or 2008. You also need a .NET Framework 3.5 or higher.
This is a little harder than Paessler PRTG Network Monitor but it isn’t exactly complicated either. However, in terms of lightweight deployment, we have to give the edge to Paessler PRTG Network Monitor here. The basic setup is easy to use and it lays the groundwork to be ready for future upscaling.
Network Discovery (and Autodiscovery)
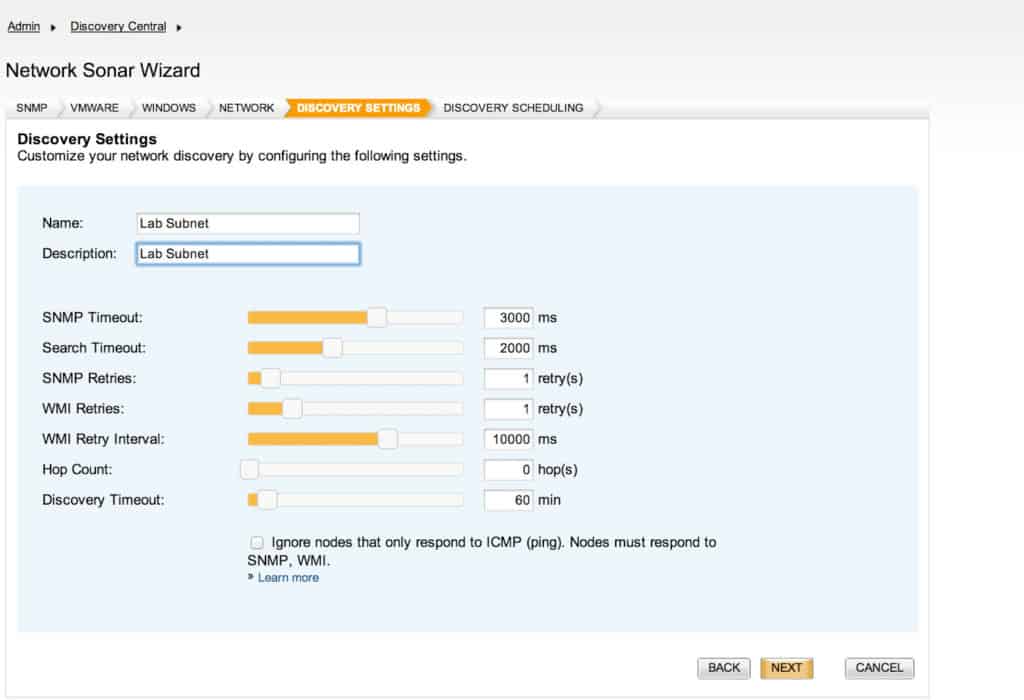
The next feature we’re going to look at is network discovery. Network discovery is part of the setup process but it deserves its own section so we can further analyze what each program has to offer. On SolarWinds Network Performance Monitor there is an autodiscovery process that begins as soon as you finish the initial setup. The autodiscovery feature will automatically recognize devices in your network so that you don’t have to enter their information manually.
The main advantage of this is the time savings. On devices without an autodiscovery feature, it is very inconvenient to go through each device and add it to your network. An autodiscovery feature makes SolarWinds Network Performance Monitor suitable for fast deployment and saves you time which you can use to do more important things.
Like SolarWinds Network Performance Monitor, Paessler PRTG Network Monitor also has its own autodiscovery feature as well. With Paessler PRTG Network Monitor you can scan your network via IP ranges. Though both products have autodiscovery, SolarWinds Network Performance Monitor has the edge based on its intuitive design and excellent autodiscovery topology maps.
Dashboard and Dashboard Customization
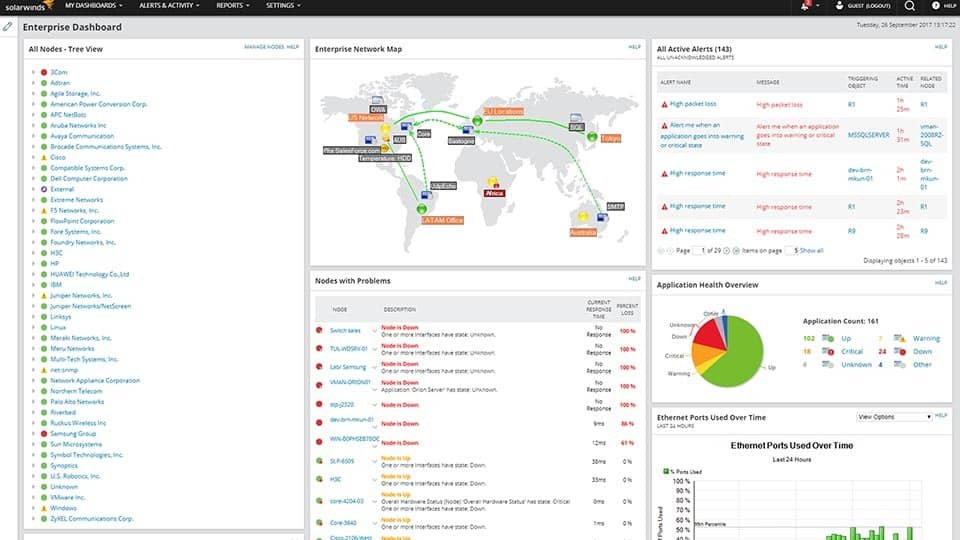
No matter what platform you’re using, most of your monitoring activity is going to take place through the dashboard. The dashboard acts as a central hub that displays your live data and shows you everything happening under the hood of your network. As a result, it is essential to have a dashboard that you can read quickly and customize.
With SolarWinds Network Performance Monitor (shown in the image above) you can customize your dashboard as you see fit. You can view devices in pie charts, graph and color-coded buttons which detail how your infrastructure is performing. Similarly, SolarWinds Network Performance Monitor also has its own PerfStack Performance Analysis Dashboard. This allows you to drag and drop usage data into a timeline to compare it with other data.
This is advantageous because you can compare disparate datasets side by side. Viewing data sets in such a way is unique to SolarWinds Network Performance Monitor and allows you to troubleshoot for certain network faults without having to look through lots of different windows.
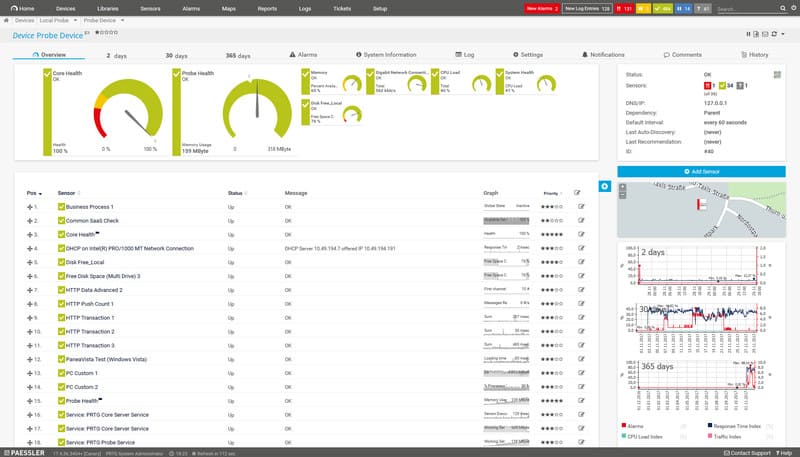
Paessler PRTG Network Monitor also offers its own customizable dashboards with a selection of dials, charts, and maps. You can actually use custom HTML code to create your own map objects. This is useful for allowing you to create a unique perspective of your network.
Based on the simplicity of the dashboard and the malleable Perfstack Performance Analysis Dashboard, SolarWinds Network Performance Monitor is the top pick here. The chance to compare disparate datasets in such a way is invaluable when analyzing a cross-section of data.
User Interface
Paessler PRTG Network Monitor and SolarWinds Network Performance Monitor both offer users a Windows GUI and a web-based GUI. This means you can access each platform online and on your device. The bulk of users on each product will gravitate towards the web-GUI based on their accessibility. This is one area where SolarWinds Network Performance Monitor and Paessler PRTG Network Monitor are evenly matched.
Alerts and Notifications
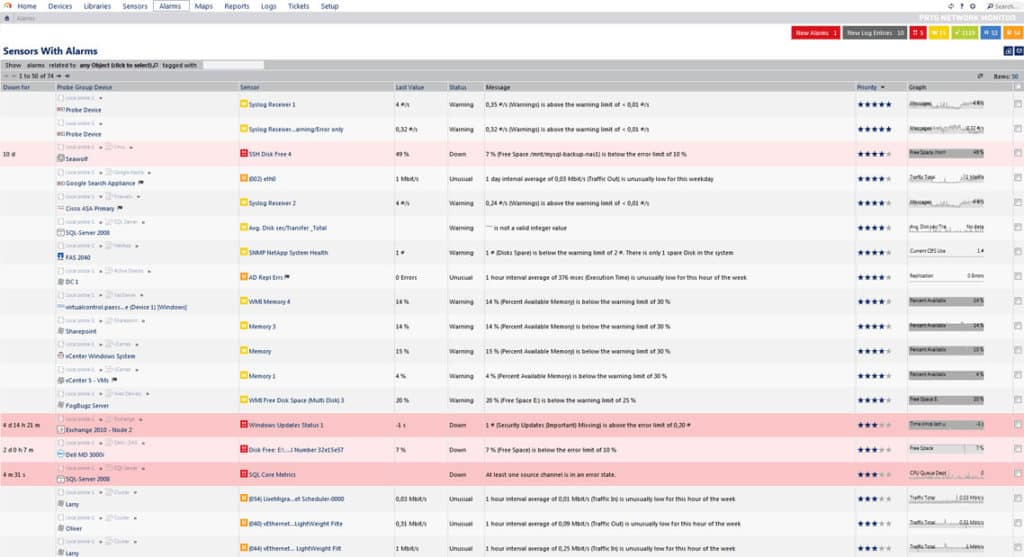
Alerts and Notifications are one of the most important features you will encounter from a network monitoring tool. Notifications are designed to keep you updated when key events happen on your network. They are exceptionally valuable on larger networks where it is next to impossible to stay on top of everything that is taking place. A notification here and there can keep you updated when you’re not sure what is going on. This is vital for keeping your service fully-maintained and online.
Both Paessler PRTG Network Monitor (pictured above) and SolarWinds Network Performance Monitor pass this with flying colors. PRTG has been designed to send you alerts to notify you once certain activities or parameters have been recognized. It not only offers you email and SMS notifications but also allows you to receive push notifications straight to your phone via the PRTG app. The PRTG app is available for Windows, iOS, and Android making it accessible to most mobile users.
However, what really stands out with Paessler PRTG Network Monitor’s alerts system is that you can design your own notification scripts. This gives you control over the type of network activity for which you want to screen. This pays dividends in allowing you to customize your network monitoring activity and adapt to the latest emergent threats.
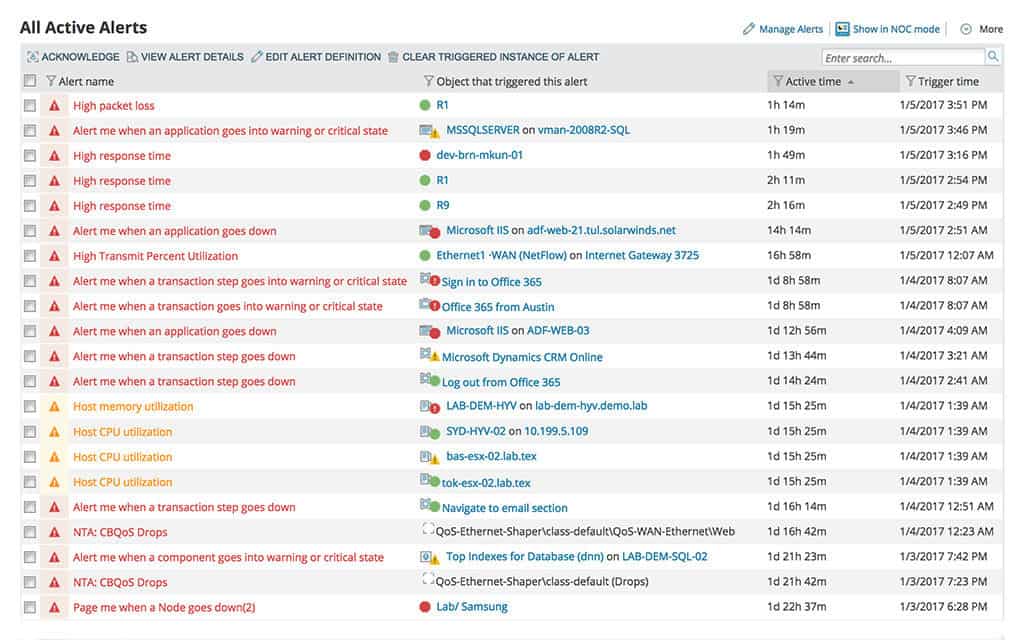
SolarWinds Network Performance Monitor also gives you a large amount of control over your alert conditions. You can create your own trigger conditions to activate alerts. With this program, the focus has been placed on cutting your alerts down so that you only have to deal with the most pressing issues at hand. You can also dictate what time of day alerts are active and to whom they are sent.
This is also an intelligent alerts system which allows you to prescribe specific actions to take once predefined criteria have been met. For example, you can send an email text or execute a program once an activity has been flagged. This allows you to incorporate a touch of automation into your event response.
Overall the alerts system offered by SolarWinds Network Performance Monitor feels more complete, although Paessler PRTG Network Monitor’s custom scripts and apps make it easy for administrators to stay on top. SolarWinds Network Performance Monitor’s intelligent alerts and simple trigger conditions system allow you to build your monitoring environment around your own needs.
Network Monitoring and Flow Support
Of course, when you download a network monitoring tool you want to know exactly how you want it to monitor your network. Both Paessler PRTG Network Monitor and SolarWinds Network Performance Monitor come fully equipped in this instance. For example, Paessler PRTG Network Monitor uses SNMP polling, WMI, NetFlow, IPFIX, J-Flow, and sFlow to gather information from your network. The spread of these monitoring features gives you a network monitor that can also run packet analysis.
SolarWinds Network Performance Monitor is available in a bundle called the Network Bandwidth Analyzer Pack. This also provides the NetFlow Traffic Analyzer, which is a flow monitoring module with the ability to communicate with NetFlow, IPFIX, J-Flow, sFlow, and NetStream. The Network Performance Monitor uses SNMP for traffic monitoring, so in order to get a fair comparison on flow monitoring, it would be better to assess PRTG alongside the Network Bandwidth Analyzer Pack. If comparing PRTG to only the Network Performance Monitor for bandwidth monitoring, PRTG is by far the better choice. You can access the Network Bandwidth Analyzer Pack on a 30-day free trial.
Network Maps
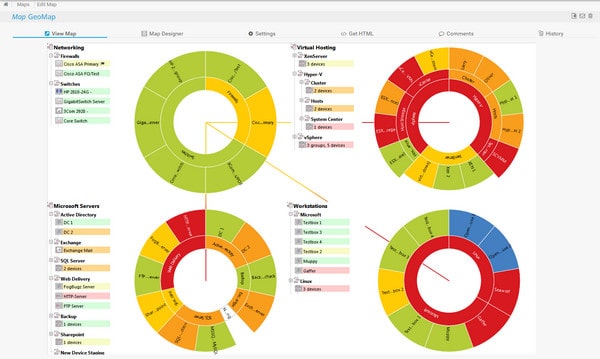
Network Maps are a feature that we don’t see enough of in network monitoring products. Sometimes taking a geographical look at your network can be just as illustrative as looking at the raw data. Fortunately, both SolarWinds Network Performance Monitor and Paessler PRTG Network Monitor (pictured above) have their own maps feature. On SolarWinds Network Performance Monitor you can view a map of your auto devices which automatically adapts to topology changes.
This means that once you add a new device to your network SolarWinds Network Performance Monitor will automatically add it to the map. Having a map that automatically updates is very useful for providing you with an up-to-date network map. This is also color-coded so if there is a device that is experiencing problems it is denoted by the color red so that you can see it easily.
Paessler PRTG Network Monitor takes another approach in that it allows you to create web pages with your own maps. These maps can be shared publicly if you need to show other members of your team any network activity you’re currently experiencing. Like SolarWinds Network Performance Monitor, this map is color-coded but the displays aren’t as easy to read.
If you require a network topology map that clearly shows you how your network devices connect with each other, then SolarWinds Network Performance Monitor is the better choice here. The maps are easy to read and you won’t have to stare for too long before realizing what is going on.
Reports
Being able to retrospectively analyze data and look upon the past performance on your network is often as important as looking at your live usage data. There are many things that you could have missed in real-time that you will notice by looking at historical data. Generating reports is the perfect way to take stock of the data you’ve processed and gives you a chance to take a microscope to your network.
Reports is an area where SolarWinds Network Performance Monitor really knocks it out of the park. There are over 100 default templates which you can use to schedule network performance reports. You can customize these so that you generate only the information you need.
Paessler PRTG Network Monitor also has its own customizable reports in place. There is a Reports tab that is dedicated to the production and management of reports. You can schedule future reports and customize how the information is displayed. This gives you a tremendous amount of control over how your network is reviewed. Once you’ve generated a report you can export it as a PDF file and send it to other members of your team.
Based on the simplicity of the reporting system, Paessler PRTG Network Monitor slightly outperforms SolarWinds Network Performance Monitor here. The report design and the ease with which you can schedule future reports eliminates the hassle of trying to monitor data retrospectively.
Pros & Cons
SolarWinds Network Performance Monitor
Pros:
- Takes a holistic approach to server performance and health monitoring
- Supports auto-discovery that builds network topology maps and inventory lists in real-time based on devices that enter the network
- Supports both SNMP monitoring as well as packet analysis, giving you more control over monitoring than similar tools
- Uses drag and drop widgets to customize the look and feel of the dashboard
- Robust reporting system with pre-configured compliance templates
Cons:
- Designed for IT professionals, not the best option for non-technical users
Paessler PRTG Network Monitor
Pros:
- Uses a combination of packet sniffing, WMI, and SNMP to report network performance as well as discover new devices
- Autodiscovery reflects the latest inventory changes almost instantaneously
- Drag and drop editor makes it easy to build custom views and reports
- Supports a wide range of alert mediums such as SMS, email, and third-party integration
- Supports a freeware version
Cons:
- Is a very comprehensive platform with many features and moving parts that require time to learn
Pricing
The competition between these two gets a little more complex when it comes to pricing.
SolarWinds Network Performance Monitor
SolarWinds Network Performance Monitor is available from the price of $2,955 (£2,269). A list of pricing options is shown below:
| SolarWinds Product Version | Elements Supported | Price |
|---|---|---|
| NPM SL100 | 100 | $2,955 (£2,269) |
| NPM SL250 | 250 | $6,720 (£5,161) |
| NPM SL500 | 500 | $10,500 (£8,066) |
| NPM SL2000 | 2000 | $19,345 (£14,865) |
| NPM SLX | Unlimited | $32,525 (£24,986) |
As you can see above there are a variety of pricing options available. However, you’ll notice that the entry price of $2,955 (£2,269) is quite high. You can evaluate NPM on a 30-day free trial.
Paessler PRTG Network Monitor (FREE TRIAL)
On the other hand, Paessler PRTG Network Monitor offers the following pricing options:
| Paessler Product Version | Elements Supported | Price |
|---|---|---|
| PRTG Free | 100 | Free |
| PRTG 500 | 500 | $1,600 (£1,252) |
| PRTG 1000 | 1000 | $2,850 (£2,231) |
| PRTG 2500 | 2500 | $5,950 (£4,658) |
| PRTG 5000 | 5000 | $10,500 (£8,221) |
| PRTG Network Monitor XL1 | XL1 | $14,500 (£11,353) |
Each of these products is competitively priced but based on the flexible pricing structure of Paessler PRTG Network Monitor and its lower entry point, we have to give this product the advantage here. The pricing is not only competitive but also allows you to monitor a number of sensors in line with the needs of your organization.
This pricing format supports large and smaller organizations in a way that SolarWinds Network Performance Monitor’s high starting price doesn’t.
With Paessler PRTG Network Monitor smaller businesses can dip their toes into the world of network monitoring without having to spend anything up to the first 100 sensors. Similarly, the starting price of the paid versions is a long way from that of SolarWinds Network Performance Monitor (even if Network Performance Monitor doesn’t restrict sensors).
Paessler PRTG is also available on a 30-day free trial for evaluation.
SolarWinds Network Performance Monitor Takes the Win
SolarWinds Network Performance Monitor and Paessler PRTG Network Monitor are two of the highest-performance products on the market right now. You’re unlikely to find many other platforms that blend simplicity with depth as effectively as these two products do. However, despite the strength of Paessler PRTG Network Monitor, SolarWinds Network Performance Monitor offers a better package on the whole.
From the rapid autodiscovery process to the brilliance of the PerfStack Performance Analysis Dashboard and customizable alerts, SolarWinds Network Performance Monitor allows you to create your own monitoring experience with minimal effort.
While Paessler PRTG Network Monitor operates a scalable setup, quality visualization, and reports of a similar quality to SolarWinds Network Performance Monitor it just doesn’t put it together in quite the same way. While the autodiscovery process of Paessler PRTG Network Monitor is good it isn’t as good as SolarWinds Network Performance Monitor’s because it isn’t as smooth.
Overall we recommend SolarWinds Network Performance Monitor to organizations looking for a network monitoring solution that gets you up and running ASAP. Smaller organizations and those looking for a scalable pricing structure are advised to go for Paessler PRTG Network Monitor as you’re covered with a range of price points from the freeware version up to the XL1 version with unlimited sensors.
See also: SolarWinds vs Zenoss

