SNMP is a protocol for exchanging information between network devices.
“SNMP is a fundamental building block for network management. It enables administrators to monitor and manage devices on the network, collect performance and utilization data, and trigger alerts when issues arise. Without SNMP, network management would be a much more difficult and time-consuming task”
We evaluated 25+ tools on the market today and here is our list of the best SNMP monitoring tools:
- Domotz (FREE TRIAL) This is a cloud-based network management system that relies on SNMP for network discovery and device status monitoring. Get a 14-day free trial.
- SuperOps (FREE TRIAL) This add-on module supports SNMP and ICMP monitoring for a wide range of devices. Start a 14-day free trial.
- ManageEngine OpManager (FREE TRIAL) A comprehensive SNMP-based network monitor that has an excellent user interface. Download a 30-day free trial.
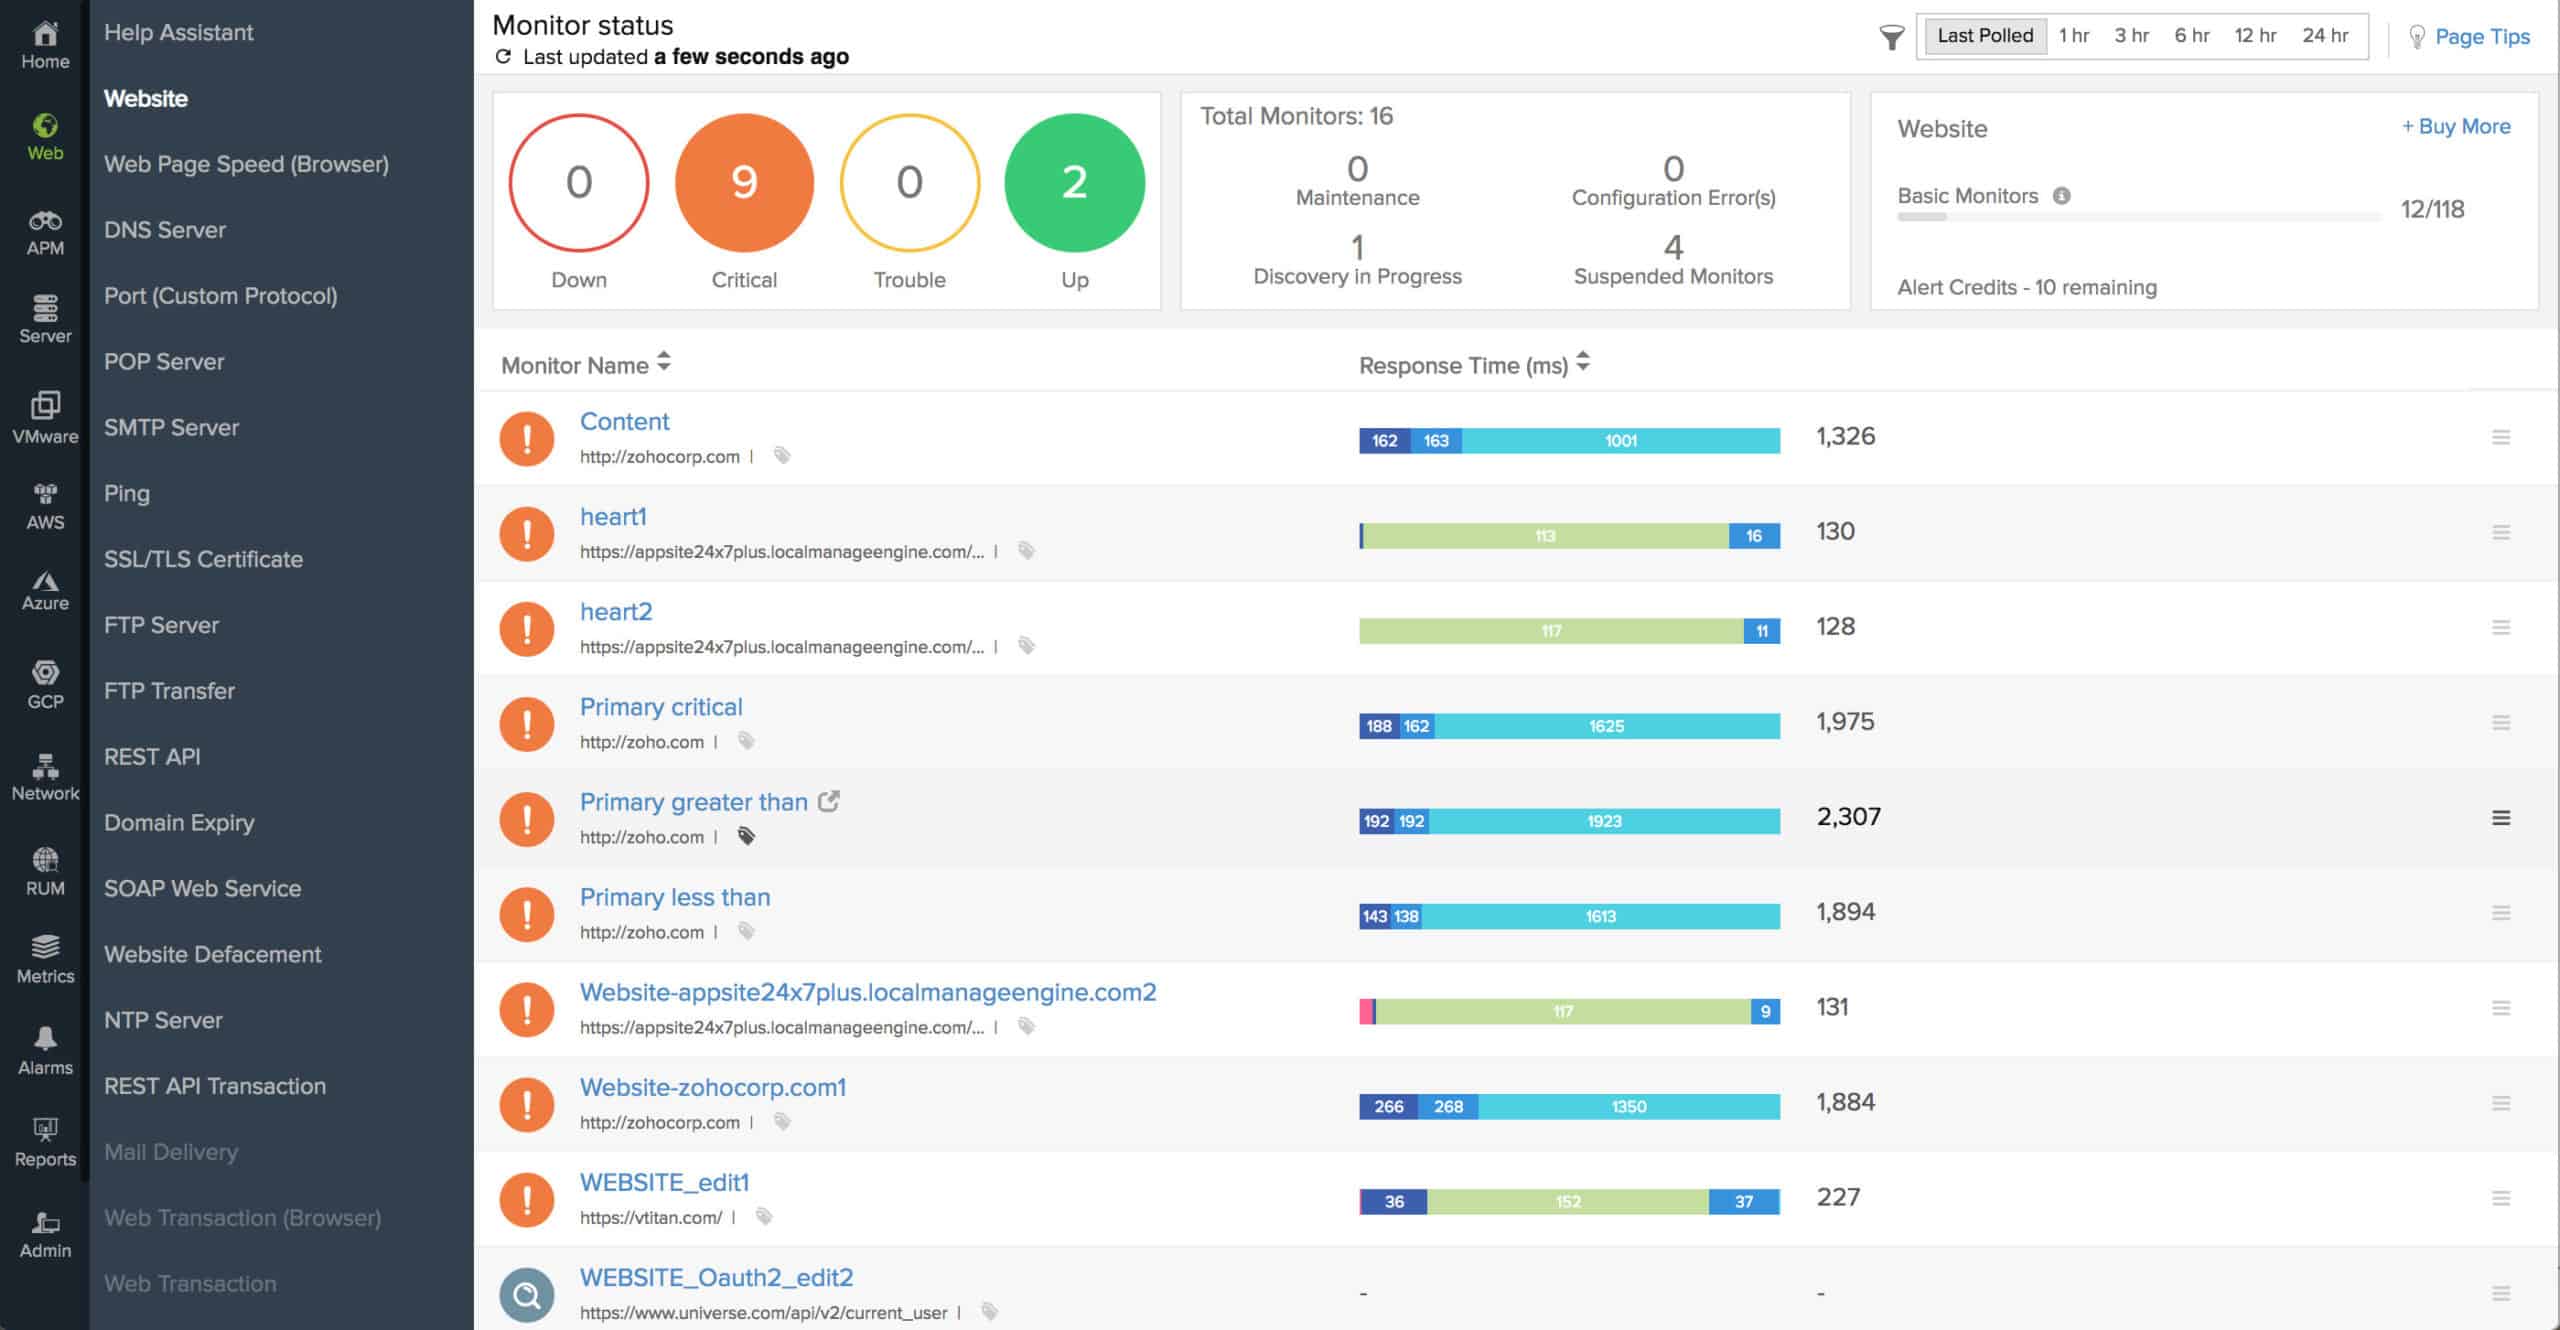
- Site24x7 (FREE TRIAL) A comprehensive IT infrastructure, applications, and user behavior monitor that uses SNMP to track network performance.
- N-able N-sight A remote monitoring and management tool that uses SNMP to track network device statuses. Based in the cloud.
- Paessler PRTG Network Monitor A comprehensive monitoring tool for networks, servers, and applications with SNMP providing data collection systems for the LAN monitoring functions.
- Datadog Network Device Monitoring This unit on the Datadog cloud platform implements network device monitoring through SNMP and also provides integration of SNMP Traps into alerts.
- SolarWinds Network Performance Monitor Uses SNMP to communicate with equipment and uses SNMP Trap receiver monitoring; The software installs on Windows Server 2016 or later.
- SysAid Monitoring A challenger SNMP-based network monitoring system that is an add-on to Help Desk software.
- Kaseya Network Monitor Part of Kaseya VSA, this monitoring tool uses SNMP to collect device statuses.
- Atera A network monitoring system that is tailored towards Managed Service Providers and is underpinned by SNMP.
There are a lot of SNMP monitoring systems available on the market today that can detect SNMP traps in real-time and let you set alerts based on automatic or user-set trigger conditions. Trap details can be logged with the time the event occurred, associated hostnames, and the type of trap event.
What is SNMP?
When organizing your network, you will be faced with a range of proprietary and open protocol-based options. The Simple Network Management Protocol is one of those options. SNMP is not a product of any single company. Rather, it is a set of guidelines freely available to everyone. If you decide to implement SNMP for your network, you will then be faced with deciding which implementation to choose.
SNMP is implemented on a wide range of hardware including network devices such as switches, bridges, routers, and gateways, and also on endpoint equipment such as printers. As such, you will discover that manufacturers already include SNMP agents on the operating systems of the devices that you buy to include on your network.
Network managers are very familiar with the concept of protocols. The Internet Engineering Task Force manages the definition of the Simple Network Management Protocol, and it can be downloaded for free from the IETF website. SNMP fits into the application layer of the TCP/IP stack.
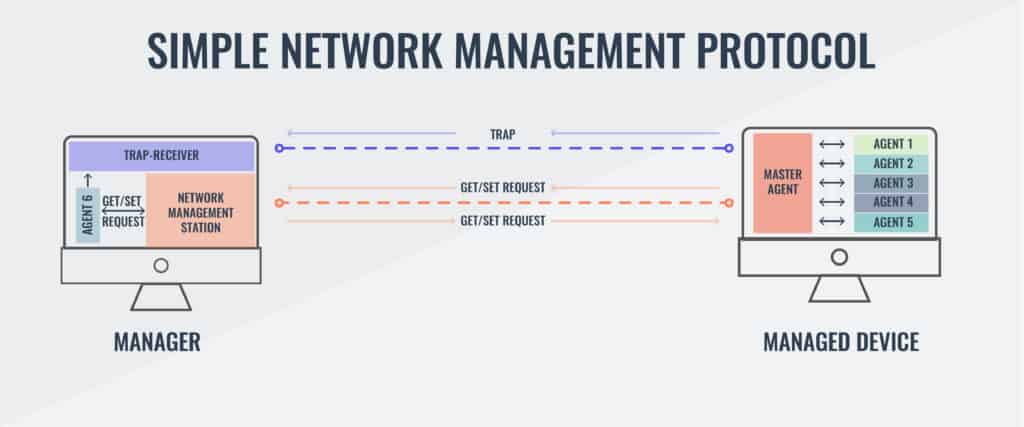
The IETF labels the protocols that it manages with a “request for comments” number, or RFC. There have been three versions developed for SNMP. These are:
| RFC 1157 | A refinement of the first definition of the protocol, known as SNMPv1 |
| RFC 1901 | This is SNMPv2c and includes improved error-handling methodologies evolving the original SNMPv2 definition, which was contained in RFC 1441 |
| RFC 3410 | The latest version of the protocol, known as SNMPv3, which has enhanced security and privacy features |
As it has been around longer, there are more implementations of SNMPv1 on the market. SNMPv1 was first defined in 1988, although earlier RFCs defined this version prior to RCF 1157.
SNMPv2 dates back to 1993. The core definition of version 2 includes a “party-based” authentication security model. This is hardly ever implemented because it uses a complicated system. SNMPv2c is the most widely used variant of version 2. This is the same as SNMPv2, except that it uses a “community-based” model for authentication. You might also see reference to SNMPv2u, which uses a “user-based” system for authentication. This is not as popular as SNMPv2c.
The extra security features of the latest version should be sought out, so aim for networking software that implements SNMPv3. This version employs user-based authentication, the same as SNMPv2u. SNMPv3 includes the ability to use transport layer protocols, such as SSH and TLS to provide encryption protection to messages.
The user-based authorization in SNMPv3 offers three statuses that can be allocated to each user:
| NoAuthNoPriv | No authentication and no encryption of the messages they send and receive |
| AuthNoPriv | Authentication necessary but no message encryption |
| AuthPriv | Authentication necessary and messages are encrypted |
An SNMP network includes the following three elements:
| Managed devices | Such as switches, routers, servers, workstations, and printers |
| Software system management agents | Run constantly to monitor the status of all devices |
| Network management system (NMS) | Requests, compiles, and stores status information. |
Now let’s take a more in-depth look at these contributors to an SNMP network.
How SNMP works
The controlling element of SNMP is the network manager. This can be installed on any computer on the network. The network manager drives the system, whereas the software system management agents’ main task is to respond to requests from the network manager.
The SNMP Manager
The network management system includes a schedule for querying agents. Each device on the network has a software agent installed on it, and the communication of SNMP takes place between the manager and the system management agents, making it unnecessary for the network manager to communicate directly with each device.
A central element of SNMP is the Management Information Base (MIB). The MIB is a communications framework and dictates the format of data communicated between the network manager and each device agent.
The SNMP standard allows for more than one manager. The responsibilities of each manager may overlap.
The SNMP Agents
The SNMP agent monitors the device on which it is installed. It creates a local MIB, maintaining the status of each category in the database, ready to respond to requests for information from the network manager. The agent does not automatically communicate with all network managers. It will only respond to managers that it has been configured to deal with. This selective communication strengthens the security of SNMP because each network manager has to authenticate its identity with credentials before an agent responds to its request.
The SNMP system includes a pre-defined information structure, which includes a little flexibility in the information that it can handle. So, you may find that the agent implementation that is already loaded onto the equipment that you buy contains some extra information slots that aren’t defined in the protocol.
The Management Information Base
The MIB structure dictates the format of information exchange in an SNMP system. Information on a device is collected by its associated SNMP agent and stored in a text file at the device. When a request for information arrives from the SNMP manager, that data is returned showing the current status of the specified parameter.
The notation of conditions and statuses is mapped in a hierarchy. This hierarchy has two forms of notation: one that uses numbers and one that uses variable names. Either naming system can be used for interaction between the manager and the agent.
The hierarchy is expressed as an addressing system. Each address is called an object ID, or OID. The addresses of each point in the hierarchy rely on inheritance. So, a root address would be 1 and then all nodes beneath that point in the tree would also include 1 in its label, such as 1.1, 1.2, 1.3, etc.
The MIB notation has been revised since it was first created. The newer version of the system is called MIB-2. The version of the notation being used for communication is written into the address. The standard address for internet resources in the addressing scheme is 1.3.6.1. This can also be written as iso.org.dod.internet. The management function of this resource has the OID 1.3.6.1.2.1, or iso.org. dod.internet.mgmt-mib-2. That last element — 1 or mib-2 — indicates that the MIB-2 address format is in operation.
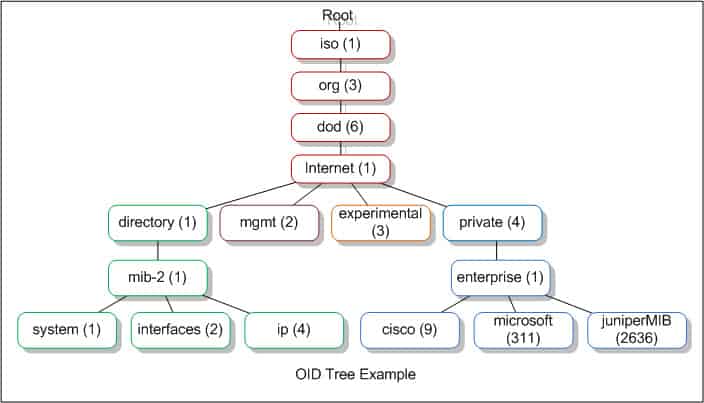
You can get more details on the meaning of OID addresses at the OID Repository. When you install an SNMP system, you don’t need to understand the entire MIB-2 addressing language because the SNMP manager dashboard will interpret these addresses for you and present the values transferred by this system as meaningful data rather than delivering a long list of variables and statuses for you to decode.
SNMP Messages
The Simple Network Management Protocol includes the definition of seven network message types, which are also known as “protocol data units.” These are:
| Get | An information request |
| GetNext | Requests next information segment |
| GetBulk | Requests a range of information categories |
| Set | Change a setting |
| Response | The reply from the agent |
| Trap | An alert |
| Inform | Acknowledges a Trap |
The SNMP manager sends out Get, Set, GetNext, and GetBulk, and PDUs. The agents send back Response PDUs. The Trap PDU is a method made available to agents to send out unsolicited alerts, and managers send Inform protocol data units to acknowledge Trap messages.
Message Types in More Detail
Here are some more details on each message type:
| Get | The Get PDU is the main method used by the SNMP manager to request information from a service agent on a specific object identifier. |
| GetNext | The GetNext message type allows the SNMP manager to work through an ordered list of OIDs according to the standard MIB hierarchy. So, the SNMP hierarchy would start at a specific point in the hierarchy with a Get request, and then continue through point by point with a series of GetNext requests. |
| GetBulk | The GetBulk request is implemented as a sequence of GetNext requests, allowing a large segment of the MIB hierarchy to be queried by the SNMP manager from a device agent. |
| Set | The Set message type is the method that the SNMP manager uses to instruct an agent to alter a setting on the device that it monitors. |
| Response | The Response message type is used by the device agents. It acts as a delivery mechanism for the requested information. In cases where no information is required back, such as with a Set PDU, the Response acts as an acknowledgment. |
| Trap | The Trap PDU enables the device agents to send out alerts to the SNMP manager. These Trap messages concern the failure of the monitored network device, maintenance issues, and other unexpected conditions. |
| Inform | The Inform message is the SNMP manager's version of a Response. It is only sent out in reply to a Trap message. This acts as an acknowledgment and the device agent will keep resending its Trap message until it receives an Inform PDU back from the manager. |
SNMP Traps
The Trap command is one of the most distinctive features of SNMP and is probably the reason why the protocol is so universally applied in the networking industry. The Trap will pick up on events that the scheduled Get requests from the manager might miss.
Network Equipment Issues
Just about all network equipment and most devices intended to connect to a network now ship with an SNMP module installed. This gives most of the hardware that you acquire the ability to send Trap messages. In most cases, the SNMP functions are turned off in the factory settings. So one of your tasks, when you plug in a new piece of kit, is to log into its administration console and turn SNMP on.
Older equipment may not have SNMP capabilities. However, that doesn’t mean that you have to throw it away. You can install an RTU to interface on it. “RTU” means “remote terminal unit.” Think of it as a modem for one piece of equipment. This device will implement SNMP monitoring on that device and send out Trap messages when error conditions are detected.
SNMP Version Issues
Different versions of SNMP can be a problem when buying network equipment. It is better to settle on one version. As SNMPv3 includes encrypted messaging and more sophisticated authentication procedures, it is best to settle with version 3.
Unfortunately, as SNMPv3 access levels are defined per user and not per device, it isn’t really backward compatible with devices running earlier protocol versions. In these instances, you can install a translator to make your equipment SNMPv3-compatible. The translator is another RTU and it can handle incoming traps from many devices, encrypt them, and convert them to the SNMPv3 standard. The only weakness of this solution is that the messaging that feeds into the RTU is not secure. If you run several sites, you will need at least one translator per site.
The issue of compatibility and newer versions is a problem that all IT managers face with all of their equipment and software. Migrating from an older version of SNMPv3 may seem to be an unnecessary expense for established businesses. You don’t need to worry about your traps running out over the internet unencrypted if you opt for a SaaS solution to network monitoring. This is because all of the cloud services run messaging through a client program on your network, which will encrypt all internet communications.
Installing SNMP manager software
SNMP capabilities are already installed on network devices out of the box. However, in some cases, that capability may be turned off. You need to make sure the SNMP service is active on each of your network devices and servers. The activated SNMP service will run constantly, starting up with the operating system. The location of the executable files and its name varies depending on your operating system.
You will get some .mib files on each of the servers on your network. These files are generated when you activate the SNMP agent and they are not properties of the collector. On Windows, these files are stored in the Windows\System32 directory. On Linux, the MIB files will be in /usr/share/snmp/mib.
The SNMP manager has a collector, a data store, and a user interface. Cloud-based network monitors still need the collector installed on a server on your network — the store and the user interface software are held on a remote server. An on-premises installation consists of installing the three elements on a server on your network. The data store can be implemented as a file or as an SQL database.
Once the agents on all of your devices and servers are operating they are ready to respond to a Get request from a collector. The installation process of your network monitor finishes with its first request broadcast. All of the agents on the network will pick up that request. The interface software of your monitoring tool will assemble an inventory from the SNMP responses. So, you don’t have to do anything to map your network and start monitoring device health.
The best SNMP monitoring tools and manager software
The ease of use of SNMP monitoring systems and the vital contribution that Traps provide make this protocol an essential part of any network administrator’s toolkit. It is great to be alerted of potentially damaging conditions on equipment and resolve those issues before the users start calling. Being proactive and discovering errors saves a fortune on Help Desk time.
The cost savings borne of SNMP monitoring in terms of Help Desk budget is further illustrated by the number of companies that offer these systems as modules in a suite of services that also includes Help Desk interoperability.
Our methodology for selecting an SNMP monitoring tool
We reviewed the market for SNMP-based monitoring systems and analyzed the options based on the following criteria:
- A service that can broadcast an SNMP Request and gather Response MIBs
- The ability to interpret MIBs into an asset inventory
- A process that generates alerts from Trap messages
- A system of thresholds on the activity data extracted from MIBs
- Nice to have a network topology mapper
- A free trial or a demo service for a no-risk assessment
- A tool offers value for money by offering a list of useful features at a fair price
Using these criteria, we identified the best SNMP-based network monitoring systems that are available on the market today. You can read about these recommended tools in the following sections.
1. Domotz (FREE TRIAL)
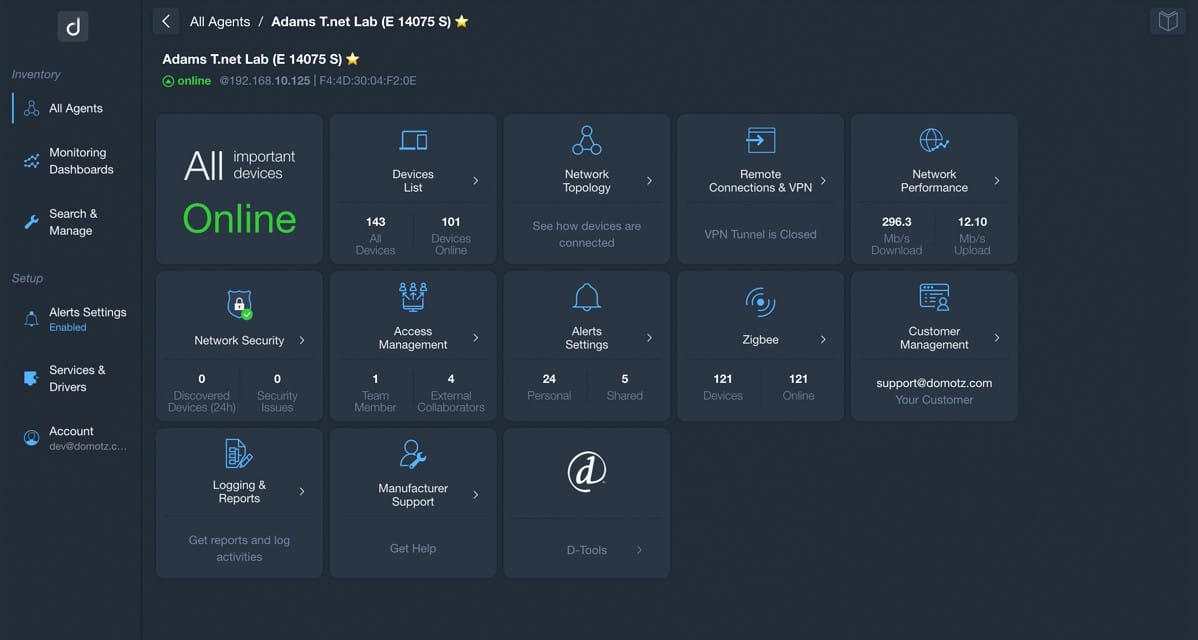
Domotz is a cloud-based network monitoring SaaS platform. Install an agent on a server and each location and you can monitor LANs and connections out to cloud services. This package is very easy to set up and you don’t need a specific operating system to use it. The network monitor is also available as a device with the software loaded onto it. Whichever format you get this tool in, you will be monitoring your network with the assistance of SNMP.
Examining the entire package, we noted the following salient points.
Key Features:
- Autodiscovery: The monitor scours the network and logs all equipment
- Multi-site operations: The tool will identify each of the sites on which its agent is installed
- SNMP-based polling: Continuously checks on the statuses of network devices
Why do we recommend it?
The SNMP component of the Domotz system is implemented by an on-site agent. This operates as the SNMP Manager and broadcasts an SNMP Request. When all devices respond, MIBs are uploaded to the Domotz cloud server. Device information is compiled into a network inventory and also provides current component statuses.
SNMP polling keeps running and that means the Domotz system constantly updates your network inventory. If you add, remove, or move a device, Domotz will see that change so you don’t have to do anything to keep your system documentation up to date.
The monitoring service tracks, switches, gateways, hubs, routers, firewalls, and wireless APs. Each interface on each device gets detailed. That’s better known as switch port mapping. The connection information derived from that inquiry enables Domotz to automatically generate a network topology map. The console can even display a world map with all of your sites plotted onto it.
SNMP can easily be activated on your endpoints, so, if you haven’t already checked, make sure all servers and workstations have that feature activated. This will include those devices in your hardware inventory and it will also populate the Domotz Server Monitoring page. This shows the statuses of your endpoints and includes those computers in the Domotz automated system monitoring program.
If it’s on the network and has an SNMP agent installed, it can be monitored by Domotz. That includes all of your equipment, such as printers, temperature sensors, security cameras, UPSs, and IoT devices.
Regular scans with SNMP identify all devices on the network, including those that you don’t know about and shouldn’t be there. This gives you a security monitoring service. You can set up alerts for new devices as well as for other conditions. For example, the Domotz system converts SNMP Traps into alerts. All alerts are shown in the dashboard and you can get them forwarded to you as notifications by email or mobile push systems. You can also get them automatically fed into your Service Desk system as tickets.
Who is it recommended for?
Domotz provides an affordable option for small businesses in its Pro edition with a rate per site per month. Larger organizations can get the more extensive Enterprise edition, which is priced by negotiation. The platform also offers a multi-tenant architecture for managed service providers.
Pros:
- An affordable per-site rate: It doesn’t matter how many devices you have on your site, the price is the same
- Discovery and tracking for IoT devices: The system isn’t limited to monitoring network equipment
- Deployment options: Access the SAaS platform or buy the service loaded onto a network device
Cons:
- No perpetual license option: You can only get this system on a subscription
The onboarding process with Domotz starts when you sign up on the Domotz site for a 14-day free trial or the Pro edition.
2. SuperOps (FREE TRIAL)
SuperOps SNMP monitor uses both SNMP and ICMP to monitor the health and availability of all the devices that connect to your network. It supports many device categories and provides information about them in real-time. Its proactive alerts can help with troubleshooting as well.
Here are the key features that we think our relevant, based on our tests.
Key Features:
- ICMP and SNMP: Supports the use of both ICMP and SNMP protocols for monitoring devices.
- Custom Monitoring: Provides the option to add custom SNMP OID monitors.
- Integrated RMM: Offers detailed insights into remote devices as well.
- Alert Policies: Enables you to configure alert policies by specifying thresholds.
Why do we recommend it?
SuperOps is a tool that offers all-in-one network visibility, as it can monitor endpoints of different categories. It uses ICMP and SNMP to collect data from these devices to analyze their health and performance, and presents the data in a single console. This consolidation eliminates the need for multiple tools.
It uses probes and one-click onboarding to make it easy for your team to monitor any device within minutes. Moreover, it supports all classes of devices, like printers, routers, switches, firewalls, load balancers, IP cameras, and more.
Using SuperOps, you can set up customized thresholds. Accordingly, the tool will send alerts when these thresholds are breached. Also, the ICMP and SNMP monitoring enables you to take quick action before the issues escalate.
Who is it recommended for?
SuperOps is a good choice for enterprises looking for a comprehensive monitoring platform. It is also ideal for MSPs who have to handle remote devices for their clients.
Pros:
- Unified Platform: Combines ICMP, SNMP, and SSH tools in a single console, reducing tool sprawl.
- Fast Onboarding: Quick to set up and easy to use.
- Custom OIDs: Enables you to monitor any metric via custom SNMP OIDs.
- Alerts: Sends alerts when threshold values are exceeded.
Cons:
- Add-on: This is an add-on module and can cost extra.
SuperOps offers four pricing plans. Note that all amounts are USD/technician/month, billed annually.
- Standard PSA Only – $79.
- Standard RMM Only – $99.
- Pro Unified Basic – $129.
- Super Unified Advanced – $159.
Start a 14-day free trial.
3. ManageEngine OpManager (FREE TRIAL)
ManageEngine OpManager is a very comprehensive facilities management tool that includes network mapping, configuration management, traffic analysis, WAN link monitoring, network status monitoring, and even a specific module for VoIP traffic management.
When we tested ManageEngine OpManager we found the following key features.
Key Features:
- Monitor Endpoints and Networks: Activate SNMP on your endpoints to include them
- SNMP System: This package acts as the SNMP manager
- WAN Links: Tests connections between sites and cloud services
Why do we recommend it?
ManageEngine OpManager combines network and server monitoring. This gives the package the capability to monitor cross-stack systems, such as virtualizations. In terms of SNMP monitoring, OpManager is probably the main rival to SolarWinds Network Performance Monitor. ManageEngine is one of the leading providers in the system monitoring tools sector and has a long history in the field. OpManager is one of the company’s longest-running products, making it a reliable and well-tested package.
The first day of an OpManager install involves network discovery and mapping, which the management software can carry out automatically. The system uses a range of protocols to keep track of the performance of equipment and infrastructure. SNMP is used in conjunction with WMI and CLI to provide process monitoring and system health monitoring. WMI is Windows Management Instrumentation — this technology can sometimes put extra load on a network, whereas SNMP is a very lightweight system.
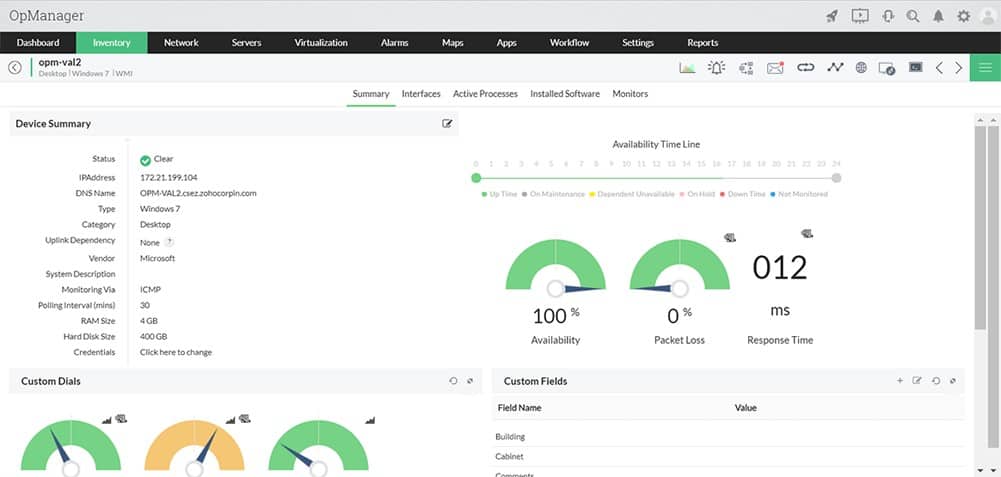
Monitoring data can be accessed from mobile devices, which helps you keep on top of situations when you are out of the office or on a site visit. Overall, the management console is beautiful. Topology visualizations are map-based for multi-site networks, and colorful graphs and dials make quick overview checks fruitful.
The Configuration Management module helps you keep track of software version statuses and enables you to patch and update remotely from one central location.
You can analyze traffic by application and get network load visualizations that show overloaded or underutilized infrastructure at a glance. These facilities extend into security management because you can get alerts on exception traffic levels from certain devices, specified applications, or both. This demonstrates where unusual activity occurs, and traffic analysis tools can help you packet sniff problems to identify irregular system usage.
The Trap processing element of OpManager can process 300 messages per second, giving collated feedback on arising equipment problems and failures. Logging functions include trap conditions. Other logs are an event log for security purposes and Syslog interpretation that highlights critical conditions in all system logs. The visibility of network performance is made easier by monitoring templates, which are pre-written reports that source live data from the entire monitoring system.
Who is it recommended for?
ManageEngine OpManager has a few marketing advantages over SolarWinds Network Performance Monitor because, while both systems are self-hosted packages for Windows Server, OpManager can also be run on Linux, or on the AWS and Azure cloud platforms. Thus, businesses that don’t have hosts running Windows Server would opt for this package. Another advantage that ManageEngine has is that its starting price is considerably lower that the SolarWinds NPM base package. This makes the tool more appealing to small businesses. There is a free version of OpManager, but this is limited to monitoring three devices, which would only be suitable for very small businesses.
During our testing, we identified the following pros and cons related to ManageEngine OpManager.
Pros:
- Wired and Wireless: Monitors wireless networks and well as LANs
- Choice of Layout Visualizations: Get floor plan layout and rack views as well as network topology maps
- Virtualization Monitoring: Hyper-V, VMware, Citrix Xen, and Nutanix HCI
Cons:
- No SaaS Option: A software package for Windows Server, Linux, AWS, and Azure
OpManager comes in three different editions – Standard (10+ devices starting at $245), Professional (10+ devices starting at $345), and Enterprise (250+ devices starting at $11,545). The free edition can monitor up to 3 devices. You can download OpManager on a 30-day free trial.
4. Site24x7 (FREE TRIAL)
Site24x7 is a cloud-based service, which probably points towards the common format of the future for infrastructure monitoring systems – the network monitoring software does not need to be resident on a server that is directly connected to that network.
When we tested Site24x7 we found the following key features.
Key Features:
- Cloud Platform: This is a SaaS platform
- Full Stack Observability: SNMP monitoring is partnered by traffic analysis and server and application monitoring
- System Discovery: Scans a network and records all its devices
Why do we recommend it?
Site24x7 provides SNMP network device monitoring in all of its packages. This cloud platform has many specialized system monitoring modules and a subscription gets you access to all of them. This is a good opportunity to get a full-stack automated monitoring package. As with PRTG, the SNMP monitor is the core routine in the package because it assembles the IT asset inventory and network topology map that all of the other monitors need to refer to for context. A nice feature of this package is that it gives you network traffic monitoring as well as device monitoring.
The distance of the remote server that hosts the monitoring software from the network that is being monitored only requires an internet connection to ‘bridge’. Many business managers may be nervous about network information being let outside the building, particularly in these days of heightened cybersecurity attacks.
An essential element for any business service delivered remotely is connection security. Site24x7 addresses these concerns by encryption communication between their servers and the networks of their customers. Another potential security weakness lies in the communication between technicians at the client site and the console resident on the Site24x7 server. Those communications are also protected by encryption.
So, the remote nature of Site24x7 shouldn’t raise concerns. The network monitoring section of this service relies on SNMP to discover devices, generate a device inventory, and draw up a network topology map.
The monitor communicates with switches and routers through SNMP procedures. It also monitors network appliances, such as firewalls, wireless network access points, cloud resources, and internet connection for WANs.
Site24x7 also monitors server performance. While SNMP provides pre-installed agents on switches and routers, servers can only be fully monitored through the installation of a dedicated Site24x7 agent. The existence of SNMP agents in the firmware of network devices is a distinct advantage. Not all network managers like the idea of installing agents on-site for access by remote monitoring services, so Site24x7 gives customers the option of working on an agentless model. However, that strategy reduces the amount of information that the monitor can extract from the client’s servers.
Who is it recommended for?
As it is a cloud-based package, this service competes directly with the SaaS version of PRTG and then, to a lesser extent, Domotz and Datadog Network Performance Monitoring. The bundle of services in a typical Site24x7 system seems like a great deal on first inspection. However, the prices shown on the system’s website are for small capacity, and larger companies have to add on extra fees to get sufficient capacity. So no one but the smallest businesses will pay the low rate shown in the price list. That’s something to keep in mind when comparing the tools on this list by price. Site24x7 also offers an MSP edition.
During our testing, we identified the following pros and cons related to Site24x7.
Pros:
- Network Documentation: Hardware inventory and Layer 2 network map
- WAN Monitoring: Tests connections between sites and cloud platform
- Performance Alerts: SNMP Traps and performance problem notifications forwarded by SMS, email, and voice call
Cons:
- No On-Premises Version: Cloud only
The Site24x7 service is charged for on a subscription basis, which is an attraction for startups and cash-strapped SMBs because they don’t have to pay the full cost of the monitoring software upfront. Even better, there is a free version of the service for very small networks with up to five servers or websites to monitor. The paid version of the service is marketed in four editions. You can gain access to a free trial that lasts for 30 days.
5. N-able N-sight
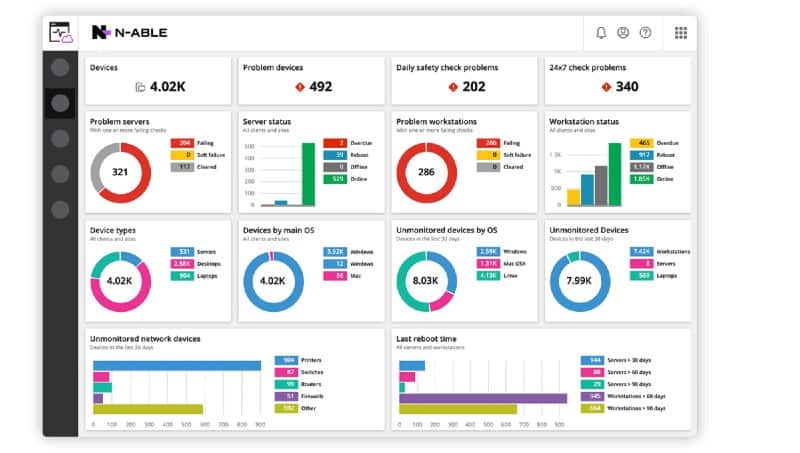
N-able Remote Monitoring and Management (RMM) is an infrastructure management system that is delivered from the cloud. This tool supports IT departments in their task of managing several remote sites from one central location. The network monitoring part of this system management bundle is based on SNMP.
When we tested N-able Remote Monitoring and Management (RMM) we found the following key features.
Key Features:
- Designed for MSPs: Includes a multi-tenant architecture
- Automated Network Monitoring: Uses SNMP routines for device status checks
- Full Stack Observability: Provides network, server, and software monitoring
Why do we recommend it?
N-able N-sight is designed for use by managed service providers – as are all of the products with the N-able brand. This is a remote monitoring and management package, which means it provides much more than just SNMP network device monitoring. This system includes full-stack system monitoring with a high degree of automation. It also includes automated system management tools, such as its patch manager, tools for manual troubleshooting, such as a remote access utility, and a ticketing and billing feature.
As with most SNMP-based monitoring systems, the N-able N-sight takes the role of SNMP Manager. It broadcasts status requests at regular intervals and receives back the MIB responses from device agents. Those responses get quickly interpreted into live performance data shown on the screen.
A big advantage of the SNMP service is that the monitor doesn’t need to know anything about the network in order to get started. The responses to the first report request enable SolarWinds RMM to assemble a full network inventory. This list of devices is always checked whenever each successive status poll result comes in, so devices are added or removed from the list accordingly, creating a live update to the network inventory.
The status reports of the N-able N-sight dashboard are enhanced by that other SNMP innovation, the trap message. When the remote monitoring and management software receives a trap message, it generates an alert, which is shown on the dashboard. This alert can also be sent out to key staff as an email or SMS message.
Alerts can be customized or downgraded through the settings of the RMM. For example, the network manager can set up a custom alert based on a combination of inputs. As well as alerts, the N-able N-sight receives warning statuses, which are less severe. A combination of warnings can be specified as an alert condition.
Unlike many network monitoring tools, N-able N-sight includes an automation manager. This is an easy-to-use drag-and-drop interface that enables network managers to set actions that can be triggered by alerts. The automation manager is also available to set up routine maintenance tasks on a schedule.

Who is it recommended for?
This is a package for managed service providers and so it competes directly with Atera and Kaseya VSA. If you only want to just implement SNMP monitoring, then N-able N-sight provides more than you need. All of the N-sight bundle is designed for use by large support teams, so it wouldn’t be as appealing for small MSPs as Atera. However, the starting price for N-sight is lower than that of Atera, so some small MSPs might decide to go for this package anyway.
During our testing, we identified the following pros and cons related to N-able N-sight.
Pros:
- Ticketing System: Enables users to raise a service request
- Technician Efficiency: Enables each technician to support 100 endpoints
- Task Automation: Set up automated response playbooks
Cons:
- Cloud Only: No on-premises option
N-able N-sight is a very cost-effective solution because it frees up IT professionals from mundane tasks and makes them available for more important work. The service costs nothing to implement because it is charged for by subscription and includes all supporting software and hardware. N-able N-sight is available on a 30-day free trial.
6. Paessler PRTG Network Monitor
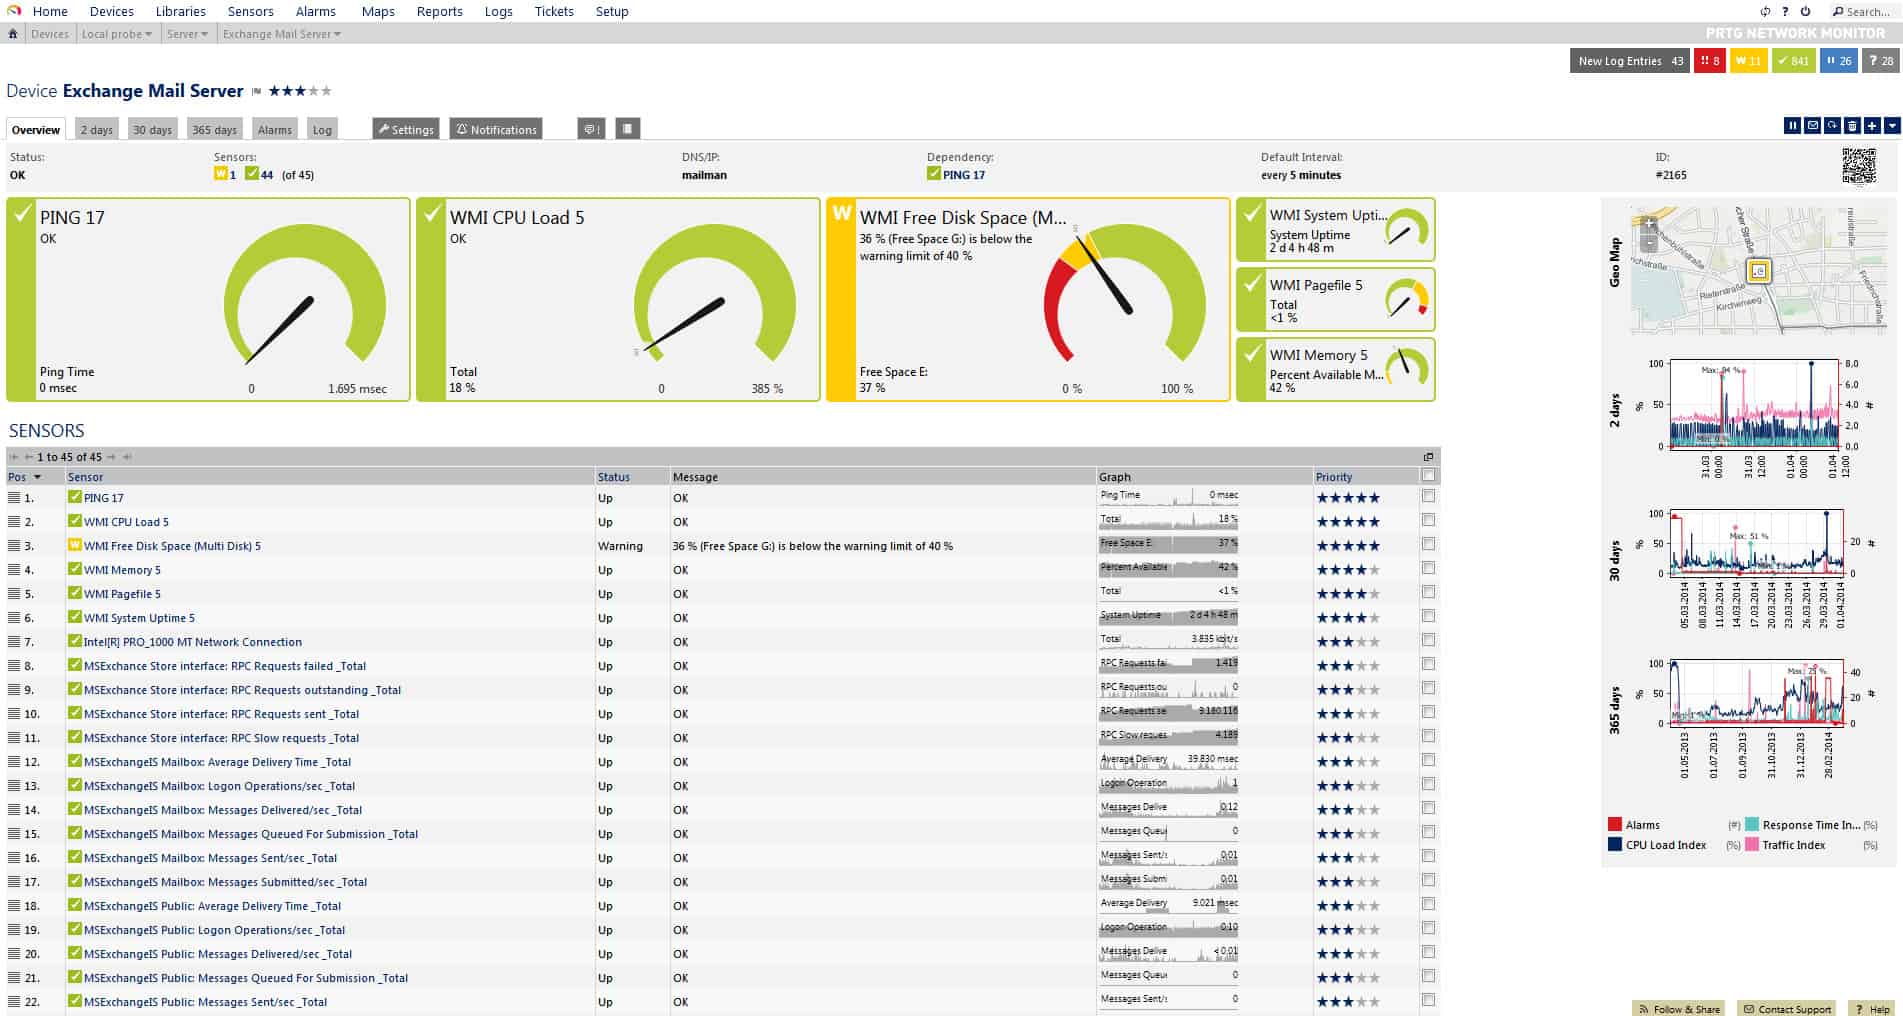
The PRTG system from Paessler includes three different network monitoring methods and SNMP is one of them. The other two are packet sniffing and NetFlow. Each of these three technologies provides a specific level of network information. The role of SNMP in the PRTG system is to provide an overview of network performance. NetFlow and packet sniffing are both engaged when analysis of network traffic is required.
When we tested Paessler PRTG Network Monitor we found the following key features.
Key Features:
- Flexible Package: The buyer decides which sensors to turn on
- Autodiscovery: Generates a hardware inventory and a network topology map
- SNMP Manager: Broadcasts an SNMP request and collects responses
Why do we recommend it?
Paessler PRTG is remarkable for its flexibility. SNMP scanning is central to the package because all of its other functions rely on the asset inventory assembly routine in the bundle. The service continuously scans devices with SNMP and updates the inventory. It also provides a range of network mapping views that extend to wireless network monitoring. Outside of those central functions – which cover just about all of the features that you get in the Datadog Network Device Monitor – you have hundreds of options over what else to monitor. The PRTG bundle is vast and you decide which other functions to add on and they extend to traffic tracking plus server and application monitoring.
The interpretation of SNMP messages is complicated by the fact that there are several different versions of the standard. The network management software you choose might not be compatible with the SNMP versions that firmware of your equipment uses. The PRTG Network Monitor can interpret all versions of SNMP. Paessler has also compiled interpretations of the custom OIDs that many network equipment manufacturers add to the standard MIB list. PRTG Network Monitor software can be installed on Linux, Windows, and macOS.
PRTG Network Monitor categorizes facility statuses as “sensors.” So, there is a CPU Load Sensor, a Disk Free Sensor, and so on. In all, PRTG incorporates more than 200 sensors, giving you the ability to keep track of network performance over a wide range of factors.

The manager software of PRTG can discover all available SNMP devices connected to the network. However, you might need to access each device individually and manually set up SNMP, because many devices are shipped with their SNMP capabilities switched off. Equipment firmware that includes firewalls also has to be adjusted to allow SNMP messaging through.
Who is it recommended for?
PRTG is a very competent automated monitoring package. It is considered to be one of the top three on-premises SNMP monitors. Like SolarWinds NPM, this tool installs on Windows Server. However, Paessler stole a march on SolarWinds by porting PRTG into a SaaS package option. The options over which sensors to turn on is a very appealing feature of PRTG because you don’t end up paying for features that you don’t need. The price for the service depends on how many sensors you want to use and if you only activate 100 of them, you never have to pay for the package.
During our testing, we identified the following pros and cons related to Paessler PRTG.
Pros:
- Alerts Management: See alerts in the dashboard
- Problem Notifications: Forward alerts as notifications by email, SMS, push notifications, Slack, or Teams
- Generate Log Messages: Send activity reports to SIEM tools
Cons:
- SaaS or Windows Server: You can’t host the software on Linux
The management console includes an SNMP tester, which enables you to get more precise details remotely on a reported alert condition arriving via a trap message. The dashboard of PRTG includes graphical elements, such as dials and graphs that give instant recognition to overall network performance. It is also possible to drill down and examine the status reports of each device, which can also be displayed as real-time graphs. Start with a 30-day free trial download.
7. Datadog Network Device Monitoring
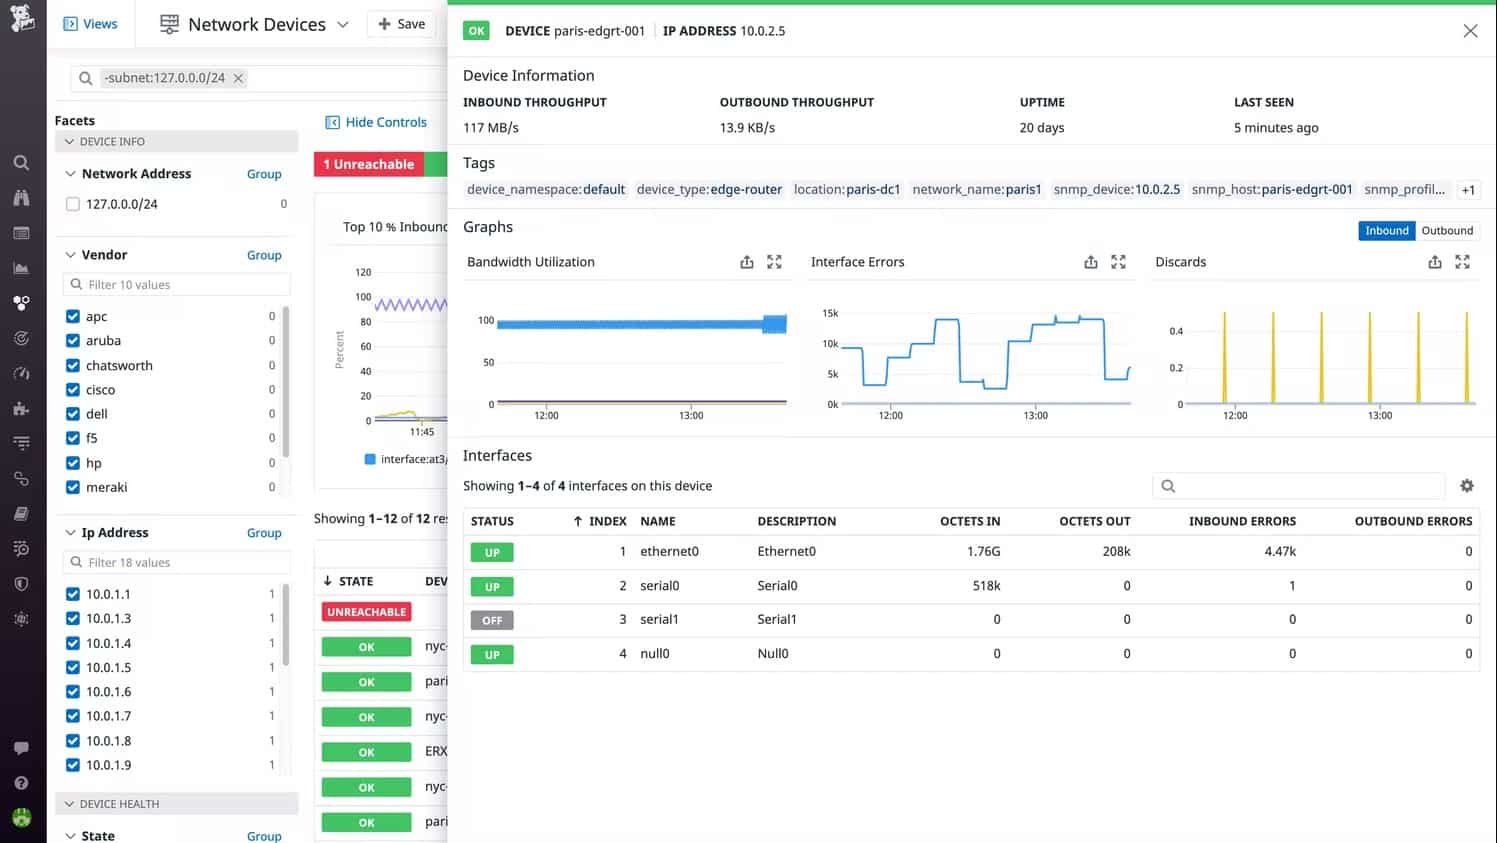
Datadog offers two network monitoring tools, one of these is the Network Device Monitoring system and the other is the Network Performance Monitoring. While the Network Performance Monitoring system looks at bandwidth usage, the Network Performance Monitoring module uses SNMP to extract traffic data from switches and routers along with device health reports.
When we tested Network Device Monitoring we found the following key features.
Key Features:
- Cloud-Based System: Installs a collector on each site
- Regular SNMP Polling: Acts as the SNMP manager
- Collects MIBs: Gather reports from SNMP device agents
- Uploads Data: Centralizes data analysis in the cloud
- Alerts for Device Problems: Processes SNMP traps into alerts
Why do we recommend it?
Datadog Network Device Monitoring provides the innovation of enabling a cloud-based system to install an agent on a server instead of a full network monitoring software packaging. The agent acts as the SNMP Manager, which sends out SNMP Requests and uploads SNMP Responses to the Datadog server for processing. This feature means that it is very easy to monitor devices on multiple networks in one account
Thanks to SNMP, the monitor is able to discover all of the devices on the network. This enables the tool to compile a network asset inventory, a list of all connected devices to your network. That list provides an index through to the report from each piece of equipment. The total list provides a quick overview of all assets, showing color-coded statuses.
The device polling by Datadog is repetitive. That means the system will spot whenever a device is added or removed from the network. Each scan of the network refreshes the asset inventory, so your view of all equipment is always up to date.
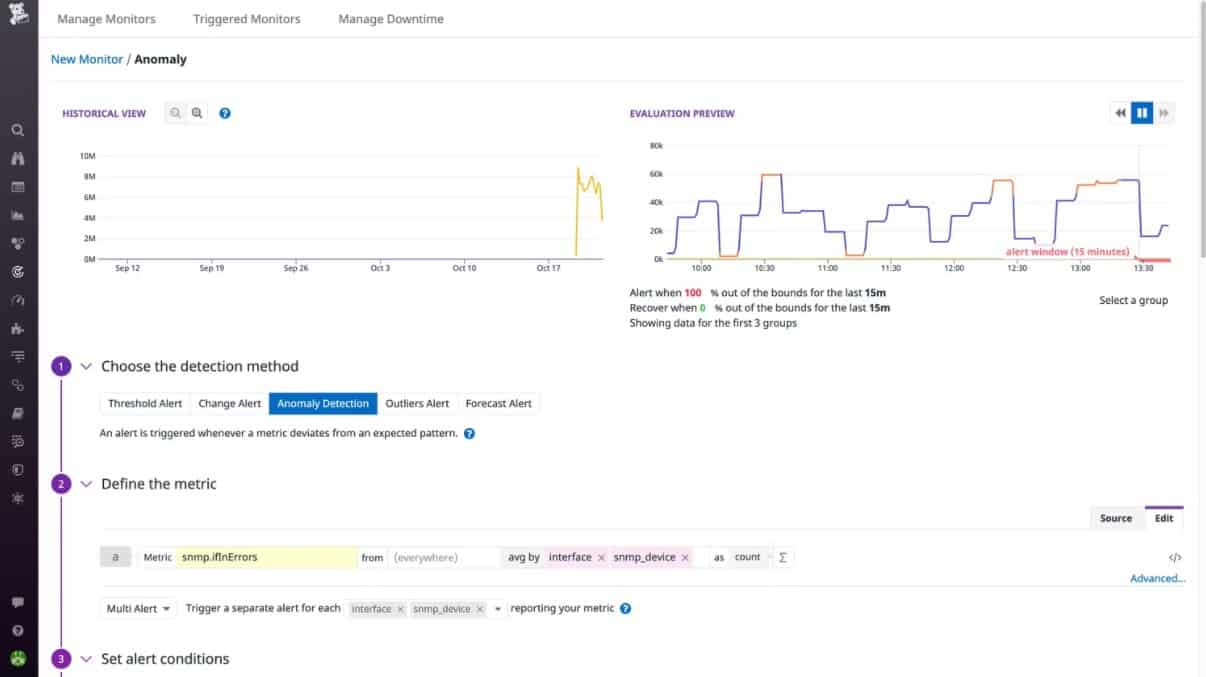
The monitor will process SNMP Trap messages from device agents into alerts on the screen. It is also possible to set up performance thresholds on any of the statistics that the monitor gathers. If one of those thresholds gets crossed, the system will generate an alert. Alerts from the Network Device Monitoring service can be forwarded to key staff as notifications by email or through Slack, PagerDuty, Jira, or Webhooks.
The alerting mechanism means that you can leave the Datadog system unattended and it will watch over performance. You will be brought back to the monitor if any problems arise.
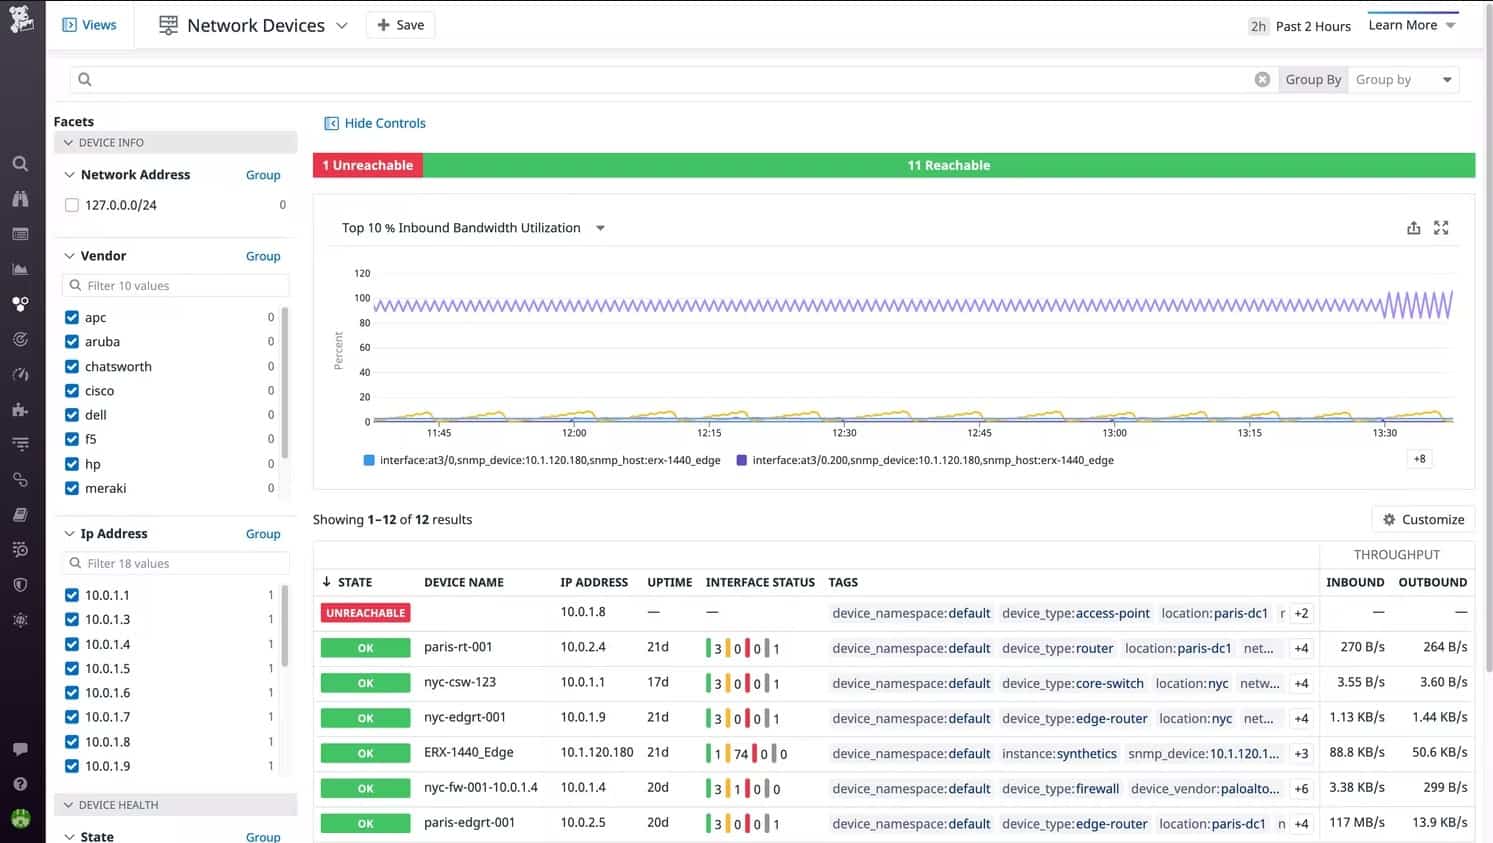
The ability to see the statuses of all of your network devices in one screen makes it very easy to spot performance problems and know exactly where they are. Datadog offers a menu of modules and while each will work individually, they provide enhanced system monitoring capabilities when combined. For example, using both the Network Performance Monitoring and Network Device Monitoring modules together gives you a complete view of network activity and performance.
Who is it recommended for?
This product is priced per host per month – “per host” means “per device.” That makes the system very accessible for businesses of all sizes. Larger companies have more hardware to monitor and so pay more and all subscribers get the same detail of service. The package’s ability to monitor any network anywhere through the guided installation of an agent program on each site makes Datadog Network Device Monitoring a good choice for highly distributed businesses.
During our testing, we identified the following pros and cons related to Network Device Monitoring.
Pros:
- Scalable Pricing: Subscription rate per device
- Add-on Option for Traffic Analysis: Get NetFlow Monitoring as well
- Alert Notifications: By email, Slack message, or SMS
- Dashboard Reports: The service interprets SNMP data into charts and data tables
- Web-Based Dashboard: Access the system console from anywhere through any standard Web browser
Cons:
- Requires the Installation of Datadog Infrastructure Monitoring: To enable autodiscovery
The Network Device Monitoring system is based in the cloud and reaches out to monitored networks through the installation of agents. It is possible to monitor any site anywhere with this tool and even cover multiple sites in the same account. You can get a look at the Network Device Monitor by accessing a 14-day free trial.
8. SolarWinds Network Performance Monitor
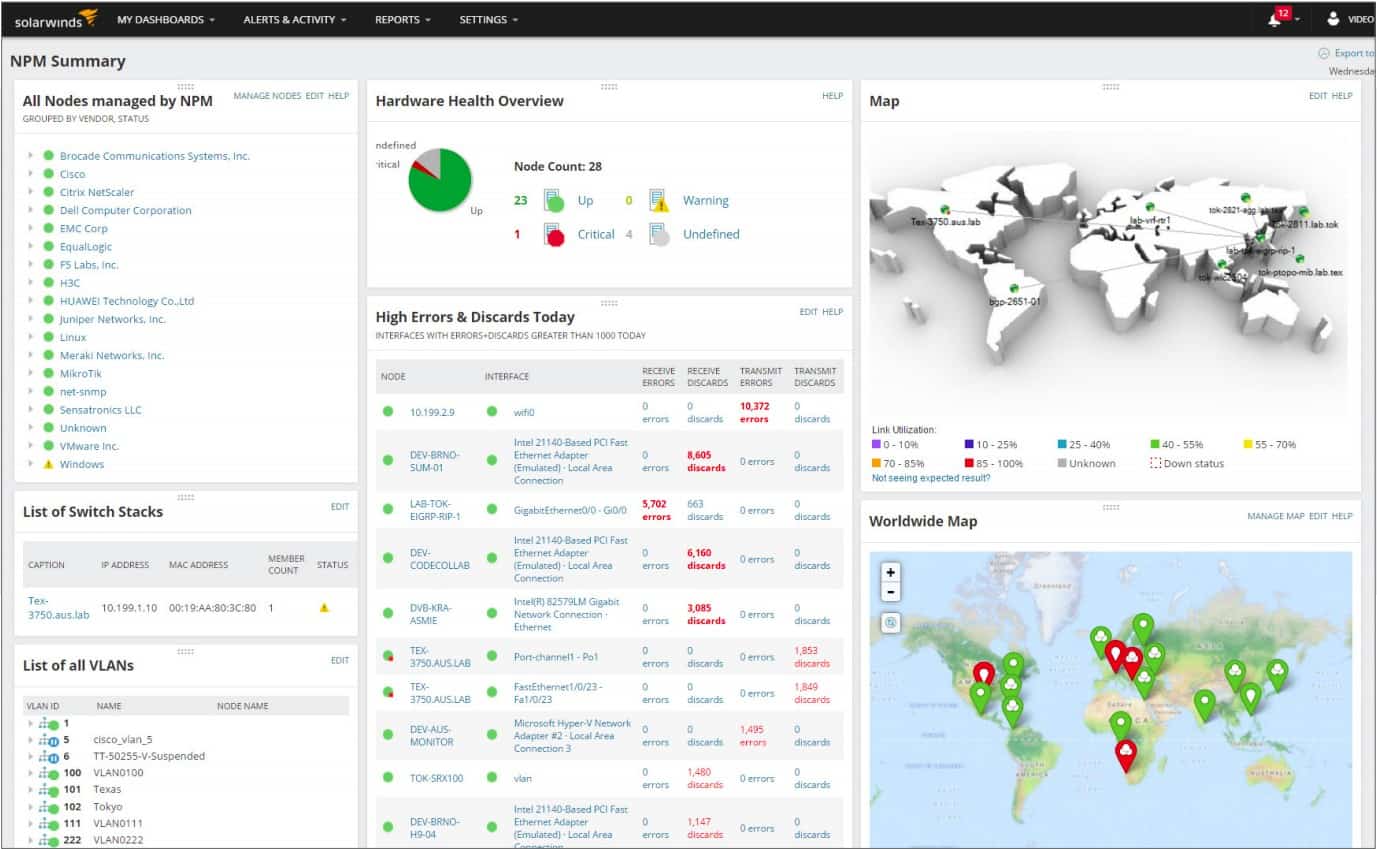
The SolarWinds Network Performance Monitor (NPM) is our second top pick SNMP management tool. The installation of this system is straightforward, thanks to a device discovery tool, which will locate, map, and configure all of the nodes on your network, installing agent software, or instructing existing, pre-loaded agents.
When we tested Network Performance Monitor we found the following key features.
Key Features:
- On-Premises Package: Runs on Windows Server
- Autodiscovery: Sets up the system with network device data
- Hardware inventory and Network Map: Device documentation automatically updates when the network changes
- Alerts for Device Problems: Interprets SNMP traps into alerts
Why do we recommend it?
SolarWinds Network Performance Monitor is a very comprehensive SNMP-based monitoring package that provides extra features, such as a visual map of the network and a constantly updated network inventory. The long history of SolarWinds Network Performance Monitor has given it a head start on its rivals and so it has more features that have been heavily tested through use.
The console of this network monitoring system tracks availability and load and keeps you updated when new devices are added or nodes get taken away. This is particularly useful for large networks that cover multiple sites, or workplaces that have a “Bring your own device” policy.
A graphical map shows you all of the topologies of your network and reports on link utilization through color-coding. You don’t have to set up this map yourself because the SolarWinds software compiles the data on your network and puts it on the map automatically.
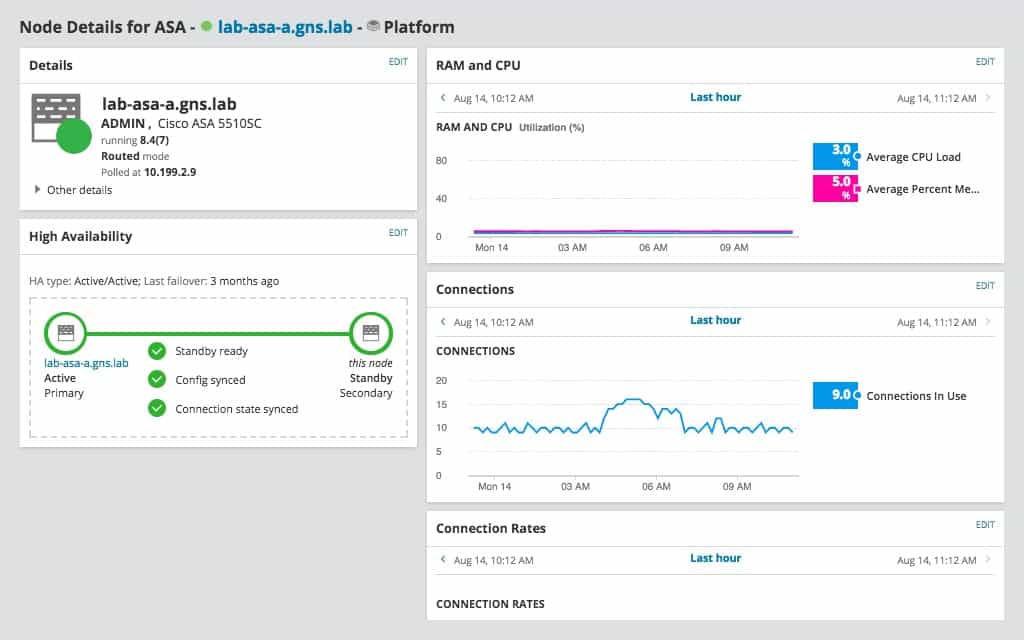
The SolarWinds console can zoom in on each detected device and show a detailed performance report. The Node Details screen of the console leverages graphical displays to make visual checks on the health of a device instantly.
A typical network includes SNMP-enabled devices sourced from several different manufacturers. SolarWinds is ideal for a multi-vendor network environment because it relies on the universal Simple Network Management Protocol to ensure interoperability.
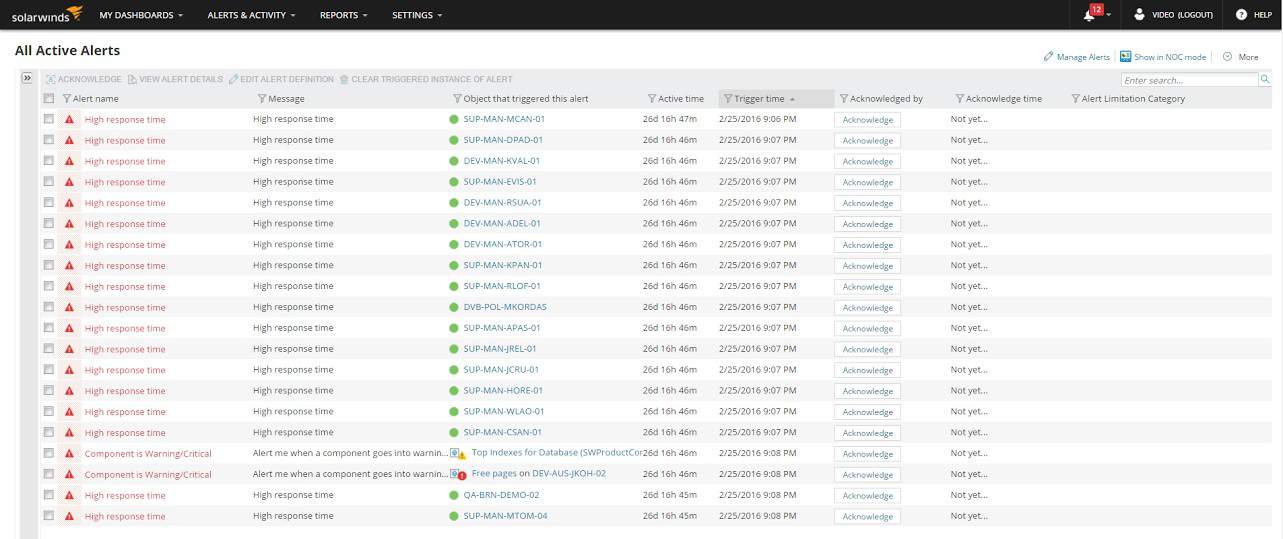
The location and ownership of network segments don’t matter to the Network Performance Monitor. This enables cloud services to be integrated into the network. The performance of links to those off-premises services can help the network manager decide where extra resources are needed to prevent bottlenecks.
Who is it recommended for?
SolarWinds Network Performance Monitor is an on-premises package and that delivery model is probably the system’s biggest demerit when pitching for customers in competition with Datadog. This is a very comprehensive package but its extensive features mean it serves a large team of technicians. It also requires a computer to host it and a team to maintain its software – all of which creates a need for more IT assets to monitor. The high price of the package is another factor that makes SolarWinds Network Performance Monitor more appealing to large organizations.
During our testing, we identified the following pros and cons related to Network Performance Monitor.
Pros:
- Established Tool: Thoroughly tested through use over the years
- Problem Notifications: Get alerts forwarded by SMS or email
- Troubleshooting Tools: Use path testing and Ping tools to check the network
- Monitor Internet Connections: Test links between sites and to cloud services
Cons:
- No SaaS Version: You need to buy a software license
The automation of setup and the ability to use the Network Performance Monitor to adjust the settings of devices means that the Network Manager can maintain multi-site networks from anywhere in the world. It is no longer necessary to employ a key network manager at every site of a network because all administration tasks can be centralized. SolarWinds offers a 30-day free trial.
9. SysAid Monitoring
SysAid produces a range of IT support utilities, and SysAid Monitoring is one of those. The SysAid Monitoring package is not a standalone product but is an optional extra for the Help Desk and IT service management software systems that the company produces.
When we tested SysAid Monitoring we found the following key features.
Key Features:
- Hardware Monitoring: Uses SNMP to monitor endpoints and network devices
- Network Performance: SNMP MIBs also provide network throughput information
- Performance Alerts: Traps appear in the dashboard as alerts
Why do we recommend it?
SysAid Monitoring has to be considered in conjunction with the core SysAid Service Desk system. This is a large package that includes all of the ITSM tools that support teams need. The bundle includes patch management, task automation, and remote control tools as well as system monitoring for hardware and software. The hardware monitoring service is based on SNMP, which provides network discovery and repeated hardware scanning for servers as well as network devices.
The system relies on SNMP and its Trap alerts that enable the monitoring system to spot problems before network users call them into the Help Desk. Ongoing monitoring examines resource utilization to assist network administrators with capacity planning.
You can choose to get notified of alert events either by email or SMS, which means that you can keep on top of system issues around the clock, even when you are out of the office. Although the system comes with a set of commands and utilities that help automate network management, you can also create your own custom scripts to get the precise functionality that helps your job as a network manager run smoothly.
The main panel of the consoles shows a table of performance metrics for the whole network with each record featuring data from one asset. Performance monitor graphs are instantly available as overlays on the main screen on demand for each asset.
The notifications for each device don’t just log hardware statuses, but you can see instantly if the software is altered on each monitored network device. This is a great way to keep on top of security breaches, such as virus attacks or Advanced Persistent Threat disabling of network activity reporting. Those network activity reports can also alert you to intrusion by displaying abnormal traffic on specific network cards.
SysAid also produces a Help Desk module and the Monitoring system integrates seamlessly with that. This enables you to get a data flow through into opening up response tickets. It also keeps the support team informed with answers in response to user calls about any problems that arise.
Who is it recommended for?
The SysAid package is suitable for use by IT departments supporting large enterprises. There is an MSP option for this cloud based system. However, that proposal involves opening up a new SysAid account for each client, which isn’t as satisfactory a solution as multi-tenant solutions, such as Atera. The system provides automated monitoring that provides alerts for issues raised by SNMP. This is a time-saver because technicians don’t need to watch the network, thanks to notifications that are sent out by email or SMS.
During our testing, we identified the following pros and cons related to SysAid Monitoring.
Pros:
- Response Automation: Channel alerts into your Service Desk system
- Notifications: Get the tool to forward alerts to technicians by email or SMS
- Patching: The SysAid package includes an automated patch manager
Cons:
- No Price List: Interested buyers have to contact SysAid to learn the price for the system
10. Kaseya Network Monitor
The Kaseya Network Monitor is part of a more extensive network and system remote monitoring package, called Kaseya VSA.
When we tested Kaseya Network Monitor, we found the following key features.
Key Features:
- Part of Kaseya VSA: Integrated into a remote monitoring and management package
- SNMP Technology: Turn on network monitoring in the VSA dashboard and the platform installs an SNMP manager on your site
- Alert Generation: SNMP traps become alerts in the VSA dashboard
Why do we recommend it?
The Kaseya Network Monitor is part of the Kaseya VSA package. This is a cloud-based system that provides technician tools for remote monitoring and managing multiple sites. The network monitoring service within the Kaseya VSA bundle is based on SNMP, so it provides network discovery as well as automated monitoring. The package is based in the cloud and also provides a ticketing system, which helps with support team management.
The Network Monitor Module includes a visualization of the topology of your network displayed on a world map. This is very similar to the network visualization feature built into SolarWinds Network Performance Monitor. The dashboard of the network manager includes other visualizations including charts, performance graphs, and other graphical interfaces.
Performance data featured in the monitor includes CPU utilization and which nodes originate and receive the most network traffic. Storage space utilization is another focus topic. SNMP Trap alerts are integrated into the Kaseya Network Monitor system.
Network elements that the Network Monitor has specific functions for include mail servers. The Monitor keeps tabs on the availability of mail servers and keeps track of their capacity and performance.
The standard install includes pre-set reports and a list of routines and commands to help automate processes. However, the system also integrates a scripting language, called Lua, which enables you to create your own custom automation programs. Lua scripts are easy to put together because the Kaseya Network Monitor environment includes an Integrated Development Environment to help you assemble them.
The patch status of all network devices is instantly available in a specialized panel of the dashboard. Installer and update programs can be distributed and implemented on remote network nodes from one central console.
The broader VSA system has a comprehensive patch management module and also monitors the status of network devices for malware. You can integrate cloud storage into your network through Kaseya VSA and manage the network remotely, accessing each node for manual troubleshooting.
Who is it recommended for?
Kaseya sees its products as suitable for mid-sized businesses. The VSA package is available in editions for IT apartments and managed service providers. The system is a cloud-based service, which makes it very easy to onboard. Each monitored site needs an agent program installed on it but the cloud-based Kaseya console manages that process. Kaseya is a highly respected package and it is a strong competitor to the Atera system.
During our testing, we identified the following pros and cons related to Kaseya Network Monitor.
Pros:
- Alert Processing: Generate a Help Desk ticket and send an email to a technician
- System Documentation: The tool gathers data about each device and creates a network topology map
- Accessible Data: The network map becomes an access point for system information
Cons:
- Online Only: No on-premises option
11. Atera

Atera integrates its network monitoring system into a complete MSP support package, which includes a Help Desk system. The complete system covers the usage and capacity of apps and infrastructure and generates invoices and reports from logs of staff activities.
When we tested Atera we found the following key features.
Key Features:
- Remote Monitoring and Management: The SNMP system is part of an RMM package
- For IT Departments and MSPs: Atera plans are available for in-house use or for managed service providers
- Help Desk Ticketing System: The Atera package includes a ticketing system for incident and request management
Why do we recommend it?
Atera was originally designed for use by managed service providers. Its producers soon realized that IT departments of large businesses essentially operate as service providers to other company departments and so their SaaS package could be equally appealing for those buyers. This product doesn’t need to be hosted and it includes constant automated device monitoring that relies on agents collecting SNMP Responses.
This option would be the right choice if your IT department operates as an income center or if your business provides fee-based support to other companies. The SNMP involvement in this package is concentrated on the network monitoring module. SNMP Traps provide a vital element of the monitoring system, providing real-time alerts in the Atera console.
The network manager dashboard includes scripts that automate routine administration tasks, and you can also create your own custom scripts to complete your regular tasks your way.
Atera allows you to reach out from the data center, and even leave it. The system includes remote access procedures and it is also possible to access the dashboard from a mobile device. The dashboard includes real-time performance graphs to speed decision-making. Alerts can be set to trigger notifications by email.
Configuration control and patch management are also centralized. Remote management utilities enable you to centralize IT support for multi-site, or even multi-customer scenarios. The closed-loop information flows between the network monitor and the Help Desk system keeps customer Support teams apprised of solution progress in real-time and enables online operators to match existing system alerts with incoming queries.
Atera offers a free trial that helps you get the feel of the system. There are also video walkthroughs available on the Atera website to show you how to use the package effectively.
Who is it recommended for?
Atera’s main market is still the managed services provider sector, mainly because the extras available in the MSP package give an MSP all of the facilities needed to run the business as well as technician tools and automated monitoring services. The SaaS package pricing model is per technician, which makes this system very accessible to small MSPs and independent contracting technicians. As a cloud-based system, the Atera package competes with Datadog Network Device Monitoring as far as SNMP monitoring is concerned. However, there is much more offered in this package which justifies its price, which is considerably higher than the Datadog unit. MSPs of all sizes would find the Atera package very attractive.
During our testing, we identified the following pros and cons related to Atera.
Pros:
- SNMP Trap Management: SNMP traps get interpreted into alerts
- Problem Management Automation: Alerts get channeled into the ticketing system for action
- Scalable Pricing: Plans are priced per technician
Cons:
- Network Discovery is an Extra: You have to pay for an add-on to get network discovery
SNMP Monitoring Tools FAQs
What is SNMP switch monitoring?
SNMP agent software is pre-loaded on all switches that are sold in the USA today. The agent checks many statuses on the switch and prepares a set of answers to send back when it receives a request from the SNMP manager. SNMP switch monitoring also allows for the agent to send an alert without waiting for a status request.
What can you monitor with SNMP?
SNMP will track the statuses of network devices and that includes both physical properties and operating performance. Those devices also include network servers. So, you can monitor both network traffic flows and the health of equipment with SNMP.
What is SNMP MIB?
SNMP MIB stands for Management Information Base. This is the format of communication between the SNMP manager and all of the SNMP device agents on the network. The MIB takes a tree format with nodes on that tree indicated by a numeric labeling system that indicates the position in the tree of each piece of information contained in the MIB. Not all fields need to have values for every information exchange.
Is SNMP UDP or TCP?
SNMP operates on UDP. It is assigned UDP port 161.
What is the difference between MIB and OID?
The MIB (Management Information Base) is the format of communication between the SNMP manager and all of the SNMP device agents. The OID is the numbering system that identifies each piece of information. The OID is both a code system that acts as a label for each field and it is structured to identify the field’s position in the hierarchy of data in the MIB.
What kind of protocol is SNMP?
The protocol is application–layer and is defined by the Internet Architecture Board (IAB) in RFC1157.
Further reading
There is much to discover about network management. Here is a list of some great resources on the topic that are available on the web.
Comparitech Guides
- Best free bandwidth monitoring software and tools to analyze network traffic usage
- The best free network vulnerability scanners and how to use them
- Packet sniffers and network analyzers
SNMP RFCs
- RFC 1157 – A Simple Network Management Protocol (SNMP)
- RFC 1901 – Introduction to Community-based SNMPv2
- RFC 3410 – Introduction and Applicability Statements for Internet Standard Management Framework
- RFC 1213 – Management Information Base for Network Management of TCP/IP-based internets: MIB-II
- RFC 2570 – Introduction to Version 3 of the Internet-standard Network Management Framework
- RFC 2574 – User-based Security Model (USM) for version 3 of the Simple Network Management Protocol (SNMPv3)








Zabbix.
Open-source.
Many templates for SNMP devices already available.
Can create your own ones.
Should be on the list.