Redis is a high-performance, open-source, in-memory data store that is widely used for caching, session management, real-time analytics, and message brokering. Its speed and versatility make it a go-to choice for applications requiring low-latency data access and high-throughput capabilities. However, as Redis is often used in production environments where high availability and scalability are crucial, monitoring its performance is essential to ensure smooth operations.
Here is our list of the best Redis monitoring tools:
- ManageEngine Applications Manager EDITOR’S CHOICE An on-premises package that examines the Redis database, its host, and the applications that connect to it. It is available for Windows Server and Linux. Download a 30-day free trial.
- Site24x7 Infrastructure (FREE TRIAL) A flexible cloud-based monitoring package that will give you views on server resource usage and Redis monitoring from a special integration. Access a 30-day free trial.
- Sematext Redis Monitoring This service watches over Redis and other database types, while also tracking the performance of other applications, plus networks and servers. Available as a SaaS package or a virtual appliance.
- SolarWinds Database Performance Monitor A focused cloud-based system for monitoring a range of database management systems, including Redis.
- AppOptics This monitoring system offers a great combination of detailed server status monitoring plus a specialist integration for Redis.
- Datadog A cloud-based monitoring platform that includes an extension for monitoring Redis databases.
Effective Redis monitoring focuses on several key metrics that reflect the health and performance of the system. One of the most critical aspects to monitor is memory usage. Redis is an in-memory data store, which means that it relies heavily on memory for storing data.
Tracking memory consumption helps ensure that Redis does not run out of memory, which can lead to crashes or degraded performance. Administrators should monitor memory utilization in relation to the maximum memory limit set in Redis and ensure that the system is not exceeding these limits.
Another important factor to monitor is latency. Redis is valued for its low-latency performance, so keeping an eye on how quickly commands are being processed is key to maintaining fast response times. Monitoring the time taken to execute commands, especially for complex or high-volume operations, can help identify potential performance bottlenecks.
Cache hit-and-miss rates are also crucial. Redis is often used as a caching layer, and high cache hit rates are a good indicator that Redis is being used effectively. A high miss rate, on the other hand, could suggest issues such as inefficient caching strategies or underutilized resources.
Additionally, monitoring replication and persistence is essential, especially in environments with high availability requirements. Ensuring that Redis replicas are synchronized and that persistence mechanisms like AOF (Append-Only File) or RDB (Redis Database) snapshots are functioning correctly is key to avoiding data loss.
By focusing on these important factors – memory usage, latency, cache hit/miss rates, and replication/persistence – organizations can maintain optimal Redis performance and ensure their systems remain stable, scalable, and responsive.
Requirements for a Redis monitoring tool
We have already identified some fundamental requirements for a Redis monitoring tool
- Memory monitoring
- Process monitoring
- Disk monitoring
- On-premises and cloud monitoring capabilities
As it is very possible that you might end up managing Redis instances both on your server and on a cloud platform, it would be nice to have a Redis monitoring tool that can supervise both of these environments and unify monitoring in one screen to reduce the need for switching between live monitoring dashboard pages.
Another great enhancement to aid your Redis management strategy would be a monitor that could identify those services and applications that use Redis databases and watch their interactions. By this method, together with server resource monitoring, you get monitoring services above and below your Redis implementations.
Add a requirement for a monitoring tool that can look inside the system and identify the efficiency of operations, and you will have a complete Redis monitoring tool.
Efficient Redis monitoring
There are a number of ways that the wrong monitoring tool can cost you time, effort, and money. The biggest is if it is only able to perform monitoring for Redis. Although Redis is becoming increasingly important, it is never going to become the pivotal application for your organization. You have plenty of other applications to worry about – including other database management systems.
You don’t want to get a standalone Redis monitoring system because then you will have to waste time switching to a different console every time you want to check everything is OK. If you end up with a Redis monitor that charges per seat, then you will probably only authorize one user account to access the console. That makes tracking access to the account harder and will end up reducing the strength of your security monitoring strategy by making it impossible to identify which technician was on the Redis monitor and when.
This means that your best option for a Redis monitor is one that is integrated into other monitoring services and gives you a range of functions, allowing you to supervise many different resources and applications from one location.
A Redis monitor that has an integrated alerting system would be a great time saver. Systems that institute performance thresholds really reduce your operating expenses. These tools watch over the Redis database unsupervised. Such a monitor usually also issues an alert if performance fails a test. It should be possible to set up the system so that it forwards those alerts to a member of staff by email or SMS.
Alerting systems effectively automate your Redis monitoring tasks because you can put staff onto other tasks, knowing that someone will be called back to the monitor’s dashboard if a problem is detected. It is smart to set those alert thresholds low enough so that they buy you time to fix problems but high enough so that you aren’t pestered by notifications all the time. Some monitoring services even work out the ideal level for performance thresholds through AI-based machine learning – that’s a great time saver.
The Best Redis Monitoring Tools
There are many Redis monitoring tools available at the moment and investigating all of them will take up a lot of your time. Fortunately, this guide will cut down your candidate selection time by narrowing down your search to those monitoring tools that we have identified as the best.
Our methodology for selecting a Redis monitoring system
We reviewed the market for Redis monitoring tools and analyzed the options based on the following criteria:
- NoSQL activity tracking capabilities
- Identification of supporting resources
- Correlation between data access events and resource usage
- Identification of orphaned processes
- Resource lock identification
- A free trial or a demo system that offers an opportunity for assessment before paying
- Value for money that is provided by an effective monitoring system offered at a fair price
Using this set of criteria, we looked for Redis monitoring tools that give an efficient and comprehensive tracking service for the complicated field of NoSQL.
You can read more about each of these options in the following sections.
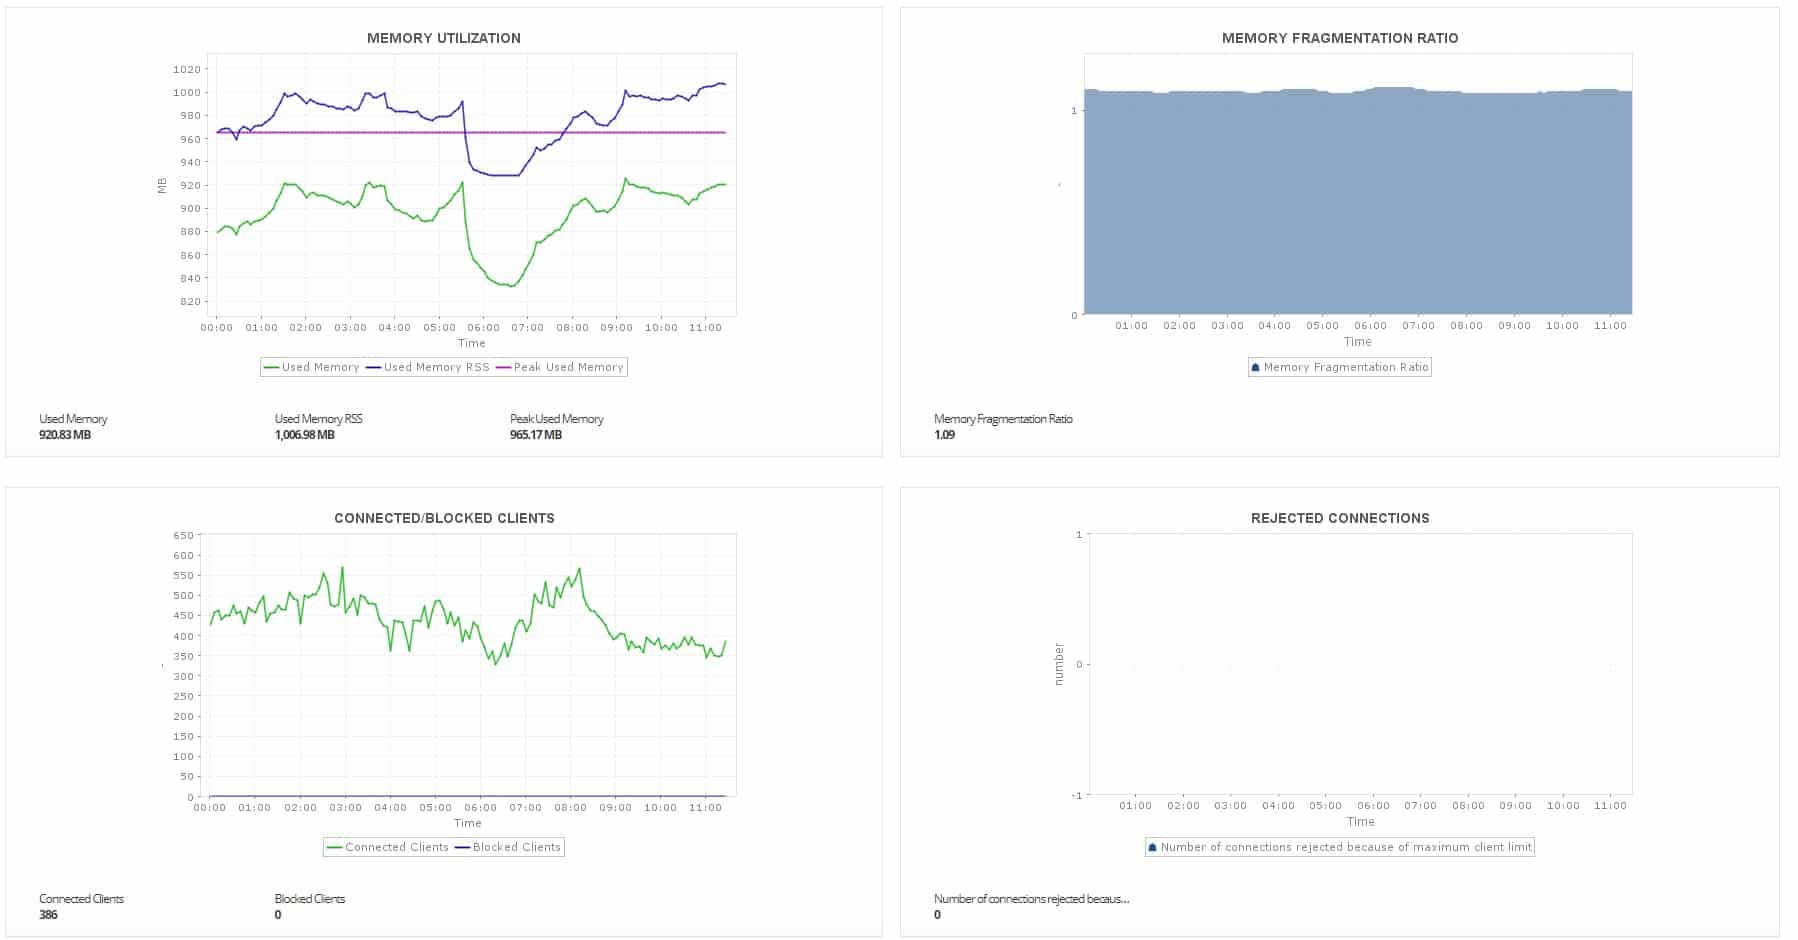
1. ManageEngine Applications Manager (FREE TRIAL)
ManageEngine Applications Manager gives you a very wide view of how your Redis databases fit into your entire system. The service tracks all applications and all server resources and it creates a map that shows how everything fits together. The automatic application dependency map is constantly updated and it shows all of the systems that access your Redis databases and all of the resources that the database relies on.
Key Features:
- Performance Alerts: Can be forwarded as notifications by Slack, SMS, or PagerDuty
- Notify a Technical Support Team: Automatically converts alerts into tickets in ManageEngine ServiceDesk Plus
- Server Resource Monitoring: Ensures that sufficient memory and CPU are available for running Redis processes
- Monitors multiple databases simultaneously: CAn be from different DBMSs
- Predicts demand: Calculates the requirements of applications that rely on the Redis database
Why do we recommend it?
ManageEngine Applications Manager is a package that provides monitoring for applications, services, and servers. The tool discovers all of your applications and creates an application dependency map. It is able to monitor Redis databases, so you will get performance reports for your database in the context of its related services.
The Applications Manager tracks a range of memory statuses as part of its Redis monitoring service. It looks at specific Redis-driven memory events as well as system-wide memory statuses. The monitor also looks at network interactions by the Redis database. This is a very relevant factor with Redis because it is a clear indicator of successful interaction with client applications.
Dataset persistence is a matter of interacting with the storage file that backs up the database and reloads it into memory after a system crash. Applications Manager checks on persistence factors and also checks on the health of the storage file.
Applications Manager, with its performance thresholds and alerts, is a very suitable complete system monitor for teams that are stretched and expected to multi-task. Alerts can be sent out as notifications by email or SMS. The prepared application dependency map is there to speed up root cause analysis.
Who is it recommended for?
This package is tempting for businesses of all sizes. There is a Free edition, but it is limited to tracking five assets. However,r it will monitor a Redis database. The Professional edition’s base price is accessible and suitable for small businesses. Pay a higher price for more monitoring capacity.
Pros:
- On-Premise and Cloud Deployment Options: Delivered as a software package in all cases
- Application Discovery: Creates a dependency map
- Log Monitoring for Redis: Captures metrics such as memory usage, disk IO, and cache status
- Hybrid system monitoring: Track the performance of services on premises and on different cloud platforms
- Customizable screens: Adapt screens in the dashboard, decide which statistics to show and how they should be represented
Cons:
- No SaaS Option: Install the software on your Windows server or Linux host or on your AWS or Azure account
The software for Applications Manager installs on Windows Server or Linux. It is available in three editions: Free, Professional, and Enterprise. The Free edition will only run five monitors. The Professional version can monitor one site and the Enterprise edition is designed for large, multi-site businesses. You can try Applications Manager on a 30-day free trial.
EDITOR'S CHOICE
ManageEngine Applications Manager is our top pick for a Redis monitoring tool because this system can monitor Redis wherever it is hosted and that includes the Redis-based Amazon ElastiCache. This package discovers all applications and works out how they work together, deducing which applications access the Redis database and which services that database relies upon. This creates a logical supply chain, leading to a map of how all of the systems in your service delivery fit together. The tool also looks inside your Redis database instances and records its activities, such as query throughput, data volumes, and delivery times. The package looks above and beneath the database at the same time, which provides instant root cause analysis when the applications that users access slow down or become unavailable. The benefit of these insights is that Applications Manager can make short-term predictions, spotting when databases are about to become overwhelmed. The package will also predict when server resources are about to run out and ripple through problems to all other parts of your system.
Download: Get a 30-day free trial
Official Site: https://www.manageengine.com/products/applications_manager/download.html
OS: Windows Server, Linux, AWS, and Azure
2. Site24x7 Infrastructure (FREE TRIAL)
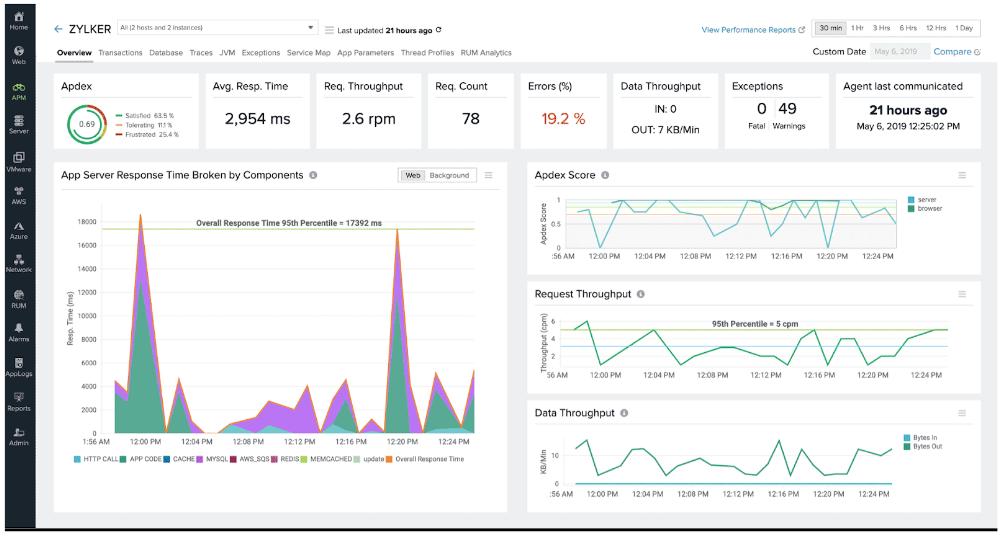
Site24x7 is a cloud-based monitoring platform that offers network, server, application, and website monitoring in a range of packages. The Site24x7 Infrastructure plan monitors networks, servers, and services and it can be expanded by a special plugin to monitor Redis.
Key Features:
- Full Stack Observability Plans: Includes modules to track networks, services, servers, applications, web applications, and cloud platforms
- Expandable by a Plug-In Library: An integration is available for Redis monitoring
- Cloud-Based
- Hybrid Systems: Monitors on-premises and cloud instances
Why do we recommend it?
Site24x7 Infrastructure is a package of tools that covers networks, servers, services, and applications. It will also give you log management and cloud platform and website monitoring tools. This is a cloud-based package and it can be expanded by specialized integrations and there is one for Redis monitoring.
The standard bundle for Site24x7 Infrastructure includes a credit to monitor up to ten servers. As it is based in the cloud, there is no specification on where those servers should be. The allowance of one plugin on the plan is per server. You don’t necessarily have to use the same plugin for each server. So, if you have Redis running on one of your Linux servers on your site you can just use the plugin allowance for that server for Redis monitoring.
Site24x7 Infrastructure is able to monitor cloud platforms, including AWS and Azure. There is a plugin to monitor AWS Elasticache, which is the Amazon implementation of Redis. There is also a plugin for Azure Redis Cache.
The standard server monitoring feature in Site24x7 gives you the ability to monitor CPU, memory, and disk activity on your Redis host. The Redis monitor delivers the following live statistics:
- Used memory
- Peak used memory
- Used system CPU
- Used user CPU
- Used user children CPU
- Keyspace hits
- Keyspace misses
- Total connections
- Rejected connections
- Connected clients
- Connected slaves
Who is it recommended for?
The Redis monitoring service will track Redis database performance on any platform. The service is affordably sized for small businesses and capacity expansions are available for larger businesses for a fee. The full infrastructure plan lets you see the exact reasons for Redis database performance issues.
Pros:
- Live Performance Metrics for Redis: Tracks memory, CPU, connections, and keyspace activity
- Alerts for Performance Issues or Resource Shortages: Links the activities of multiple systems in the service stack
- Supports Root Cause Analysis: Enhanced by AI
Cons:
- Be Careful About the Price: Headline subscription rates are for minimum capacity and most companies have to pay more for extra capacity
The Site24x7 system places performance thresholds on all measured statistics and the alerts that these triggers create can be forwarded as notifications by email or SMS. Site24x7 Infrastructure is available on a 30-day free trial.
3. Sematext Redis Monitoring

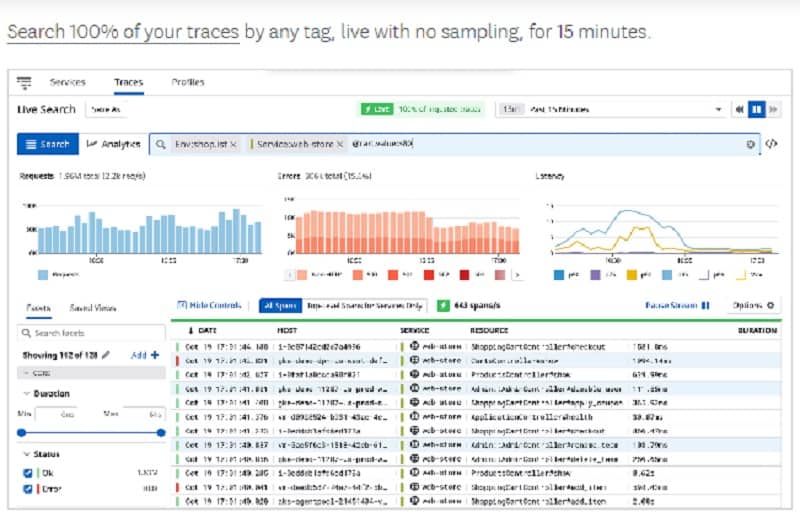
Sematext Redis Monitoring is part of Sematext Infrastructure Monitoring, which provides full-stack observability, covering networks, servers, and applications. By simultaneously monitoring all elements of infrastructure, the Sematext service can identify the exact cause of performance problems when they arise. So, if your Redis implementation is at fault, you will know straight away.
Key Features:
- Redis Performance Monitoring: Searches log data for source data
- Related Application Tracking: Links issues arising in dependent systems
- Infrastructure Monitoring: Measures server resource available
Why do we recommend it?
Sematext Redis Monitoring is a free add-on to the cloud-based Infrastructure Monitoring plan. The package simultaneously tracks the performance of all your other IT assets and that lets you see whether a delivery problem is caused by your Redis databases or is rooted in a problem elsewhere.
Redis is notable for operating all of its activities within memory. So, the availability of memory is vital when keeping an eye on the availability of the database system. Redis needs space to hold data in cache and also RAM to assemble and retrieve pertinent data. So, Sematext will raise an alert if it senses that Redis is running out of space.
Disk capacity is not as important while a Redis instance is live. However, you need to be sure that there is enough storage space available for Redis to write the database to disk when it powers down. Sematext will watch over disk space as well. There are many implementations of Redis hosted on cloud platforms and the Sematext system can track the availability of resources on AWS, GCP, and Azure. It is also able to monitor on-premises systems and check on connectivity issues on your network and across the internet.
You don’t have to watch the Sematext console all the time because the service will send you a notification by email, Slack message, or Webhooks if a performance issue arises. You get live statistics on Redis and its related applications and services in the console. Sematext will also store metrics for historical analysis – retention time is one of the key elements that decide the price that you pay for the service.
Who is it recommended for?
The Sematext tool is appealing to small businesses because it is available in a free edition. This plan will cover five hosts and there is no charge for the extras that you add on with integrations. The tool is hosted so you can get your system monitor for no cost.
Pros:
- Memory Monitoring: A key resource for Redis databases
- Simultaneously Monitors Multiple Applications: Includes monitoring services to track the performance of other database types
- Connectivity and Availability Monitoring: Alerts for performance problems or resource shortages
Cons:
- Be Careful with the Retention Period that you Choose: This influences the price of the monitoring package
The ability of Sematext to track all applications running on all of your platforms means that it is able to check on services that will compete with Redis for resources. This is useful for predicting whether memory is going to run out. Sometimes with Redis, the cause of its performance issues is due to server strain from unrelated applications.
Sematext Infrastructure Monitoring is a SaaS package but you can opt to download the software and host it yourself as a virtual appliance over Docker. The lowest edition is called Basic and it is free to use. The data retention period of your plan is the biggest influence on the price you pay – the free edition only holds data for 30 minutes. You can get a 14-day free trial of an unlimited plan.
4. SolarWinds Database Performance Monitor
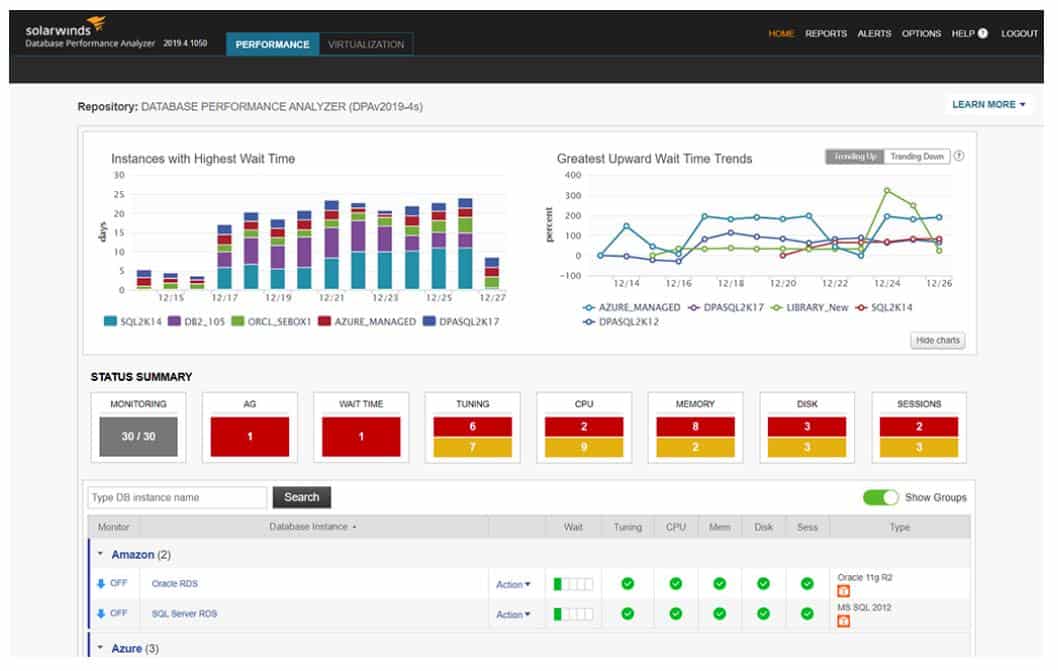
SolarWinds Database Performance Monitor is a SaaS system that can supervise Redis instances as well as other database management systems. This system isn’t limited to monitoring instances on your in-house servers, it can also monitor instances on cloud platforms.
Key Features:
- SaaS Package: Managed by SolarWinds
- Redis Monitoring Plug-In: Adds a special screen to the dashboard
- Monitors Many Other Database Types: MySQL, PostgreSQL, MongoDB, Amazon Aurora, and SQL Server
- Encryption Protection for Data: SOC 2 compliant
Why do we recommend it?
SolarWinds Database Performance Monitor is unusual among SolarWinds products because it is delivered from the cloud, while most of the SolarWinds fleet of services are built for hosting on Windows Server. This is a specialized tool for database management and isn’t limited to Redis monitoring.
This tool includes remarkable data visualizations for all of the performance statistics that it gathers. The system is adaptable. You add on a plugin from a library to give the system the capabilities of monitoring a specific type of database. There is a plugin for Redis, so your first task on opening an account with the SolarWinds Database Performance Monitor is to activate the Redis plugin.
The statistics that the monitor will collect and display include factors related to memory, CPU activity, disk usage, performance, and persistence. Within the database, it is able to analyze the most frequently executed data fetches and how they perform. It can show the most memory-intensive queries to aid performance tuning.
As the SolarWinds processing system is located in the cloud, data needs to be collected by an agent on the host of your Redis database. Collected data is then transferred to the SolarWinds server over an encrypted connection. Data stored on the SolarWinds is also encrypted.
Who is it recommended for?
This package is able to monitor other DBMSs, not just Redis and you can use it for many databases of different DBMSs simultaneously. However, it doesn’t monitor other applications. So, you are getting focused database monitoring and management functions, although it does examine supporting server resources.
Pros:
- Redis DB Management System: Tailored for medium to large-sized database implementations
- Performance Alerts: Can be sent as notifications by email, PagerDuty, Microsoft Teams, Slack, and other collaboration systems
- Alert Thresholds: Set at levels that allow the DBA to fix issues before they impact performance
Cons:
- Could Benefit from a Longer Trial Period: The free trial only lasts 14 days
It has the availability to monitor MySQL Azure SQL Server, MongoDB, PostgreSQL, and Amazon Aurora. This is a subscription service and it is available in two plans: Standard and Premium. The difference between these two plans is that the Premium plan has a longer retention period and includes more finely-tuned access accounts to the monitoring system. You can get SolarWinds Database Performance Monitor on a 14-day free trial.
5. AppOptics
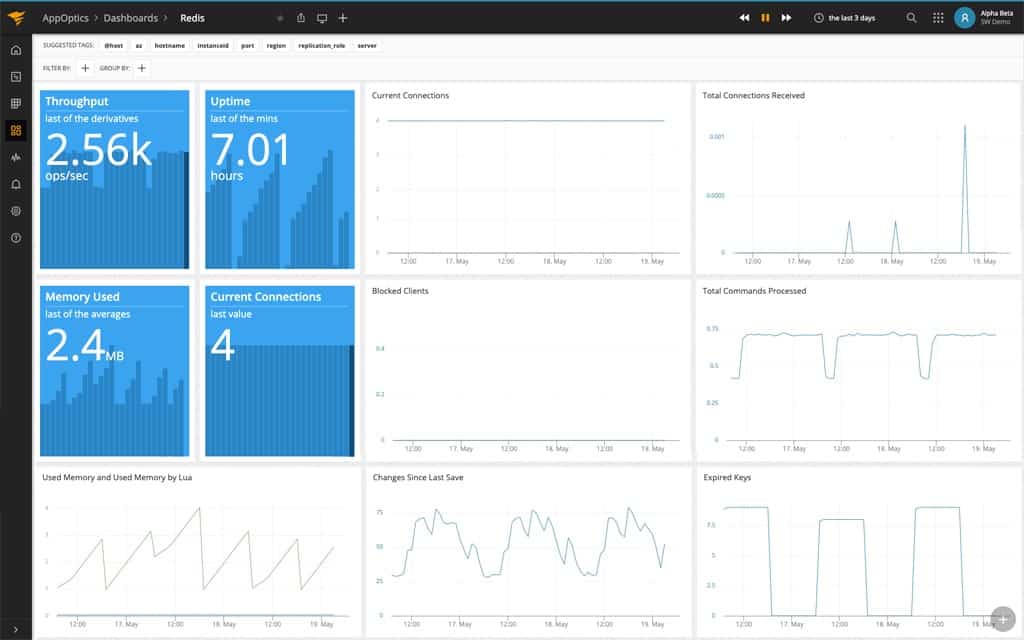
AppOptics is a cloud-based service that is able to monitor Redis implementations on your premises and also on cloud platforms. AppOptics can be extended by a library of free integrations. There is an integration available for Redis monitoring.
Key Features:
- Redis Performance Metrics: Also monitors other database types
- Single Screen for All Important Data: Well laid-out console
- Demand Measurements: Provides a list of statistics to choose from
- Error Alerts: Warn of resource shortages or performance dips
- Response Analysis: Identifies capacity issues as well
Why do we recommend it?
AppOptics is a cloud based system monitoring platform that offers two levels of service. The lower of these is an Infrastructure Monitoring service that includes Redis monitoring. The Higher plan is an APM plus Infrastructure Monitoring. In this context, the applications covered by the APM and not the Infrastructure Monitoring service are Web applications.
The dashboard for AppOptics shows all of the key metrics you need for Redis monitoring all on one page. The system metrics are mostly shown as time-series graphs. The most recent reports on four key statistics are shown at the top left of the screen and they really stand out. These are:
- Throughput in KB per second
- Uptime in hours
- The latest average memory usage
- Current connections count
The graphs shown in the screen convey the following statistics over time:
- Current connections
- Total connections received
- Blocked clients
- Total commands processed
- Used memory
- Changes since last save
- Expired keys
Any of those graphs can be expanded. It is also possible to create your own custom screens by selecting elements to group together.
What makes AppOptics a particularly powerful monitoring system for Redis is that it also has a comprehensive battery of server resource monitoring modules. These include the tracking of those important server resources that keep Redis running, such as CPU utilization, memory usage and availability, disk operations, and disk capacity.
This Redis monitoring tool isn’t limited to monitoring on-premises implementations. It can also monitor AWS Elasticache and also Azure services. In all locations, monitoring services include performance thresholds and alerts. The system presents an infrastructure overview that highlights potential problems. Drill down on that highlighted area to get greater detail of exactly which element is in difficulty.
Who is it recommended for?
The AppOptics Infrastructure Monitoring service is very affordable and it doesn’t incur the cost of server space to host it. The system can be extended by moving up to the APM plan, which will show you the source of demand on your databases from Web applications.
Pros:
- Supports a Wide Variety of Integrations: Redis monitoring is in the integrations library
- Offers Great Visualizations: Display live and historical health metrics and resource consumption
- Is an Easily Scalable Cloud Service: Sold in packs to monitor 10 hosts or 100 containers
Cons:
- Can’t be Hosted on Premises: Only available as a SaaS platform
The AppOptics system is available in two editions. The Infrastructure Monitoring tool includes all of the utilities you need to monitor Redis and your server resources and also cloud platforms. The second plan is Infrastructure and Application Monitoring. As the name implies, this adds on application performance tracking, which lets you see which applications interact with your Redis instances.
AppOptics is a subscription service and you can get it on a 30-day free trial.
6. Datadog Infrastructure
Datadog Infrastructure is one of the plans offered by the Datadog monitoring platform. This system is delivered from the cloud. The plan is intended to supervise all of the services that support user-facing software, whether they are office software systems delivered over the network or Web services and websites made available over the internet.
Key Features:
- SaaS Package: Can be extended by a library of integrations
- Integration for Redis Monitoring: Also supporting resources
- Monitors Multiple Redis Instances Simultaneously: Also correlates with the performance of related applications and services
Why do we recommend it?
Datadog Infrastructure is a module on the Datadog cloud platform. This package will monitor all of the services that lie between user-facing software and your servers or cloud platforms – it includes server resource monitoring. The tool can be expanded by interactions and there is one for Redis monitoring.
The most important feature of Datadog Infrastructure is its library of integrations. If Datadog loaded all of its capabilities into the Infrastructure package out-of-the-box, the dashboard would be immense. There are more than 500 integrations available.
By activating the Redis integration, you will add extra screens to the dashboard and the system sends out probes to the hosts of your Redis instances. As well as a Redis plugin, you will find an integration for AWS ElastiCache and Azure Redis Cache. So, you can monitor Redis databases on the cloud as well.
Datadog is able to collect a large number of different statistics that illuminate database performance. These include four memory-related metrics, four activity statistics, two persistence indicators, and three error-related statistics. You can decide which of these factors are displayed in the dashboard – you don’t have to watch all of them.
You can customize the screens in the Datadog dashboard, which will also examine the interaction between the Redis database and server resources. It will track host resource availability for all of the processes on the same server, so you can see whether resources are running out and which applications to kill or move in order to make space.
Who is it recommended for?
You would get the most out of the Infrastructure plan if you add on linked monitoring packages, such as Network Performance Monitoring and Network Device Monitoring because that will let you see whether your user-reported problems are caused by your Redis database or some other element of your delivery system.
Pros:
- Highly Customizable Dashboards: Choose the source and format for each metric that you would like to see
- Cloud Hosted: Access the dashboard through any standard Web browser
- Other Options: 400+ integrations
Cons:
- No On-Premises Version: Only available as a SaaS platform
You will get an alert when performance drops or resources reach a point of exhaustion. The highest plan of Datadog Infrastructure includes machine learning processes to automatically adjust performance thresholds to reduce false alarms. Alerts can be forwarded to members of staff by email or SMS. The higher plan, which is called Enterprise, also includes an automatically created application dependency map. That speeds up root cause analysis when problems arise.
The base plan of Datadog Infrastructure is called Pro and there is also a Free edition, which is limited to monitoring one host. You can get a 14-day free trial of the Pro and Enterprise editions.
Redis Monitoring FAQs
What is Redis monitoring?
The NoSQL database system, Redis holds a lot of data in memory, so Redis monitoring needs to focus on memory management. If the Redis service doesn’t have enough memory available, the whole system will seize up because memory is also needed for tasks such as sorting and filtering. A memory shortage would cause the Redis system to hang, while functions wait for memory to become available in order to execute. Fortunately, it is possible to record total memory availability and track memory usage to spot approaching resource exhaustion.
How do I monitor my Redis queue?
The easiest way to monitor the Redis queue is to get a database or server monitoring tool that has an integration for Redis. “Integrations” are extensions to standard system monitoring packages that add on capabilities to gather data from specific technologies. In many cases, these integrations also add on extra pages to the monitoring dashboard to display the gathered data and implement alerts to draw attention to reducing spare capacity. An alternative method is to gather logs and set up your own search strings to look for specific messages about the queue. The creation of a manual queue monitoring service is time-consuming, so buying a pre-written monitor is worth the money.
Is Redis a cache or DB?
Redis is a directory service, that provides structured data management. The specification for Redis provides message brokers to define different record structures and confirm data integrity. Another major feature of the system is a queue structure. All of these attributes mean that Redis can be used to cache data or to formally structure records into a database. By keeping data in memory, Redis can deliver recently processed records very quickly, which gives it an advantage as a short-term data storage and serving system.


