PRTG stands for “Paessler Router Traffic Grapher,” which was the tool’s original name. Paessler is a German company that began operations in 2001. It first released PRTG in 2003. Since that date, the monitoring tool has become one of the industry leaders.
Here is our list of the best Paessler PRTG alternatives:
- Auvik EDITOR’S CHOICE A SaaS platform that provides automatic discovery, mapping, and inventory creation for networks and then supports network performance monitoring with alerts for encountered problems. This is a cloud-based system and you can assess it on a 14-day free trial.
- Site24x7 (FREE TRIAL) A cloud-based monitoring system that covers IT infrastructure, applications, and user behavior. Start a 30-day free trial.
- ManageEngine OpManager (FREE TRIAL) A combined network and server monitor.
- Nagios XI An extensible infrastructure monitoring system.
- AKIPS Offers autodiscovery service, SNMP monitoring, Syslog management, and NetFlow data collection.
- Atera Automated monitoring systems for networks, servers, and applications.
- ConnectWise Automate A Cloud-based system monitoring and management tool.
- Zabbix A free monitoring tool.
- Kaseya Traverse A system monitoring and management tool with threat protection.
One problem you might encounter with PRTG is Paessler’s steadfast determination to keep this utility as a pure monitoring tool. Thus, there are not and never will be any configuration management, DDI (DHCP/DNS/IP Address Management), or intrusion prevention measures in the tool.
Paessler’s strategy might backfire and lose some customers because rival systems monitor infrastructure just as well as PRTG and are expanding to include more process automation and problem remediation processes. In this guide, you will encounter tools that are just as good as PRTG, and some that have added functionality that PRTG will never have. First, let’s take a look at the strengths of PRTG.
Paessler PRTG Network Monitor (FREE TRIAL)
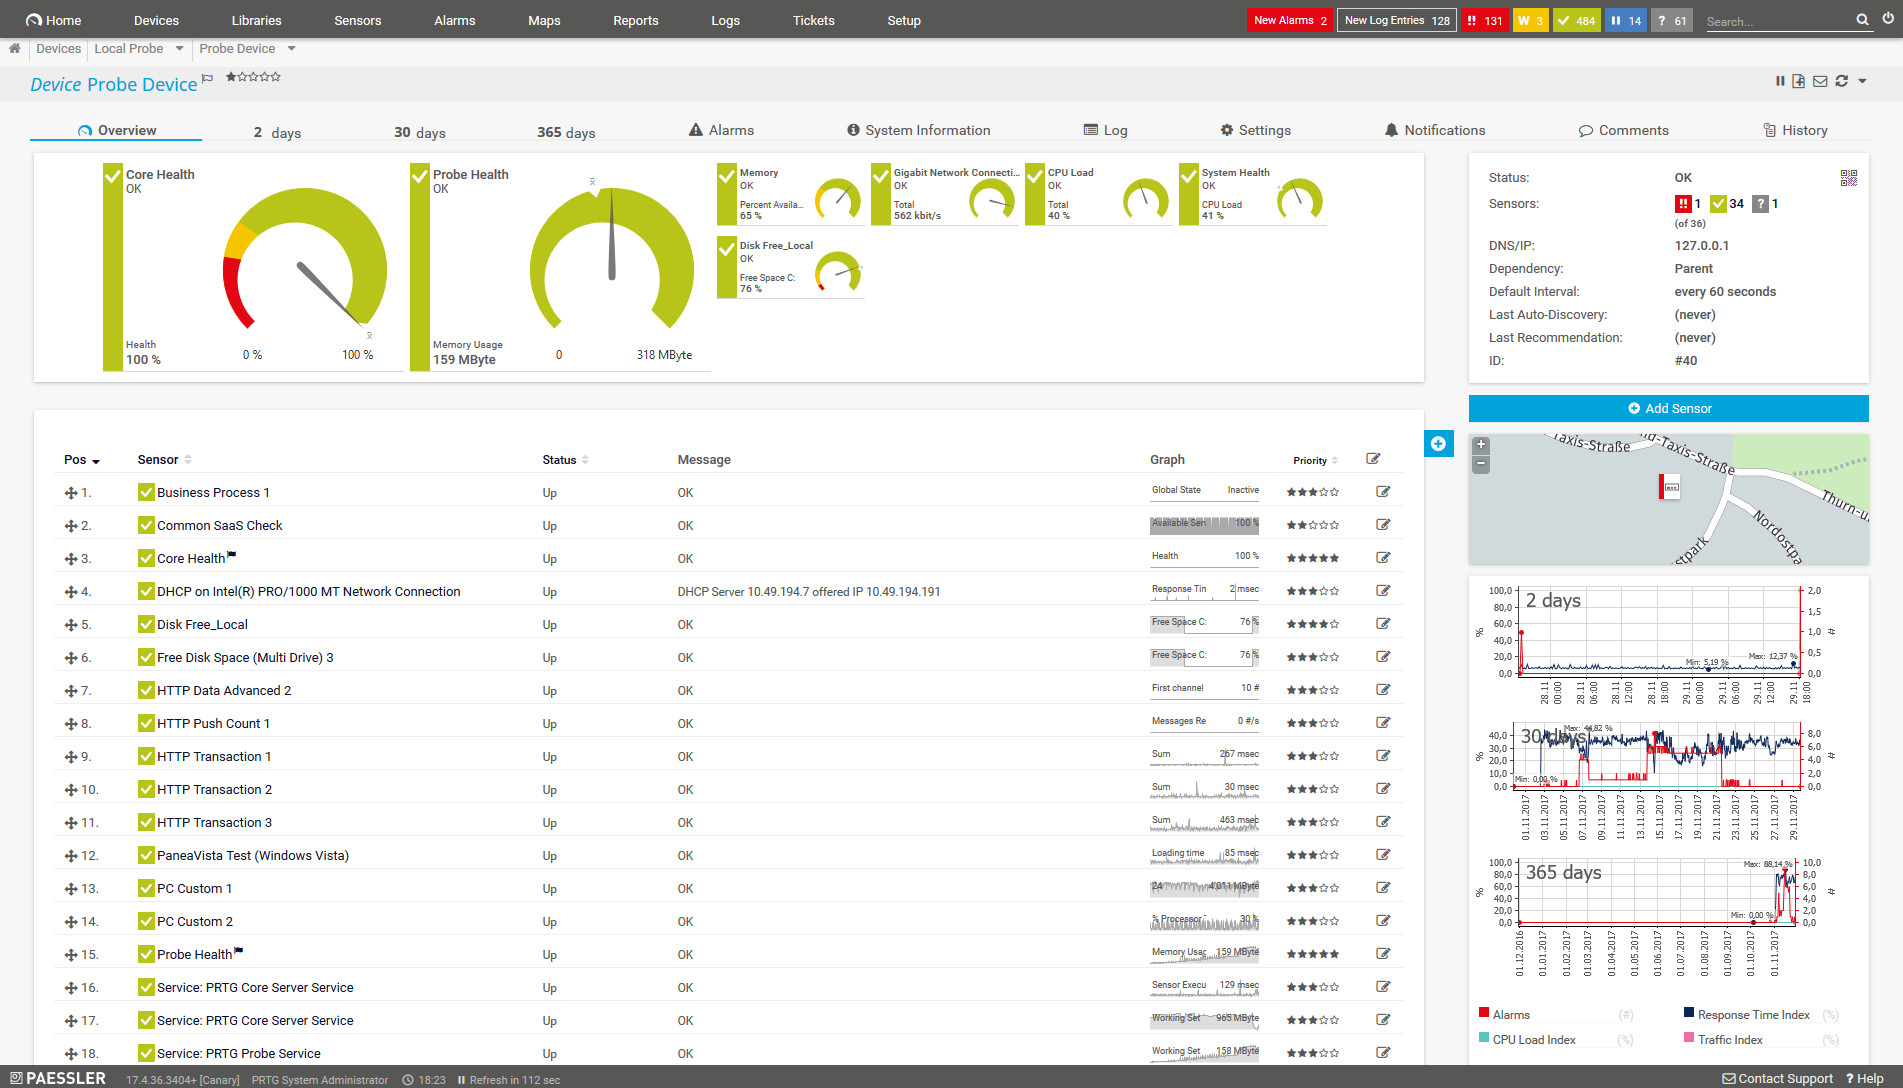
Paessler ships the same package to all clients, be they large or small. The PRTG Network Monitor pack is a collection of monitoring functions, which are called “sensors”. A sensor is either a utility, such as Ping, or an action that monitors one hardware element. For example, a switch port monitor is one sensor per port. If you activate the monitor on all of the ports on your switch, you have used up that many sensors, not just one.
The number of sensors that you activate is very important because that is the basis of Paessler’s charging structure. The company has several price points that give a sensor allowance. These are:
| PRTG Level | Services |
|---|---|
| PRTG Free | 100 sensors with a single server implementation |
| PRTG 500 | 500 sensors reporting to one server installation |
| PRTG 1000 | 1,000 sensors reporting to one server installation |
| PRTG 2500 | 2,500 sensors with one server installation |
| PRTG 5000 | 5,000 sensors with one server installation |
| PRTG XL1 | An unlimited number of sensors on one server installation |
| PRTG XL5 | Unlimited sensors on up to five servers. |
The monitor covers networks, servers, and applications. That is rare in the industry, where the monitoring of these three equipment sectors is usually divided into separate tools. It is also rare to find a tool that includes both network device monitoring and network traffic analysis – often these two functions are split between two separate tools.
So, Paessler PRTG has a lot going for it and its ability to be tailored is fairly unique. If you just want a network monitor and you aren’t interested in server or application monitoring, then you only turn on the network-related sensors. Similarly, you can decide to just monitor your network device status or spread your paid-for sensor allowance to traffic monitoring functions as well.
No matter which paid PRTG package you think would be most appropriate for your needs, you can start off with a 30-day free trial, which gives you an unlimited number of sensors. During this trial period, you are probably going to go for those sensors that cover the infrastructure monitoring functions. However, while there are no limits on the number of sensors, you may well investigate many of the other areas in the package and ultimately decide to extend your original monitoring boundaries.
PRTG Network Monitoring
PRTG’s main function is as a network monitor and central to that task is the status monitoring of network devices. The tool performs these tasks by employing the procedures of the Simple Network Management Protocol (SNMP). This system has the advantage of already being installed on all of the network equipment that you buy. SNMP requires a central controller to poll the agent software, which is the pre-installed software on your routers and switches.
As the SNMP manager regularly broadcasts report requests to all device agents, the responses to those requests provide a bonus feature to the system, which is autodiscovery. This enables PRTG to gather information on all of the devices on your network and how they link together, so you don’t have to type in your equipment inventory when you set up PRTG. As these request broadcasts are ongoing, PRTG can spot any changes to your infrastructure.
The tool creates a network topology map from the information in the equipment inventory. Again, this task is performed automatically and the map gets updated without any manual intervention whenever the layout of the network and its component devices changes.
The SNMP system includes a message type, called a “trap”. This allows device agents to send a status report in emergencies without having to wait for a request. These are interpreted in the PRTG console as alerts, which can also be forwarded to you by SMS or email.
The main package installs on Windows Server, but can monitor devices with any operating system. Paessler also produces mobile apps for Android and iOS so you can keep in touch with the dashboard when you are away from your desk.
Frequently-deployed sensors in the pack include Ping, Traceroute, a packet sniffer, a NetFlow sensor, a J-Flow sensor, an IPFIX sensor, and an sFlow sensor. Traffic throughput rates are calculated by querying network devices with SNMP for their in/out processing reports every five minutes.
The network monitoring tool is able to cover wireless networks as well as LANs and it can also monitor the connection to and equipment at remote sites.
PRTG Server Monitoring
The PRTG system can be set to monitor your servers, wherever they are. It is also capable of cloud infrastructure monitoring and has specialist sensors for Amazon Web Services, Dropbox, Google Drive, and One Drive. With on-premises servers, you can activate sensors to report on their CPU performance, memory utilization, disc volumes, and spare disk space. The package also includes environmental sensors for the server room and server racks.
The PRTG server monitoring package includes tailored sensors that monitor specialist servers. These include mail servers, web servers, database servers, file servers, and virtual servers. The monitoring of these functions is closely linked to the application monitoring software services of PRTG.
PRTG Application Monitoring
Monitoring the servers that deliver applications to your staff and customers requires application sensors. The PRTG sensor includes mail application sensors that include POP3, SMTP, and IMAP monitors. The database sensors in the pack include monitors for MySQL, Microsoft SQL, and Oracle SQL. Web server sensors can report on IIS and Apache and the main focus of the file server sensors is FTP.
The activity of these applications can be tracked both on the server and when they appear in network traffic. Combining application data with network monitoring enables you to improve your traffic analysis by getting reports on volume per application.
Performance-related sensors monitor VoIP traffic delivery. Firewall and port monitoring are also included to cover your security system and team performance sensors include SLA auditing.
If you operate virtualizations on your network, the combined network, server, and application monitoring capabilities of PRTG will come in particularly handy. There are specific sensors from VMWare vSphere ESXi systems, Microsoft Hyper-V, and Citrix Xen products.
PRTG Software-as-a-Service
You no longer need to install PRTG on-premises because the system is now also available on the Cloud. The online version of the system has all of the functionality of the on-premises software, only you don’t need to maintain the software, in fact, you don’t need to have any servers.
The payment plan for the Cloud-based PRTG is subscription-based with a charge per month. You don’t get to use 100 sensors for free with this service; however, you can get a trial of the 500 sensors package (PRTG 500) for free for 10 days. There are no XL packages available with the Cloud version of PRTG.
The Best Paessler PRTG Alternatives
Our methodology for selecting monitoring tools like Paessler PRTG
We reviewed the market for system monitoring software packages like Paessler PRTG and analyzed the options based on the following criteria:
- A package that includes monitoring functions for networks, servers, and applications
- Network autodiscovery and an automated network topology mapper
- Network device health monitoring and network traffic analysis
- A system of alerts for resource availability or expected performance levels
- Notifications by email or SMS for when alerts arise
- A free trial for a risk-free assessment period or a money-back guarantee
- Value for money or a free package that is worth installing
1. Auvik (FREE TRIAL)
Auvik is a cloud-based service that is able to reach across the internet and track the performance of any network anywhere. This tool’s service starts when you install an agent on one of the endpoints connected to your network. This initializes a discovery process that generates a network inventory and topology map. These records are constantly updated, so if you make changes to the layout of your network or install a new switch, those alterations are automatically reflected in the inventory and the plan.
Key Features:
- Network Discovery: Creates a network inventory
- Network Mapping: Includes path analysis
- SNMP-Based Device Monitoring: Continuous polls devices for status reports
- Traffic Analysis: Compiles throughput statistics with flow protocols
Why do we recommend it?
Auvik provides network discovery, IT asset inventory creation, and topology mapping that matches the functionality of PRTG. This tool implements continuous automated monitoring of network devices with SNMP and raises alerts when problems are detected. The tool also has a traffic analysis module. Auvik provides network configuration management, which PRTG doesn’t offer.
Once the network documentation is in place, the network performance monitoring can begin. This is an SNMP-based service, with the onsite agent unit acting as an SNMP manager. The agent collects SNMP responses and uploads them to the Auvik server.
The cloud-based Auvik server sorts through SNMP reports and compiles both the inventory and the map. It also reports on any performance problems. Under SNMP, the device agents will send out a Trap message if there is a serious problem with the device. These are uploaded to the Auvik server where they are interpreted into alerts.
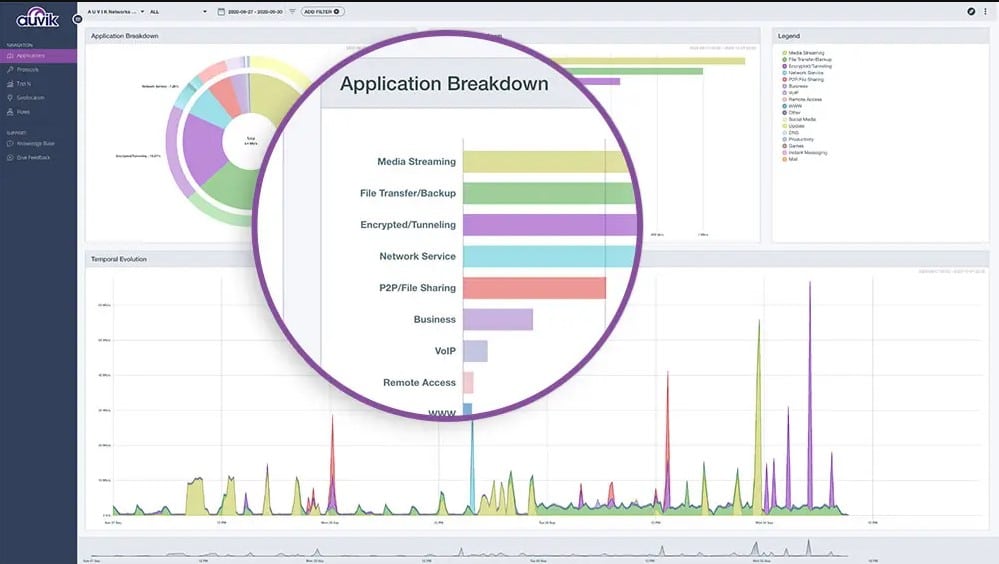
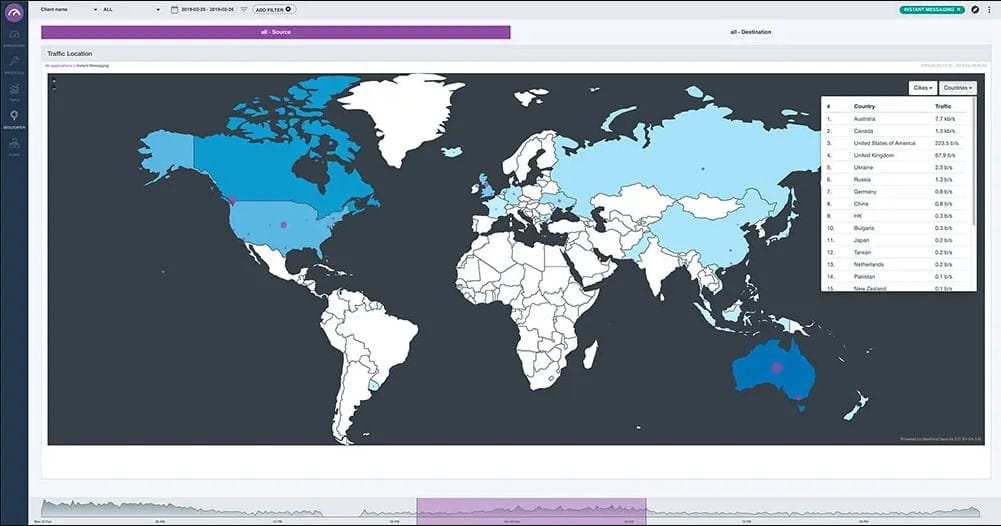
Like PRTG, Auvik also implements traffic analysis. The package can communicate with switches by using NetFlow, J-Flow, IPFIX, and sFlow. This traffic analysis service is able to test and report on the performance of internet connections that form part of the end-to-end delivery path for applications.
Who is it recommended for?
This system is a SaaS package, so it competes with the Hosted PRTG platform. There isn’t an on-premises version of Auvik. There are two plans for Auvik. The lower edition offers asset management and the higher plan adds on live traffic monitoring. There is also a configuration suitable for MSPs available.
Pros:
- Spots Traffic Surges: Analyzes traffic patterns
- Identifies Underutilized Infrastructure: Reveal links with little traffic
- Alerts for Performance Problems: Notifies for device failure of performance problems
- Internet Testing: Checks links between sites or to cloud platforms
Cons:
- No On-Premises Option: This system is only available as a cloud-based service
Auvik is available in two editions: Essentials and Performance. The traffic analysis and log management features of the service are only included in the higher, Performance edition. You can try either Auvik plan with a 14-day free trial.
EDITOR'S CHOICE
Auvik is our top pick for an alternative to PRTG for network monitoring because it is easy to set up and use and it provides both device monitoring and traffic analysis from a cloud platform. You can supervise networks anywhere in the world and you only need a standard Web browser to access the cloud-based system console. This makes the tool a very flexible service that can be useful for small businesses that operate a virtual office with an internet-based virtual network and it is also a good choice for large multi-national companies. The only aspect that PRTG beats Auvik on is the monitoring of applications, which isn’t available in the Auvik package.
Download: Get 14-day FREE Trial
Official Site: https://www.auvik.com/pricing/
OS: Cloud based
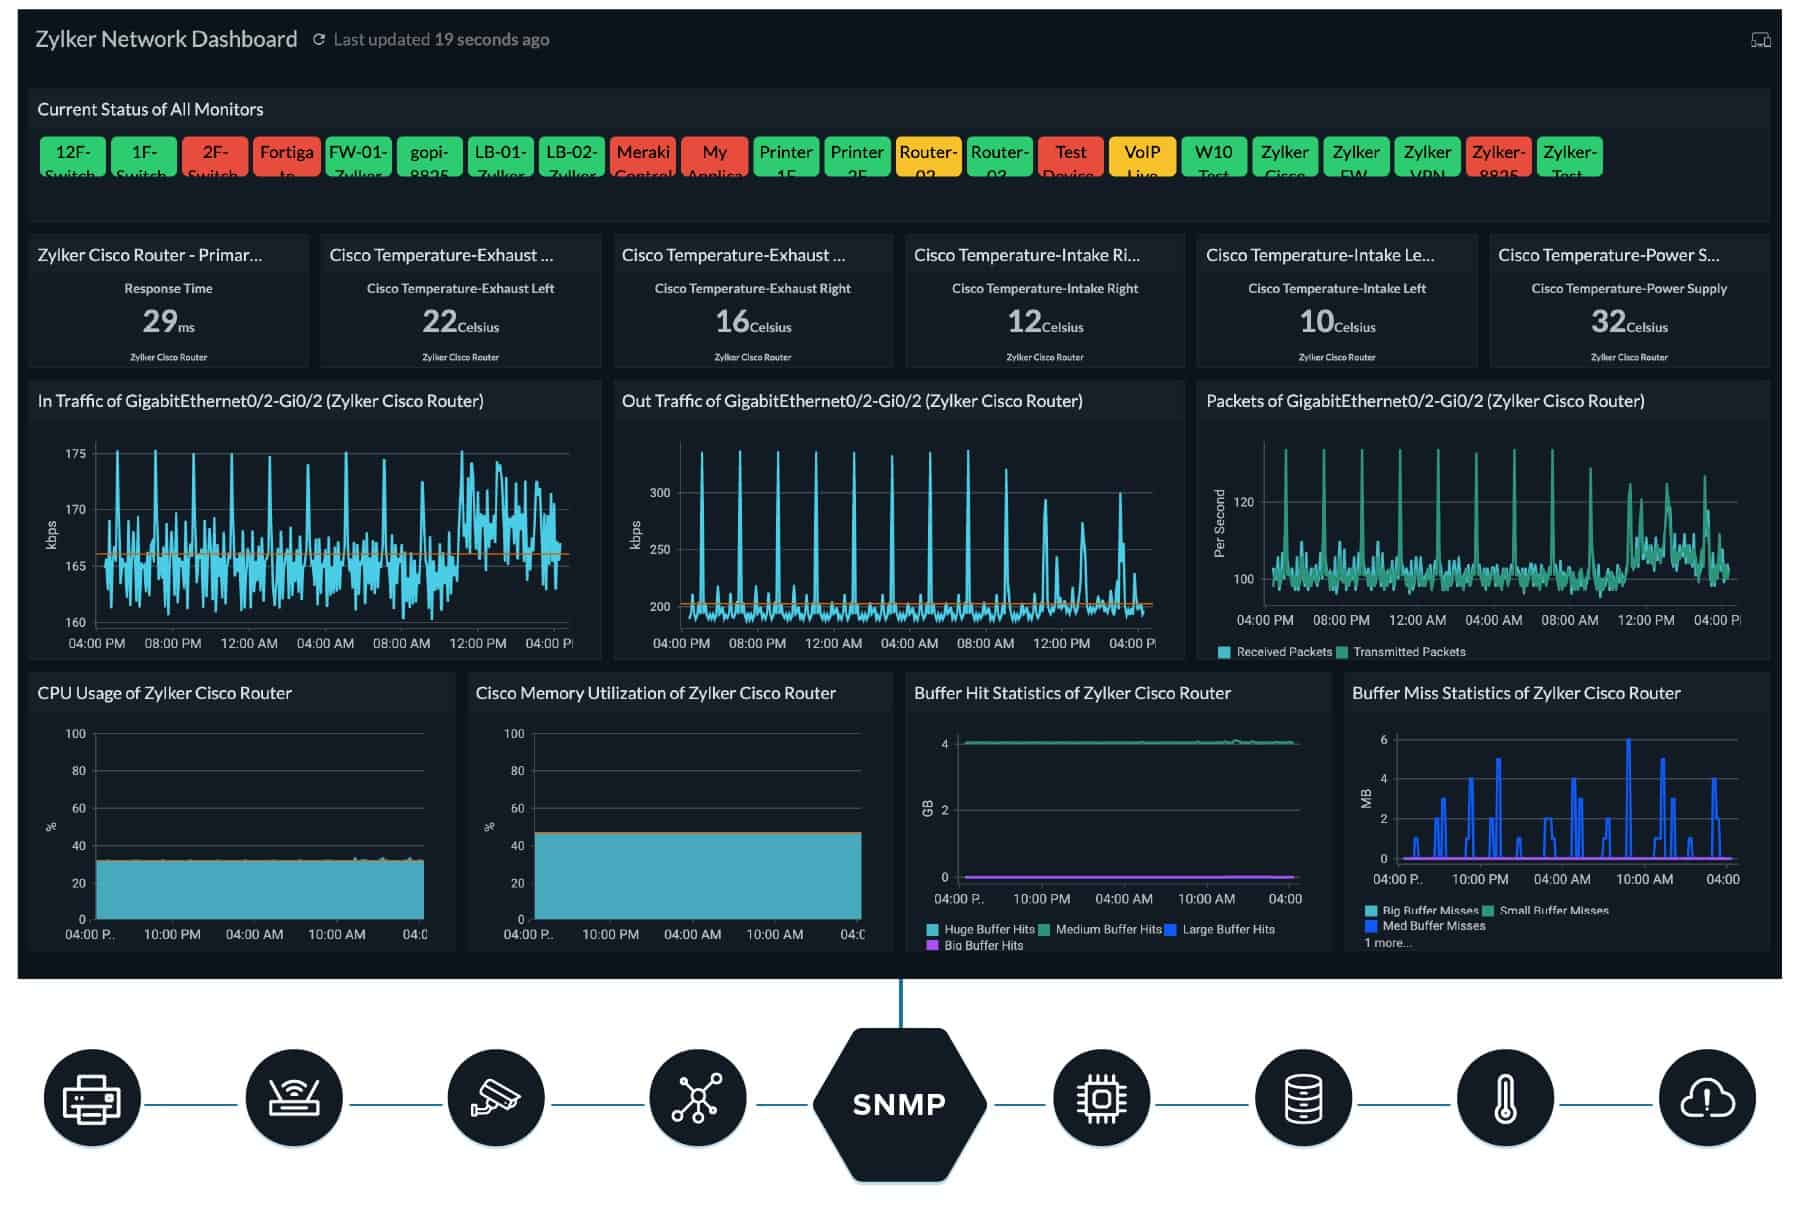
2. Site24x7 Cloud Network Monitoring (FREE TRIAL)
The Site24x7 Network Monitoring tool has quite a lot in common with Paessler PRTG. This system is a combined monitor, whereas most infrastructure monitors focus on one specific equipment type, such as servers or switched. Both PRTG and Site24x7 cover networks, servers, and applications.
Key Features:
- Part of a Bundle of Services: Plans provide full-stack observability
- Cloud-Based System: Packages as SaaS subscription plans
- SNMP-Based Device Tracking: Alerts for component failure
Why do we recommend it?
Site24x7 Cloud Network Monitoring is part of a SaaS platform that provides packages of monitoring services to cover networks, servers, cloud platforms, middleware, and applications. The network monitoring modules of this tool provide discovery, inventory creation, and network mapping. You get constant device health monitoring and traffic analysis with this service.
Beyond those similarities in functions, the characteristics of the two systems diverge. Site24x7 monitors user behavior as well as hardware and software performance monitoring. PRTG has traffic monitoring sensors, but Site24x7 does not. PRTG is available as on-premises monitoring software or a cloud-based service. Site24x7 is only available as a cloud service.
Site24x7 is an impressive package and is a strong rival to the cloud version of PRTG. Like PRTG, Site24x7 is available in a free version. The free Site24x7 is limited to monitoring five websites or servers. The PRTG software ships with a full complement of sensors, but customers choose how many active sensors they want to pay for. Site24x7 offers larger numbers of sensors in a series of successively higher-priced editions.
Who is it recommended for?
The packages from Site24x7 are sized and priced to make them suitable for small businesses. Larger businesses pay for extra capacity. So, this network monitoring system is suitable for all types of businesses. The service includes both device monitoring and traffic analysis, just like PRTG.
Pros:
- MSP Option: One plan is structured to enable sub-accounts
- Traffic Analysis: Uses flow protocols to reveal traffic patterns
- Path Analysis: Check on network paths and routes across the internet
Cons:
- Scaled for Small Businesses: Larger companies will pay much more than the headline price
Each of the paid editions of Site24x7 can be examined on a 30-day free trial.
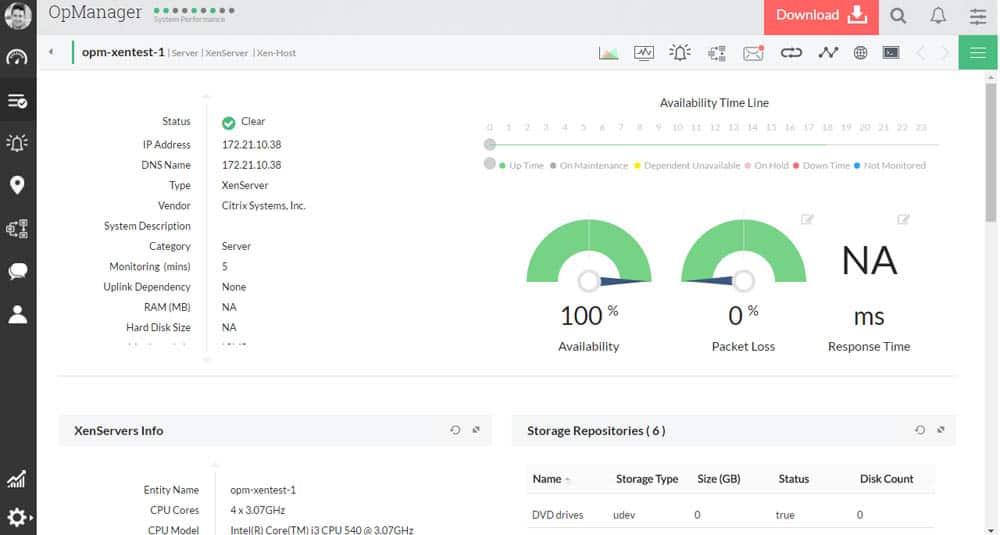
3. ManageEngine OpManager (FREE TRIAL)
OpManager is ManageEngine’s main product. It is a combined network and server monitor with application tracking capabilities, so it tracks the abilities of PRTG very closely. This network monitoring software can be installed on Linux as well as Windows Server, so it goes one better than PRTG.
Key Features:
- Monitoring for Networks and Servers: Tracks the statuses of all hardware connected to the network
- SNMP-Based Device Monitoring: Continuously request device agent reports
- Virtualization Monitoring: Hyper-V, VMware, and Citrix Xen
Why do we recommend it?
ManageEngine OpManager provides monitoring for network devices and endpoints. The service scans your network to create an asset inventory and will draw up a network topology map on demand. This system is able to examine hardware statuses and operating conditions for all devices connected to the network.
The network monitor uses SNMP to monitor equipment statuses and it includes autodiscovery and network mapping functions. The dashboard displays current statuses and also features alerts, forwarding them to technicians by SMS or email. Equipment monitored by OpManager includes wireless Aps, Cloud-based resources, and remote infrastructure. It is also capable of tracking virtualizations built with VMWare, Hyper-V, and Citrix Xen.
Who is it recommended for?
ManageEngine proxies its base package of OpManager so that it is accessible for small businesses and there are more expensive plans for larger businesses. You don’t get network traffic analysis with this tool – you would need to add on another package for that but the two systems slot together.
Pros:
- Performance Alerts: Notifications can be sent by email or SMS
- Network Discovery: Creates a hardware inventory and a map
- Wireless Monitoring: Tracks WiFi performance
Cons:
- No SaaS Option: You can host the software on your AWS or Azure account but payments for processing and storage services are your responsibility
OpManager is free to use to monitor up to five devices. The full system is available for a 30-day free trial.
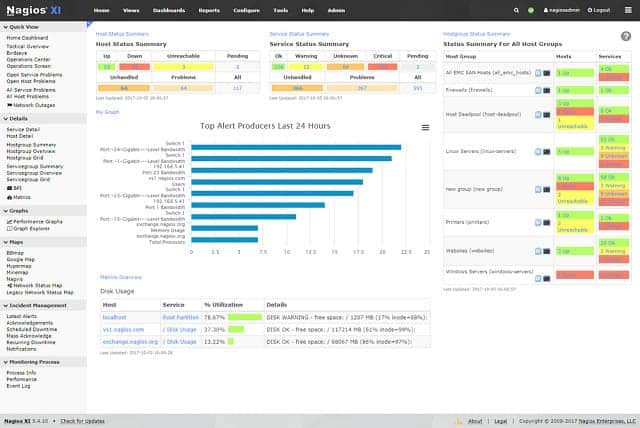
4. Nagios XI
Nagios XI runs on Windows and Linux and has a free version, called Nagios Core. This tool will monitor networks, servers, and applications. Nagios has a very active user community, which distributes free add-ons that extend the capability of the original product.
Key Features:
- Network Discovery: Creates an inventory and a map
- Device Status Tracking: Uses SNMP
- Free Version Available: The free option is called Nagios Core
Why do we recommend it?
Nagios XI is a full system monitoring package, which makes it a good match for the functionality of PRTG. It gives you discovery, inventory, and mapping services and it can be expanded by free plug-ins. This is a closer package to PRTG than Atera and RMM Central because it just provides monitoring services.
The network monitor shows live device statuses and system alerts, It also monitors bandwidth usage, and event log messages. Server statuses and application performance can also be tracked with this tool at no extra cost.
Who is it recommended for?
This system is a suitable monitoring service for mid-sized and large businesses that are largely based on-premises. Although the bundle does include cloud service monitoring, it is not as hot at tracking serverless systems as some of the other tools on this list. Small businesses should look at Nagios Core.
Pros:
- Performance Alerts: Sent as notifications by SMS or emails
- Automated Responses: Write scripts that are triggered by alerts
- Extension for Extra Functionality: Free plugins are available from Nagios Exchange
Cons:
- Traffic Analysis Not Included: Traffic flow functions are offered as a separate package
The user account structure includes multi-tenant account set up options, which makes this tool a good option for managed service providers. The monitor is available in two editions; Standard and Enterprise. Extra features in the Enterprise edition include capacity planning and auditing. You can get a 60-day free trial of Nagios XI.
5. AKIPS
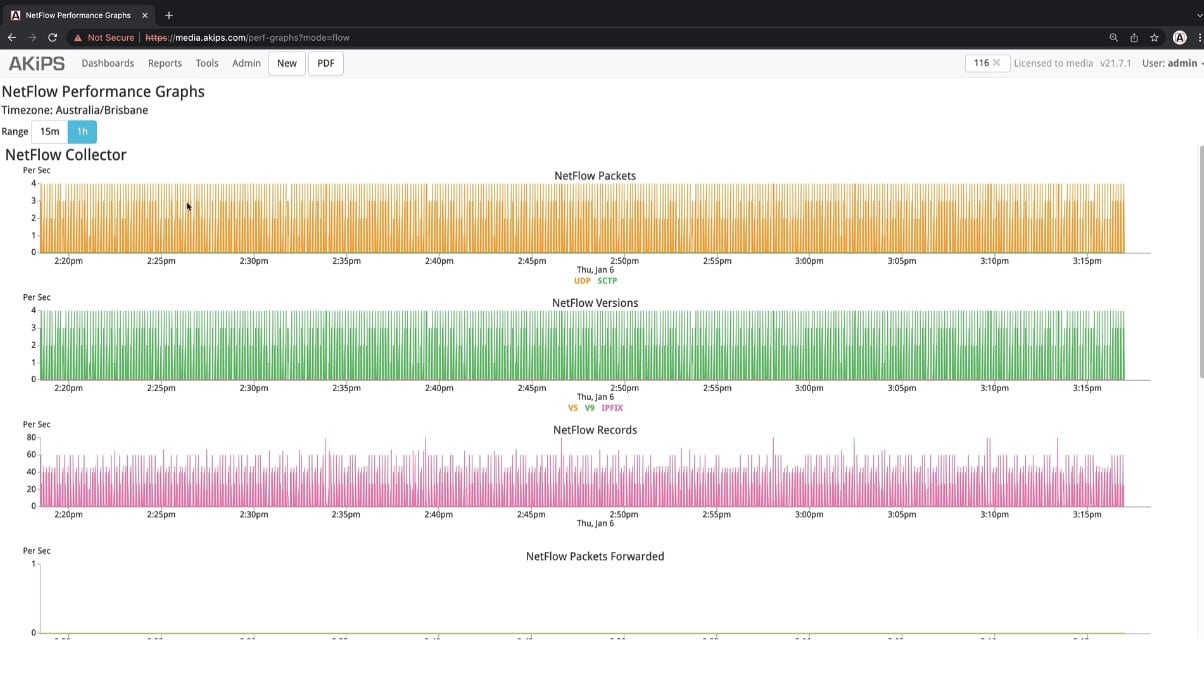
AKIPS is a software package that runs inside a VM on its own operating system. Just like PRTG, this service implements a network discovery routine and then implements SNMP-based device status polling. The package also includes a NetFlow sensor that can collect traffic data from multiple switches simultaneously.
Key Features:
- Scalability: Capable of monitoring millions of metrics with ease.
- Web-Based Interface: Accessible from any device with internet access, providing flexibility.
- Automated Network Discovery: Automatically detects new devices on the network for streamlined monitoring.
- Customizable Dashboards: Tailor dashboards to display only the metrics that matter most to you.
- Comprehensive Reporting: Generates detailed reports on network performance and issues.
Why do we recommend it?
AKIPS is a good alternative to PRTG because it includes all the elements of a network monitoring system that anyone would need. It includes device status checks and traffic analysis. The package also provides log message collection and reporting features. The service creates time series graphs to show performance and generates alerts when problems arise.
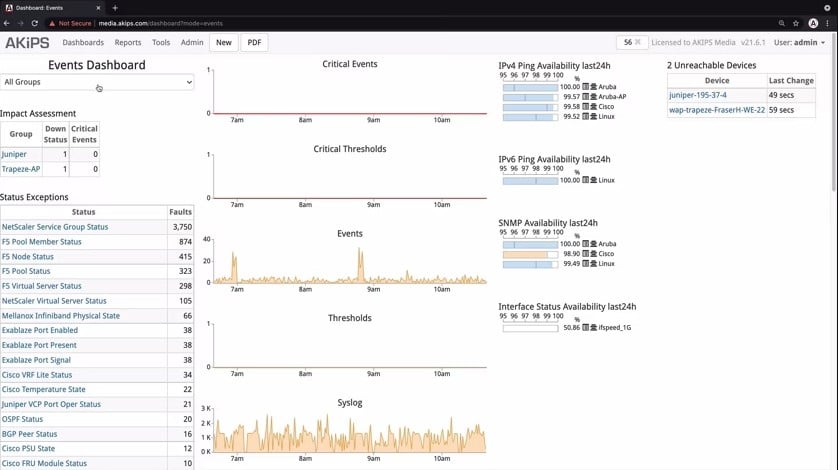
AKIPS uses both Ping and SNMP to create and manage its network inventory and records device availability and details within its network inventory. The Device Dashboard shows details of each piece of equipment, such as make and model. It also lists which interfaces are in use. Click through to the Interface Dashboard to see information on each connection that the switch manages.
Access the NetFlow Dashboard to set up link monitoring with time-series graphs on data throughput. You can create performance expectation bands on these metrics that will trigger alerts if crossed. The Events Dashboard collects system alerts and also information from log messages. You can forward logs to a SIEM tool and alerts can be sent as notifications by Microsoft Teams, Slack, PagerDuty, ServiceNow, or Opsgenie.
Who is it recommended for?
This package offers a good deal because it packages together those tools that any network manager needs to monitor a LAN. The PRTG bundle has far more utilities but no one would ever activate all of those units. You don’t get swamped by possibilities with the AKIPS system.
Pros:
- High Scalability: Efficiently handles a large volume of network metrics without performance degradation.
- Customizable Monitoring: Allows users to customize dashboards and alerts to suit specific needs.
- Quick Deployment: The web-based nature of the tool enables fast and easy deployment across various networks.
- Automated Discovery: Reduces the manual effort needed to identify and monitor new devices.
Cons:
- High Initial Configuration: Requires significant setup time to fully customize and optimize monitoring settings.
AKIPS doesn’t publish a price list, so interested prospective buyers need to contact the Sales Department to get a quote. You can also ask for a demo of the network monitoring system. Finally, access a 30-day free trial to fully assess the package.
6. Atera

Atera is a software platform for MSPs. It enables managed service providers to supervise the networks, servers, and applications running on client sites. As Paessler PRTG is able to operate remotely, there are many similarities between these two infrastructure monitoring systems.
However, Paessler isn’t able to perform administration tasks, such as patch management and backup and restore procedures. It also doesn’t include the professional services automation (PSA) systems that MSPs need to run their services. So, Atera is an alternative to PRTG … and then some.
Key Features:
- Full-Stack Observability: Monitors networks, servers, and applications
- Multiple Audiences: Versions for managed service providers and IT departments
- Remote Monitoring and Management: Provides endpoint management services that PRTG doesn’t offer
- Automated Monitoring: Scans run continuously with alerts for discovered problems
- Delivered from the Cloud: Access the console through a web browser
Why do we recommend it?
Atera is a remote monitoring and management (RMM) package and it also provides a ticketing system for a support team. The tool provides more functionality than PRTG because the Paessler system is purely a monitoring package. The Atera plan gives you patch management and other maintenance features.
Atera is a cloud service and so the MSP that uses it doesn’t need to worry about operating system compatibility. In fact, it doesn’t even need servers to get started managing the ITB infrastructure of other businesses. All the technicians of the MSP need is a standard web browser. The console for Atera can also be accessed through an app for mobile devices.
The network monitoring service on Atera is based on the Simple Network Management Protocol (SNMP) – the same as PRTG. Also, like PRTG, Atera will scan a new system for attached devices and log them all in an equipment inventory. This service runs constantly, so operators are able to detect when new devices are added to the network and when equipment is removed.
Like PRTG, Atera includes server monitoring capability, checking on the statuses of CPU, memory and disk space. Unlike PRTG, Atera is able to clean up disks and kill processes that seem to be malicious or are hanging. The Atera system can scan all devices for software and log all instances, enabling software license management. Atera is also able to roll out updates to authorized software and patch operating systems automatically.
Who is it recommended for?
While PRTG is a monitoring system. Atera is a bundle of tools for IT support teams. That includes remote access and remote desktop utilities and a ticketing system for supporting users. The Atera platform is delivered from the cloud and it is available in versions for MSPs and IT departments.
Pros:
- Ticketing System: Not available with PRTG
- No Onboarding Costs: A price per technician with no extra fees
- Monitor any Site Anywhere in the World: The system operates across the internet
- SNMP-Based Network Monitoring: The same technique that PRTG uses
- Creates a Software Inventory: Provides automatic patching
Cons:
- No On-Premises Version: Only available as a cloud SaaS package
As a cloud service, Atera isn’t charged for in a lump sum upfront. Instead, the MSP takes out a subscription to the service for each of its technicians. Pricing starts at $129 per technician. The service can be paid monthly or annually, with the annual payment plan working out cheaper. Any business can check out all of the features of Atera by signing up for its free trial. This is a true one-stop-shop solution, a RMM tool for MSPs with dozens of features at your fingertips.
7. ConnectWise Automate
ConnectWise Automate is billed as a remote monitoring and management tool. However, the service is cloud-based, so you could just as easily use it to manage your own IT system. As this is Software-as-a-Service (SaaS), you don’t need to install and maintain on-premises software in order to use it.
Key Features:
- Remote Monitoring and Management: Provides system management functions as well as monitoring services
- Delivered from the Cloud: This is a SaaS package
- Asset Discovery: Network scanning and device agent installation
Why do we recommend it?
ConnectWise Automate is an RMM package for use by managed service providers and IT departments. As the name of this package suggests, it provides a lot of task automation services. The bundle is a SaaS platform that includes remote device management tools, such as patch management, which PRTG doesn’t have.
As this tool’s name suggests, it includes a lot of task automation. The functionality of ConnectWise automate goes a long way beyond the monitoring functions available in PRTG because it also includes a scripting system to get all of your mundane tasks performed automatically. It also has a patch manager, and asset management tools.
Asset management extends to the creation of self-installing software bundles. New users are given a self-service portal to launch the set up of their desktop and mobile devices and they can also perform standard admin tasks themselves, such as changing passwords.
Who is it recommended for?
This package doesn’t include a ticketing system, so its functionality is closer to the services of ManageEngine RMM Central than Atera. This system can be enhanced by other services, such as a backup and recovery service, called BCDR. This service includes automated monitoring like PRTG and many more services that PRTG doesn’t provide.
Pros:
- Software Management: Onboard endpoints with a software bundle
- Security Scanning: Checks for out-of-date software and patches it
- Remote Monitoring: Monitor multiple networks simultaneously
Cons:
- No On-Premises Package: Only available as a SaaS platform
You can get ConnectWise Automate on a 14-day free trial. The sales team will extend that trial period up to a month on request.
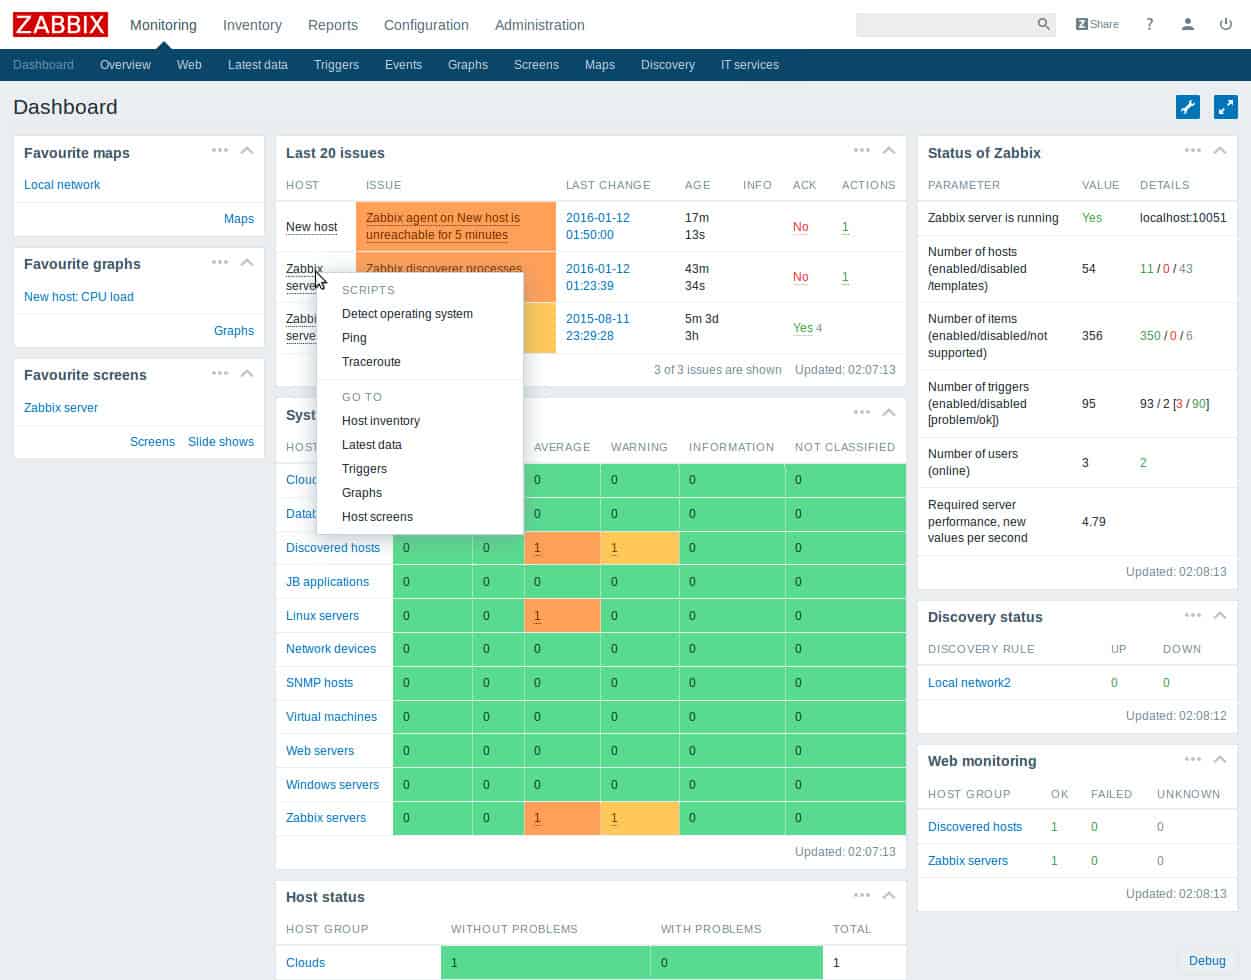
8. Zabbix
Zabbix is a free infrastructure monitoring system that can be installed on Windows, Mac OS, Linux, and Unix. The tool tracks network device statuses through SNMP and also processes alerts. As well as being displayed in the dashboard, alerts can be saved to file or forwarded as notification via SMS, email, or chat app.
Key Features:
- Free Package: There is no paid version
- Full-Stack Observability: Monitors networks, servers, cloud systems, services, and software
- Autodiscovery: Creatures a network inventory and map
Why do we recommend it?
Zabbix is a free system monitoring package. You get network, server, cloud, middleware, and application monitoring with this tool, which makes it a lot like PRTG. This package, like Nagios, runs on Linux or on hypervisors, and also like Nagios, it can be expanded by add-ons, which in the Zabbix world are called templates.
The package includes a device discovery procedure and a network topology map creation facility, both of which will update automatically should your infrastructure change. Zabbix can monitor LANs, wireless networks, Cloud-based resources, and remote sites. Communications with the data collectors offsite are encrypted.
Zabbix allows for task automation through scripting. These tasks can include data gathering and problem remediation and they can be triggered by alerts or set to run periodically.
The dashboard aids status comprehension because it is well laid out and includes color-coded graphical data representations.
You have to pay for support for the tool. However, the user community for Zabbix is accessible through a forum and provides lots of tips and tricks on using the system and many eager users are happy to help fellow Zabbixers experiencing problems.
Who is it recommended for?
There is no paid version of Zabbix. Its $0 price tag will appeal to small businesses. However, the package also has a lot of large corporations on its customer list. Big companies that require professional support for all of their software can subscribe to a support package.
Pros:
- Multiple Deployment Options: Install Zabbix on your site or on a cloud account
- Multiple Sites: Monitor many sites in one console
- Extensions Available: Add on extra functionality with templates
Cons:
- Support Not Included for Free: You can pay for a professional support contract
9. Kaseya Traverse
Kaseya Traverse is a system monitoring and management package that is aimed at IT departments. It covers networks, services, equipment, servers, and applications. This software installs on Windows environments.
Key Features:
- System Discovery: Creates inventories and a map
- Network Configuration Management: Backs up and reapplies network device configurations
- Traffic Analysis: Uses flow protocols
Why do we recommend it?
Kaseya Traverse is a monitoring package that focuses on networks. This system is an on-premises software bundle for installation on Windows. The tool is also able to monitor connections to cloud platforms. This package provides autodiscovery, network inventory creation and maintenance, and topology mapping as well as continuous monitoring.
The network monitoring section of Traverse employs SNMP functionality. It includes an autodiscovery module, which compiles a device inventory and creates a network map. The tool can cover on-premises networks, including Wi-Fi and also remote resources, including Cloud-based services.
The dashboard is customizable through a system called “service containers.” This gives technicians a front page that relates to the business functions that they are responsible for. A service container creates a view on specific infrastructure elements that contribute to the delivery of applications to a department in your business. All technicians get alerted by SNMP traps or customized threshold breaches. The dashboard includes color-coded data visualizations.
Who is it recommended for?
Kaseya markets its products to small businesses as well as larger organizations. So, this is a solution that could be suitable for small and mid-sized enterprises. You don’t get server and application monitoring with this service, so the tool doesn’t compete fully with the capabilities of PRTG.
Pros:
- SNMP Monitoring: Scans for device status reports
- SLA Manager: Links an SLA’s requirements to system performance
- Deployment Options: SaaS or on-premises
Cons:
- No Price List: You have to contact the Kaseya Sales Department to get a quote
Extra features of Kaseya Traverse include a scripting language, task automation, and automated system monitoring based on baseline establishment. This is an advanced threat prevention tool that goes way beyond the scope of the service offered by PRTG. You can get Kaseya Traverse on a 14-day free trial.
Choosing a PRTG Network Monitoring Alternative
As you can see from this guide, PRTG is good, but is by no means the only product on the shelf and in many cases, other monitoring and management tools may suit your requirements better. Take advantage of the free trials and free versions of the six tools in this list to trial one of them and compare it to PRTG yourself.
Paessler PRTG FAQs
Is there a typical PRTG user?
PRTG’s pricing structure, including a free trier, makes the system suitable for all sizes of businesses. Any business that has an IT system needs a monitor and so could use PRTG.
What database does PRTG use?
PRTG uses its own proprietary file-based database system.
What is PRTG configuration.dat?
PRTG configuaration.dat is held in the PRTG data directory at
%programdata%PaesslerPRTG Network Monitor
Is MRTG associated with PRTG?
Multi Router Traffic Grapher (MRTG) was an early network monitoring system. Dirk Paessler decided to write his own network monitor that would be better than MRTG. He named his new system after himself to create Paessler Router Traffic Grapher (PRTG).

