

As networks become more complex and dynamic, especially with the growing adoption of cloud, hybrid, and multi-cloud environments, ensuring optimal network performance has become a critical task. Network observability software is at the forefront of this transformation, providing IT teams with the ability to gain deep insights into their network’s health, user experience, and potential vulnerabilities.
Network observability tools are evolving to not only monitor network performance but also predict and mitigate issues before they impact end-users. Below, we’ll look at some of the most innovative and effective network observability tools and how they can help organizations stay ahead of network issues.
Here is our list of the best network observability tools:
- ManageEngine OpManager EDITOR’S CHOICE This comprehensive network device monitoring package offers network discovery, device documentation, network mapping, real-time monitoring, detailed performance analytics, customizable dashboards, and predictive alerts. Available for Windows Server, Linux, AWS, and Azure.
- Paessler PRTG Network Monitor Automatic network discovery and topology mapping leads to continuous device start monitoring and traffic analysis options. Offered as an on-premises software package for Windows Server and as a SaaS platform.
- Datadog Network Device Monitoring This cloud-based system provides end-to-end visibility into network health and performance with continuous status polling and an optional traffic analysis add-on.
- Cisco ThousandEyes This SaaS platform offers network monitoring for LANs, WANs, Web assets, and cloud platforms with testing tools and adaptable system tests.
- New Relic A large cloud platform of system observability tools that includes network monitoring services for device statuses and traffic analysis.
- Nagios XI An expandable on-premises system that offers full-stack observability with network device status tracking included. Runs on Linux or Docker.
- Zabbix An open-source system monitoring tool with a network monitoring unit that can extend to WANs and cloud link monitoring. Offered as a free on-premises package for Linux or a paid SaaS platform.
As you will note, most of these solutions are cloud-based SaaS platforms, which reflects the monitoring tools sector’s move to SaaS delivery. However, we have included some on-premises software packages for those who don’t want to use cloud-based systems. We have also included some options that are free to use.
The best network observability tools
Network observability platforms provide comprehensive visibility into network health, performance, and user experience. They offer real-time monitoring, traffic analysis, and predictive analytics to detect and address issues before they impact users. These platforms enable proactive network management, ensuring optimal performance, reliability, and seamless operation across complex network environments.
Our methodology for selecting a healthcare cybersecurity solution
We reviewed the market for the cybersecurity tools that healthcare organizations need and tested tools based on the following criteria:
- Ability to track network performance and health in real-time for immediate insights into traffic, uptime, and potential issues.
- Provides full visibility across your entire network infrastructure, including devices, applications, and endpoints.
- Supports large-scale networks and can easily grow with your business as your infrastructure expands.
- Uses AI or machine learning to predict potential issues or performance bottlenecks before they affect users or services.
- Automated alerts and response systems, minimizing manual intervention by notifying the right teams and triggering pre-defined actions based on network anomalies.
- An opportunity to examine the tool before paying through a free trial or a demo.
- A good deal that is represented by a fair price for the services that are on offer or a free tool.
With these selection criteria in mind, we collated a list of eight network observability tools that we are happy to recommend.
1. ManageEngine OpManager

ManageEngine OpManager offers a network discovery service that automatically detects devices across your network. It provides detailed device documentation and topology mapping that helps visualize the network layout and interconnections in real-time. This system allows network administrators to quickly identify and document devices and their relationships, helping them understand network health, performance, and vulnerabilities at a glance.
Key Features:
- Real-time Monitoring: Continuous, real-time monitoring of network performance, catching issues instantly before they impact business operations.
- Automated Device Discovery: Spots new devices added to the network and automatically updates the dashboard, minimizing manual effort.
- Network Topology Mapping: Visualizes network components and relationships to identify potential problems quickly and plan path efficiency.
- Advanced Monitoring: Supports SNMP monitoring for devices and interfaces, providing insights into device health, availability, and performance metrics.
- Troubleshooting Tools: Ping, Traceroute, and SSH access to diagnose and resolve network issues.
Why do we recommend it?
We recommend ManageEngine OpManager for its comprehensive network observability features, combining real-time monitoring, SNMP-based device management, and automated troubleshooting tools. The dashboard provides customizable screens and other adaptable features include alert conditions and reports. This package implements a high degree of observability automation, saving time and money.
I found that OpManager provides continuous monitoring of network performance with the Simple Network Management Protocol (SNMP), automating observability of the health and availability of network devices, including routers, switches, and servers. The platform includes WAN monitoring capabilities to check network performance across wide-area connections. The troubleshooting tools in the package, including Ping, Traceroute, and diagnostic reports, enable admins to resolve issues directly and minimize downtime.
Who is it recommended for?
OpManager is highly recommended for network administrators and IT teams managing mid-to-large scale networks, especially in environments where network uptime, visibility, and performance optimization are critical. A higher plan is able to monitor multiple sites in one dashboard, and all editions provide link connectivity monitoring to watch over internet connections between sites on a WAN and to cloud platforms.
Pros:
- Easy-to-use Interface: An attractive dashboard with graphical representations of data and options to customize screens.
- Comprehensive Device Monitoring: Monitors all types of devices, including routers, switches, firewalls, servers, and cloud-based resources.
- Customizable Alerts: An alerting mechanism that can be tailored to specific network events, helping to catch potential issues early.
- Scalability: The tool scales well for networks of varying sizes, from small businesses to large enterprises, providing flexibility in growth.
- Report Formats: Pre-written report templates that can be run on demand or scheduled.
Cons:
- Complex Setup for Large Environments: Initial setup and configuration can be complex, particularly for large, multifaceted networks.
ManageEngine OpManager is available for Windows Server and Linux. It is also available as a service on AWS and Azure. You can assess the OpManager package by accessing a 30-day free trial.
EDITOR'S CHOICE
ManageEngine OpManager is our top pick for a network observability tool because it offers an exceptional combination of real-time monitoring, advanced network topology mapping, and comprehensive device management. OpManager allows IT teams to monitor the health and performance of both on-premise and cloud infrastructure, with SNMP support for automated device monitoring. Its auto-discovery system makes device management easy by automatically identifying and categorizing devices across the network. This reduces manual effort and ensures accurate documentation of all network components. OpManager provides detailed visualizations of network topology, which helps administrators pinpoint issues and optimize network performance effectively. The tool also integrates several powerful troubleshooting features, such as Ping, Traceroute, and SSH, enabling quick resolution of connectivity issues. Its continuous monitoring capabilities, including WAN and cloud platform connection tests, ensure optimal network performance and minimal downtime. The user-friendly interface and customizable alerts make it suitable for both small and large-scale enterprises.
OS: Windows Server, Linux, AWS, and Azure
2. Paessler PRTG Network Monitor

Paessler PRTG Network Monitor simplifies network management with its automatic device discovery and documentation system. It automatically detects network devices and maps out their topology, making it easier for administrators to monitor network performance. The topology mapping feature visualizes device relationships, which helps in troubleshooting and identifying bottlenecks quickly.
Key Features:
- Comprehensive Monitoring: PRTG provides complete network visibility by monitoring all types of devices, including servers, routers, switches, and more.
- Network Discovery: Automatically discovers and documents all network devices.
- Customizable Dashboards: The tool features customizable dashboards and reports, giving users the flexibility to tailor their monitoring views.
- Sensor-Based Monitoring: With over 250 predefined sensors, PRTG offers extensive monitoring for everything from SNMP devices to applications.
Why do we recommend it?
We recommend Paessler PRTG for its comprehensive monitoring capabilities, easy device discovery, and customizable features that enhance network visibility and optimize performance for organizations of all sizes. The package is very flexible, allowing buyers to decide which of the tools in the bundle to activate. You only pay for the sensors that you use.
I noted that Paessler PRTG implements continuous monitoring with SNMP support, WAN monitoring, and cloud connection tests. The tool enables efficient network diagnostics by tracking network health and providing real-time alerts on critical issues. Additionally, PRTG offers a set of troubleshooting tools, including Ping, Traceroute, and DNS lookups, helping network admins resolve problems quickly and accurately.
Who is it recommended for?
PRTG is ideal for IT professionals, network administrators, and organizations of various sizes seeking an all-in-one, scalable network monitoring solution with a focus on visibility, troubleshooting, and cloud integration. Small businesses can use PRTG free forever if they only activate 100 sensors.
Pros:
- User-Friendly Interface: Intuitive and easy-to-navigate interface, suitable for both beginners and advanced users.
- Scalability: Can scale to monitor large and complex network infrastructures with ease.
- Full-Stack Observability: The package also provides options for server and application monitoring.
- Cloud Integration: Directly accesses cloud platforms such as AWS and Azure for statistics extraction.
Cons:
- Pricing Structure: The sensor-based pricing model may become expensive for very large networks with numerous devices.
Paessler PRTG is compatible with Windows Server – there is also a cloud-hosted SaaS option. Buyers can access a 30-day free trial to assess the package before buying.
3. Datadog Network Device Monitoring
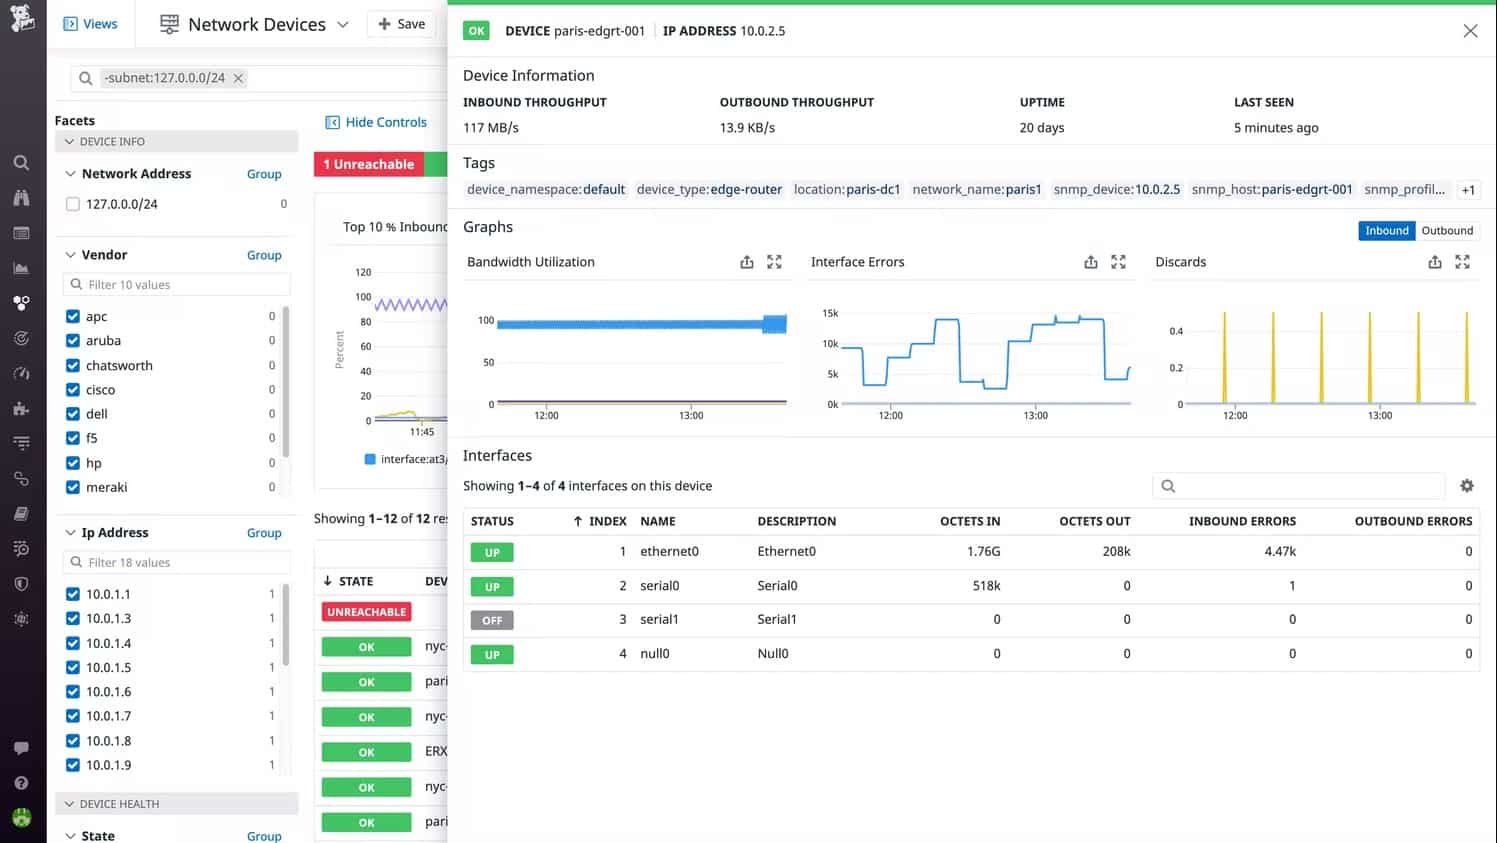
Datadog Network Device Monitoring (NDM) builds on the platform’s discovery system to automatically detect network devices, including routers, switches, and firewalls. It offers device documentation and visual topology mapping, allowing users to track connections, relationships, and performance across the network. This automatic documentation simplifies network management and aids in efficient troubleshooting.
Key Features:
- Real-time Network Visibility: Datadog provides a detailed, real-time view of your network infrastructure, making it easier to track and manage devices.
- Cloud Integration: Integrates with cloud services such as AWS, Azure, and Google Cloud, enabling monitoring of hybrid network environments.
- Comprehensive Alerting System: Notifies network administrators about potential performance issues or security threats, minimizing downtime.
Why do we recommend it?
We recommend Datadog Network Device Monitoring for its deep visibility into network devices, strong integration with cloud platforms, and real-time performance monitoring, which helps IT teams efficiently manage and troubleshoot complex networks.
I learned that Datadog provides SNMP-based network device health checks. As the tool is cloud-based, it will monitor any network anywhere – as long as you give it access credentials. Thus, it is able to monitor multiple sites and the connections between them, making it a WAN monitoring system as well. The package also offers powerful troubleshooting tools, such as network flow analysis and performance diagnostics, to quickly resolve issues.
Who is it recommended for?
Datadog is best suited for large enterprises, cloud-native businesses, and IT teams looking for comprehensive, scalable network monitoring solutions that provide deep insights into performance, availability, and security.
Pros:
- Unified Dashboard: A single, customizable dashboard for viewing network health and performance metrics across multiple devices.
- Scalable Architecture: Coverage for multiple networks can be operated from a single dashboard.
- Advanced Analytics: Advanced network analytics to identify trends, optimize performance, and predict potential issues.
Cons:
- No On-Premises Option: Datadog is only available as a cloud-based SaaS platform.
Datadog is a cloud-based platform and does not require local installation, making it accessible from any device with internet access. The platform offers a 14-day free trial, giving users full access to its features to evaluate its suitability for their network observability needs.
4. Cisco ThousandEyes
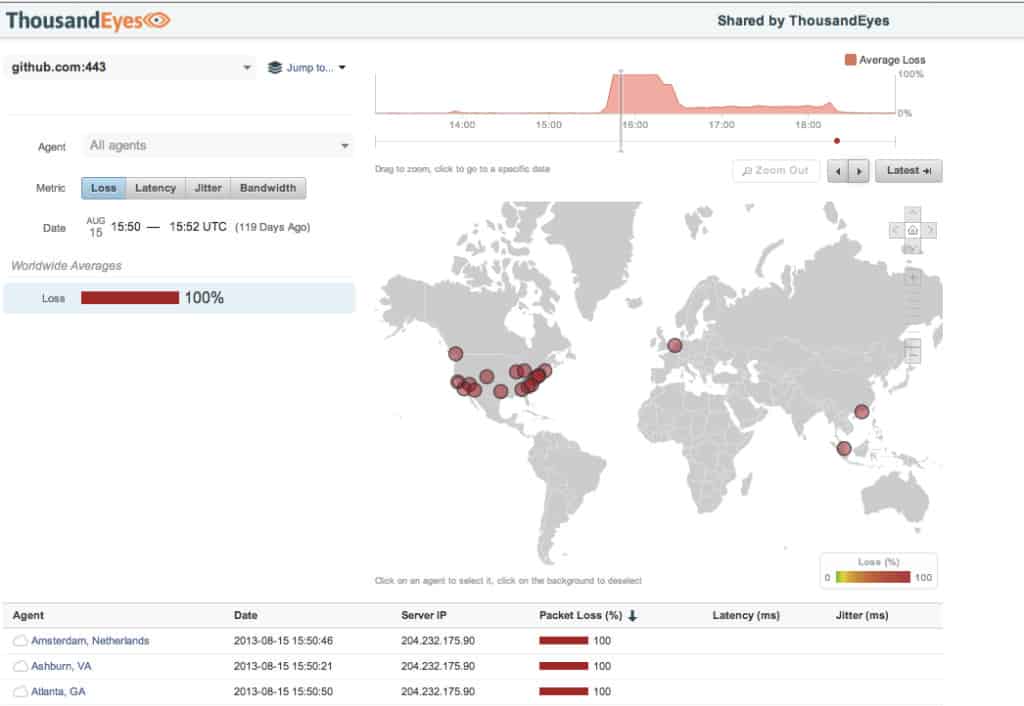
Cisco ThousandEyes offers a powerful discovery system that automatically detects network devices such as routers, switches, and cloud resources. The platform includes detailed topology mapping, allowing administrators to visualize connections and dependencies across the network. This functionality is vital for understanding the full scope of your infrastructure and streamlining troubleshooting.
Key Features:
- Global Visibility: Monitors network performance from various geographic locations, offering insights into user experience.
- Cloud and Internet Monitoring: Watches cloud services and external internet connectivity, ensuring optimal performance across multi-cloud environments.
- Root Cause Analysis: Detailed insights into performance bottlenecks, allowing network teams to identify and address the root cause of network disruptions.
Why do we recommend it?
We recommend Cisco ThousandEyes for its exceptional ability to monitor end-to-end network performance, from local networks to the cloud, and its advanced troubleshooting capabilities that help identify and resolve issues rapidly, enhancing overall network reliability and user experience.
I discovered that like the other tools on this list, Cisco ThousandEyes deploys SNMP, which is already installed on network devices, to implement device monitoring. You can also use this package for WAN monitoring. The platform’s real-time diagnostic tools provide in-depth insight into network issues, offering actionable recommendations to quickly resolve performance degradation or outages. It’s ideal for proactive management of network health.
Who is it recommended for?
Cisco ThousandEyes is recommended for enterprises that require end-to-end visibility into their hybrid or multi-cloud networks. It is particularly suited for organizations that depend on cloud services and need to ensure seamless application and network performance.
Pros:
- Comprehensive Monitoring: Network observability across the entire stack, from the data center to the cloud, and end-user experience.
- Proactive Alerts: Real-time alerts based on custom thresholds, allowing teams to address issues before they impact users.
- Detailed Reports: Performance and diagnostic reports to guide network optimization and troubleshooting.
Cons:
- Costly for Smaller Teams: More suitable for large enterprises or organizations with advanced network monitoring needs.
Cisco ThousandEyes is a cloud-based solution, requiring no local installation. It is accessible through any device with an internet connection. ThousandEyes offers a 15-day free trial, providing full access to its platform, to allow teams to evaluate its capabilities before committing to a subscription.
5. New Relic

New Relic provides automatic network discovery and a device documentation system. It automatically detects and maps network devices, including switches, routers, and cloud resources. The platform gives network admins a clear visual representation of network connections and dependencies. This helps teams streamline troubleshooting by understanding how devices are interrelated and their impact on overall network performance.
Key Features:
- End-to-End Observability: Full-stack observability, allowing visibility into network performance, server health, application performance, and user experience.
- Real-Time Analytics: Detects anomalies, measures application response times, and optimizes infrastructure before problems escalate.
- Integrated Cloud Monitoring: Extracts activity data from cloud services like AWS, Azure, and GCP, making it ideal for hybrid cloud infrastructures.
Why do we recommend it?
We recommend New Relic for its comprehensive, end-to-end observability platform that allows IT teams to monitor the health of their networks, applications, and cloud services, providing actionable insights for improving performance, reliability, and user experience across the network.
I observed that New Relic’s full platform extends beyond network observability, offering integrated solutions for application monitoring, infrastructure monitoring, and real-time analytics. The platform collects and analyzes data from every layer of your technology stack, offering a unified dashboard and troubleshooting tools that promote proactive management and continuous optimization.
Who is it recommended for?
New Relic is recommended for organizations that require unified observability across their network, applications, and cloud services. It is ideal for businesses managing complex, hybrid, or multi-cloud environments, and those looking to improve system performance while maintaining high uptime.
Pros:
- Unified Dashboard: A single console for network, application, and infrastructure performance.
- Real-Time Alerts: Customizable alerts notify users of network or application performance issues in real-time, facilitating quick responses.
- Easy Integration: Integrates with a wide range of third-party tools and services, including AWS, Azure, and Google Cloud.
Cons:
- Learning Curve: May take some time to learn and configure effectively.
New Relic is a cloud-based observability platform, accessible from any device with an internet connection. It does not require installation on a specific operating system but can be accessed through browsers and mobile apps. New Relic offers 1 GB of data throughput for free for those who want to test the platform.
6. Nagios XI
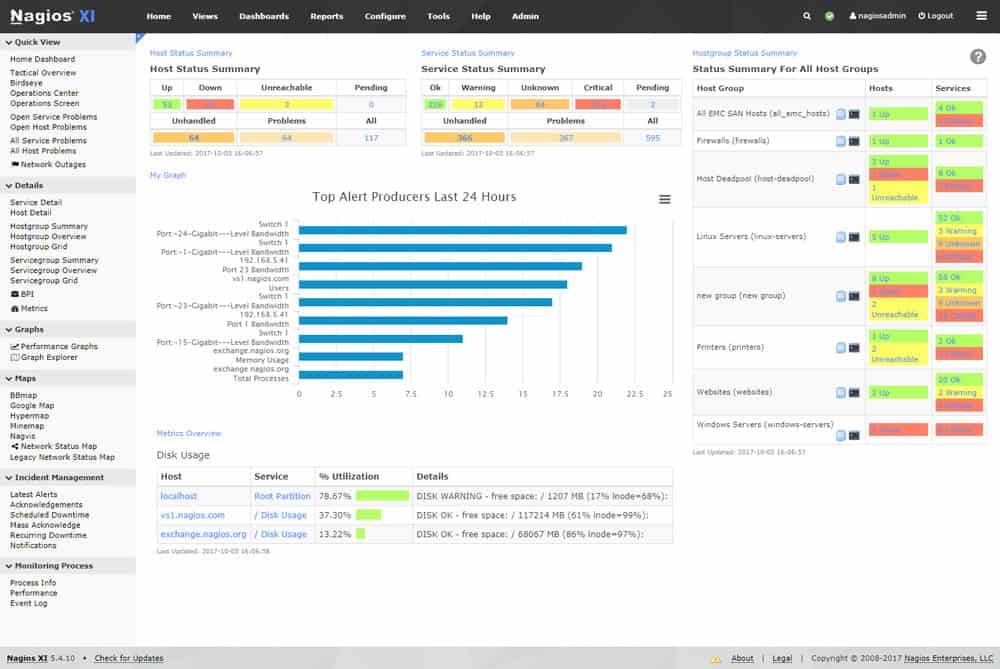
Nagios XI offers a discovery and device documentation system that automatically detects network devices, such as routers, switches, and servers. The tool offers comprehensive topology mapping, allowing network admins to visualize network relationships and dependencies. This insight helps streamline troubleshooting and ensures better monitoring across the entire network infrastructure.
Key Features:
- Advanced Alerting System: Highly customizable alerting system that sends notifications when specific network issues or performance degradation is detected.
- Comprehensive Dashboards: Allows users to get an overview of their entire network infrastructure and see performance data at a glance.
- Integration with Plugins: Nagios Exchange provides a library of extensions to monitor a wide range of devices, servers, and services.
Why do we recommend it?
We recommend Nagios XI for its powerful, customizable monitoring features, ease of use, and ability to integrate with various third-party tools and plugins. Its robust alerting and reporting features make it ideal for managing and troubleshooting complex network infrastructures.
Nagios Exchange is a community-driven repository of monitoring plugins. I noticed that this feature allows users to tailor their monitoring experience by integrating device-specific profiles, ensuring that diverse network devices and services are properly monitored. This flexibility greatly enhances the tool’s adaptability to different network environments.
Who is it recommended for?
Nagios XI is recommended for businesses and IT teams that require detailed and customizable network monitoring. It is ideal for network administrators and IT professionals managing large or complex networks with a need for granular control over monitoring, alerting, and reporting.
Pros:
- Customizable Monitoring: Flexible monitoring configurations to suit specific network environments.
- Scalability: A modular architecture that scales well to accommodate growing networks and increasing monitoring needs.
- Full-Stack Observability: Monitors servers and applications as well as networks.
Cons:
- Excludes Traffic Analysis: Traffic flow features are specifically excluded and require a separate purchase.
Nagios XI is available for Linux-based operating systems, with support for CentOS, Red Hat, and Ubuntu distributions. It is also available for Windows via a virtual machine (VM). Nagios XI offers a 30-day free trial.
7. Zabbix
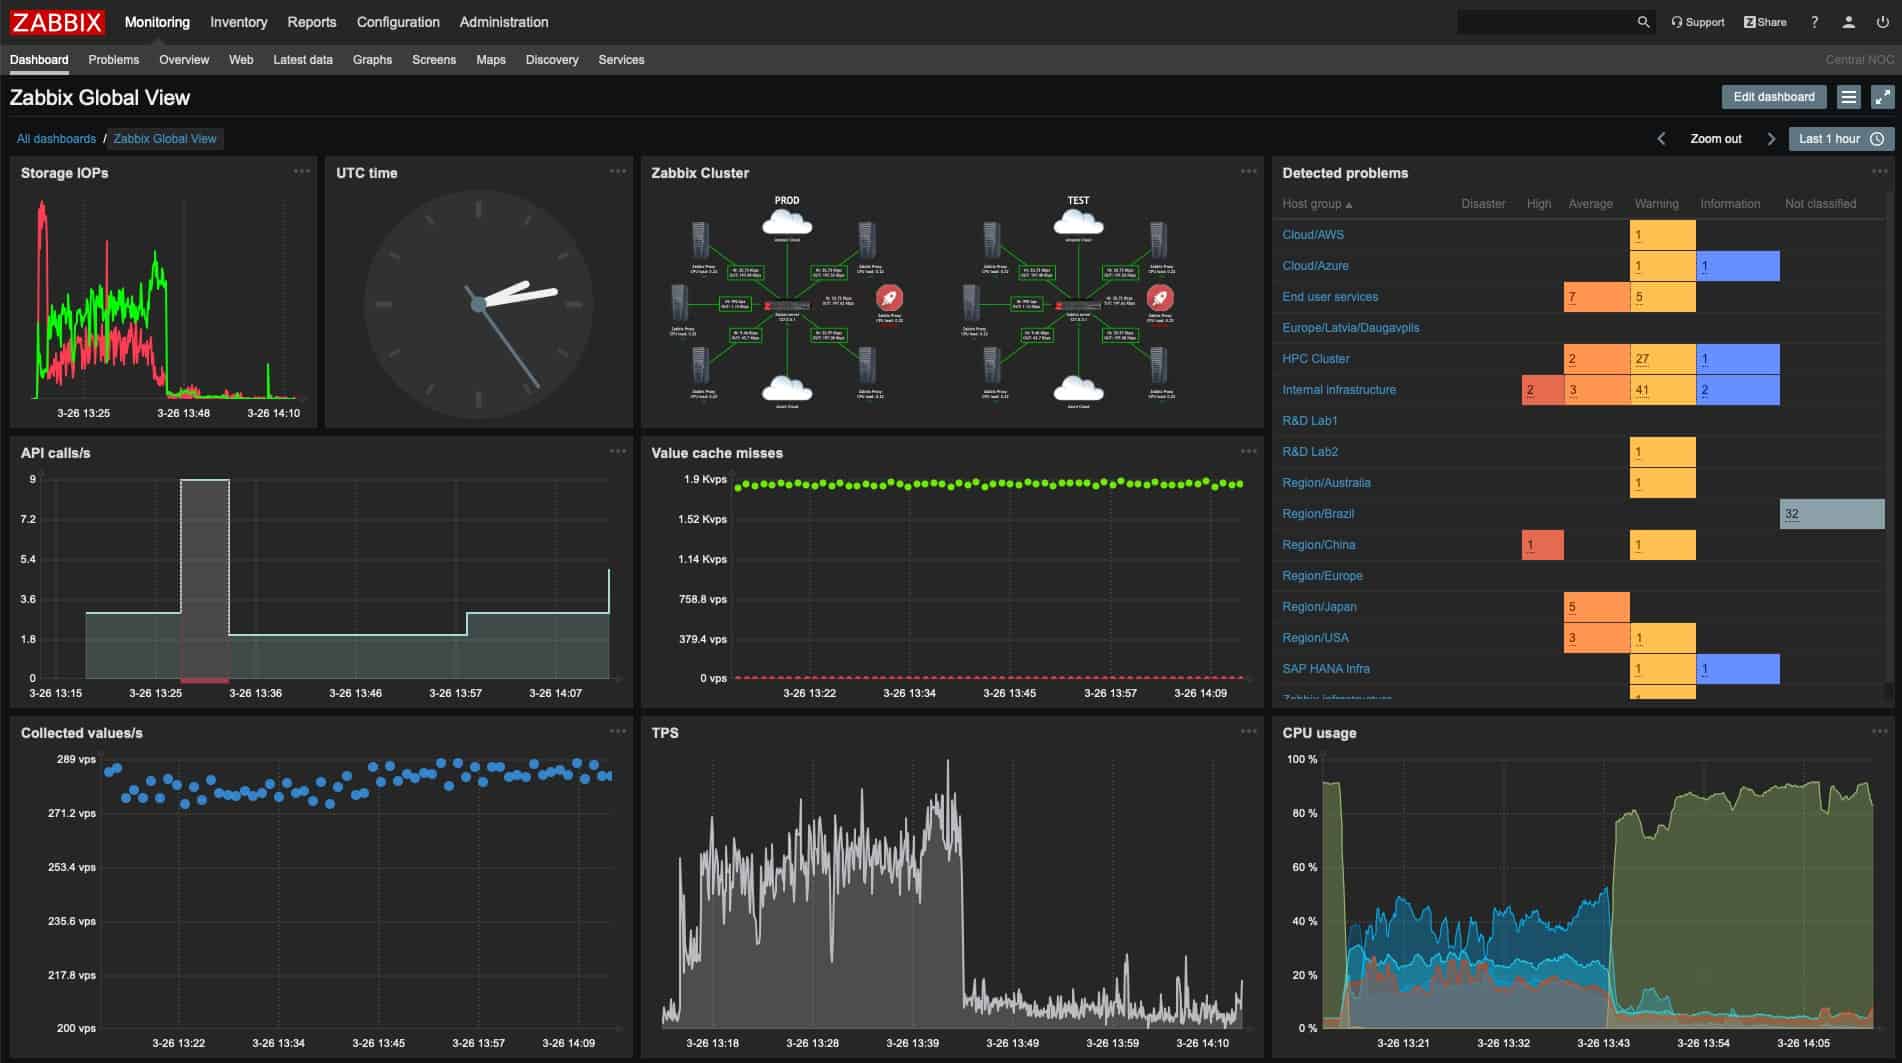
Zabbix provides an automated discovery system that scans network devices, servers, and applications to identify assets within the infrastructure. Its topology mapping feature allows users to visualize the network architecture, highlighting dependencies between devices. This capability simplifies device management, troubleshooting, and performance monitoring, improving network visibility.
Key Features:
- Real-time Monitoring: Collecting and displaying data from devices and applications with minimal delays.
- Highly Customizable Alerts: Allows users to set up complex alerting rules based on network performance metrics, ensuring prompt notifications for critical issues.
- Powerful Data Visualization: Charting and graphing options for in-depth data visualization.
Why do we recommend it?
We recommend Zabbix for its open-source nature, robust monitoring capabilities, and extensive customization options. The tool is highly scalable, supports a wide array of integrations, and offers real-time insights, making it ideal for complex network environments.
I found that Zabbix provides full-stack observability by supporting a wide variety of network devices, applications, and services. It includes a comprehensive system of plugins, templates, and integrations, enabling users to tailor monitoring configurations for various use cases. These tools ensure automated monitoring of the entire network stack, from network devices to applications.
Who is it recommended for?
Zabbix is recommended for network administrators and IT teams that need a highly customizable, open-source monitoring tool. It is well-suited for enterprises and service providers managing large, complex networks that require detailed visibility and flexible configuration options.
Pros:
- Comprehensive Coverage: Monitors a wide range of devices and services, providing complete visibility into the entire IT infrastructure.
- Open Source: Cost-effective and customizable to fit specific needs.
- Scalability: Suitable for both small businesses and large enterprise networks.
Cons:
- Complex Setup: Requires a considerable amount of time and expertise for initial setup and configuration.
Zabbix is written for Linux, but businesses with Windows could run it over containers or in a VM. It is available as an open-source tool with a free on-premises version, which offers full functionality. Additionally, Zabbix now offers a cloud-based hosted version with several editions to cater to different user needs, ranging from small teams to large enterprises. Zabbix Cloud is available for a 5-day free trial.
How network observability tools are changing the game
Network observability software has evolved significantly in recent years, and the most advanced tools on the market today provide end-to-end visibility into network performance, health, and user experience. From tools like Paessler PRTG and Datadog to ManageEngine and ThousandEyes, network administrators now have access to software that not only detects and mitigates network issues but also predicts problems before they affect users.
The ability to leverage AI and machine learning is transforming the network observability sector making them even more powerful.. As networks continue to grow in complexity, network observability tools will play an essential role in ensuring that organizations can remain agile and responsive in the face of evolving network demands.

