MRTG is a free network monitoring tool produced by Tobi Oetiker. This software requires Perl to be pre-installed and it runs on Windows, Unix, Linux, and macOS. Although the tool is very useful, it was first created in 1994 and its interface is a little dated.
Here is our list of the best MRTG alternatives:
- Atera EDITOR’S CHOICE A modern alternative to MRTG, offering advanced network monitoring, real-time alerts, customizable dashboards, and comprehensive performance analytics in a user-friendly, all-in-one platform for efficient IT management. Get a 30-day free trial.
- Paessler PRTG (FREE TRIAL) A three-in-one monitoring system that includes SNMP monitoring with some great network plotting tools. It runs on Windows Server. Start a 30-day free trial.
- ManageEngine OpManager A leading network monitoring system that has data visualizations and analytical features as well as live data scanning. It installs on Windows Server and Linux.
- Datadog Network Performance Monitoring A cloud-based system monitoring tool that includes SNMP procedures and system security options.
- SolarWinds Network Performance Monitor An SNMP-based network monitor that tracks network device health and includes diagnostics tools. It runs on Windows Server.
- Zabbix An attractive, free infrastructure monitor that receives SNMP messages to check on device statuses. It runs on Linux, Unix, and macOS.
Looking further into MRTG, it is possible to find out exactly how the system works. With this information, it is possible to find other network monitors that work in exactly the same way and have better features and more sophisticated graphics.
All about MRTG
MRTG is a network monitor. It also gives information on network device statuses, such as toner level for printers or processing capacity for switches. MRTG shows a graph of network traffic over time.
The MRTG data gathering system stores each network performance snapshot in log files to enable it to assemble its graphs. The data retention period for these logs is two years. However, data gets compressed and summarized over time, with more detail available for newer records than for past periods. The user can ask for a data transfer rate graph for seven days, five weeks, a year, or two years.
The graphs that MRTG produces are embedded into a web page format and they can be viewed with any standard web browser. These views are not updated live but are generated on-demand or on a schedule.
MRTG data sources
The data for the graphs that MRTG creates come from reports sent to the software over the network with the Simple Network Management Protocol (SNMP) procedures. All network devices are shipped with SNMP capabilities. Each device has a program running on it, which is called the SNMP Agent.
The SNMP system requires the existence of an SNMP Manager. MRTG provides this function. The manager broadcasts a request for reports and when each agent receives this request, it sends back a response with a table full of data on all of the statuses of the device that it runs on.
The SNMP specification lays down the format for this response, with a code for each data field. MRTG dereferences these codes, extracting the related values that it needs for its graph, and then stores an aggregated record of network activity at that moment. Each request/response cycle provides another data point on the graph.
In this guide, we look at monitoring tools that offer network traffic graphs the same as MRTG, but also show live data and include alerts.
The best MRTG alternatives
To compile this list, we focused on network monitoring tools that use SNMP and generate great graphs. Unlike MRTG, these tools give constantly updated live data throughput graphs.
Although most of the tools in this list are not free like MRTG, they are well worth the money and you can compare the paid tools to free options by taking out the free trial that they offer.
Our methodology for selecting an MRTG alternative
We reviewed the market for Multi Router Traffic Grapher alternatives and analyzed tools based on the following criteria:
- A network device discovery routine
- A network mapper
- An SNMP-based device monitor
- Time-series performance graphs
- Alerts for discovered device problems
- A free trial or a demo option that lets you test the system before buying
- Value for money from a competent network monitor that is offered at a fair price
With these selection criteria in mind, we looked for network performance monitors that use SNMP to discover network devices, map the network, and perform continuous monitoring.
1. Atera (FREE TRIAL)
Atera is a cloud-based service that caters to Managed Service Providers (MSPs). The tool bundles together all of the software that an MSP would need and provides it with all supporting resources. So, it could be used by a business that operates a virtual office, with remote, independent support technicians logging into the service from their own bases.
Key Features:
- Good for Managed Service Providers: Also provides versions for IT departments
- Patch Management: Automates software updates and patches to ensure network devices are secure and up-to-date.
- SNMP-Based Monitoring: Runs continuously
- Bandwidth Monitoring: Tracks bandwidth usage to prevent bottlenecks and optimize resource allocation.
- Processes Traps into Alerts: Displays a list of problems in the console
Why do we recommend it?
Atera is a cloud-based remote monitoring and management service. The system includes a network discovery option. However, this is a paid extra for all but the top plan. The service continuously monitors endpoints and network devices to check for statuses and will raise an alert if there is a problem.
Among the many utilities of the Atera system, network device monitoring uses SNMP to provide constant health checks and create a network inventory. The service also provides alerts based on SNMP traps. One missing element of this service is that it doesn’t include a network topology mapper.
Who is it recommended for?
This system is available in a version for managed service providers and another for IT departments. Each version is offered in four plans that all include a Help Desk ticketing system and automated monitoring services. The console will generate activity graphs but it doesn’t provide a network topology map.
Pros:
- Lightweight Cloud-Based Tool: Access the console from anywhere through a web browser
- Customizable Dashboards: Allows users to tailor views for specific DNS metrics and reports.
- Priced per Technician: Makes the platform accessible to any size of technician support team
- Can Support Multiple Networks Simultaneously: Centralizes network monitoring
- Historical Reporting: Provides detailed logs and reports for auditing and performance analysis over time.
Cons:
- Network Discovery Not in the Core Package: This is a paid extra
The Atera system integrates a help ticketing system and it is charged for by subscription per technician per month. This is a great bundle for someone who wants to start out as an independent support technician because one technician license gets all of the utilities that the big corporations pay a lot of money for. Users can expand easily by just adding on another technician subscription. Atera is available for a 30-day free trial.
EDITOR'S CHOICE
Atera is our top pick for a Multi-Router Traffic Grapher (MRTG) alternative because it offers a more modern, user-friendly, and feature-rich solution for network monitoring and management. While MRTG is a reliable tool for graphing network traffic, it lacks the comprehensive functionality and ease of use that Atera provides. This cloud-hosted platform’s real-time network monitoring capabilities go beyond simple traffic graphing, offering detailed insights into device performance, bandwidth usage, and overall network health. Its automated alert system ensures that IT professionals are immediately notified of any anomalies or issues, enabling proactive troubleshooting and minimizing downtime. Atera’s customizable dashboards provide a clear and actionable overview of network metrics, making it easier to identify trends and optimize performance. Unlike MRTG, which requires manual configuration and lacks centralized management, Atera offers a unified platform for monitoring and managing entire networks, simplifying IT operations. Atera supports SNMP monitoring, remote troubleshooting, and integration with other IT management tools, enhancing its versatility and efficiency.
Download: Start a 30-day FREE Trial
Official Site: https://www.atera.com/signup/
OS: Cloud-based
2. Paessler PRTG (FREE TRIAL)
Paessler is named after its founder, Dirk Paessler, a systems programmer who started developing his own commercial tools. PRTG was developed after Paessler got frustrated by the complexities of installing MRTG. He created PRTG with a similar name but with completely different operating procedures to provide something better.
Key Features:
- Inspired by MRTG: The similarity of the name is not a coincidence
- Autodiscovery and Topology Mapping: The core function of the package
- SNMP Data Gathering: Provides live status reports
- Detection of Hardware Changes: Includes endpoints in reporting
Why do we recommend it?
Paessler PRTG was inspired by MRTG and the creator of this newer tool succeeded in making a better monitoring package. This system has evolved over the years to include a very large bundle of monitoring tools that cover networks, applications, and servers. It is also able to monitor cloud platforms.
An SNMP-based data grapher that is still at the core of PRTG was the original service that he created to compete with MRTG.
Who is it recommended for?
PRTG is similar to the Network Performance Monitor because it will discover all network devices, document them, and then create a network topology map. The console for this system provides charts and graphs and it includes automated, alert-based monitoring routines. A Free edition with 100 sensors will appeal to small businesses.
Pros:
- A Package of Monitoring Tools: Networks, applications, and infrastructure monitoring
- Customizable Dashboard: Create role-based consoles
- A Wide Range of Alert Integrations: These are simple to set up
- Free Edition: If you only active 100 sensors, you never have to pay
Cons:
- No Version for Linux: Run it on Windows Server or sign up for the SaaS version
PRTG is a collection of monitors that cover networks, servers, and applications. The buyer decides which monitors to turn on. The monitors are called sensors and the price of the package goes on the number of sensors that the buyer wants to use. The service is forever free for up to 100 sensors. The software installs on Windows Server and there is a 30-day free trial of PRTG with all sensors activated.
3. ManageEngine OpManager
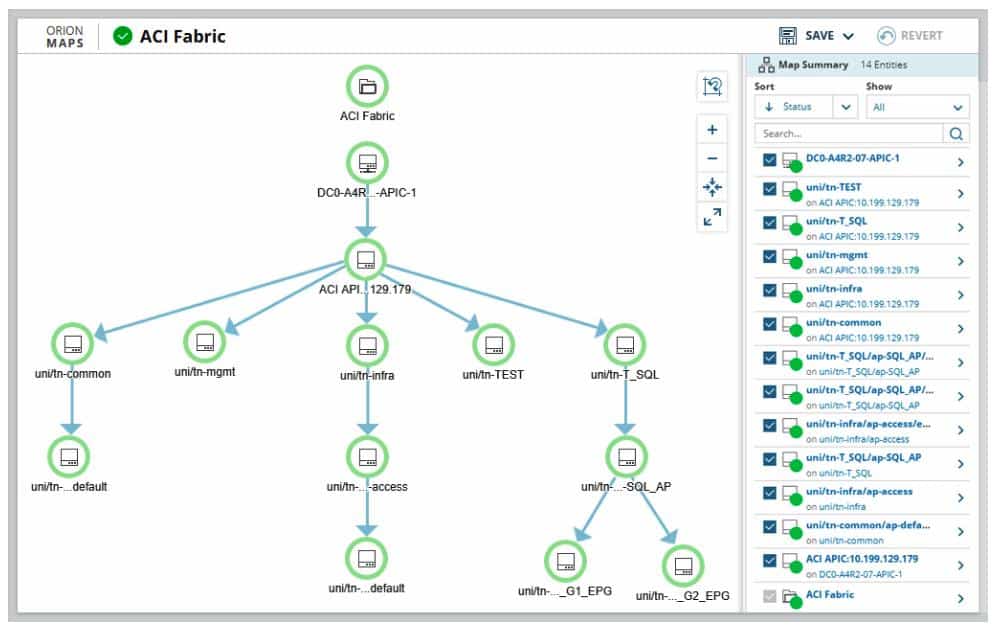
ManageEngine is a close competitor of SolarWinds and Paessler and the three companies always fill the top three in everyone’s estimation of the best network monitoring tools. OpManager is the ManageEngine SNMP-based network device monitor. The service includes an autodiscovery function that also produces live maps of the network. The user can select from a range of map layouts and details, which are all available with live data. Problems are highlighted with alerts.
Key Features:
- Monitors Networks and Servers: Focuses on device resource availability
- SNMP Tracking: Automated reporting
- Live Performance Graphs: Also creates a network map
Why do we recommend it?
ManageEngine OpManager rivals SolarWinds Network Performance Monitor and PRTG. This system also monitors servers and it generates live charts and graphs of all equipment activity and statuses. The system discovers, documents, and maps networks, offering a range of plan formats. The package can be enhanced by a companion module to record network traffic patterns.
OpManager has an attractive dashboard, which includes a summary of the entire network. Each record provides a link through to a details screen and all screens include color-coded graphs and charts.
Who is it recommended for?
This package is suitable for use by any business. There is a basic Free edition that only covers three devices. The Standard package is reasonably priced and suitable for small businesses. The software for OpManager runs on Windows Server and Linux. It is also offered as a service on AWS and Azure Marketplaces.
Pros:
- Suitable for All Sizes of Networks: Can monitor up to 10,000 devices
- Supports WAN Management: In the top edition
- Automatic Network Discovery: Generates a hardware inventory
Cons:
- Doesn’t Check on Device Configurations: Network configuration management is a separate product
The software for OpManager is available for Windows Server and Linux. It is available for a 30-day free trial. There is a free edition that will monitor just three devices.
4. Datadog Network Performance Monitoring
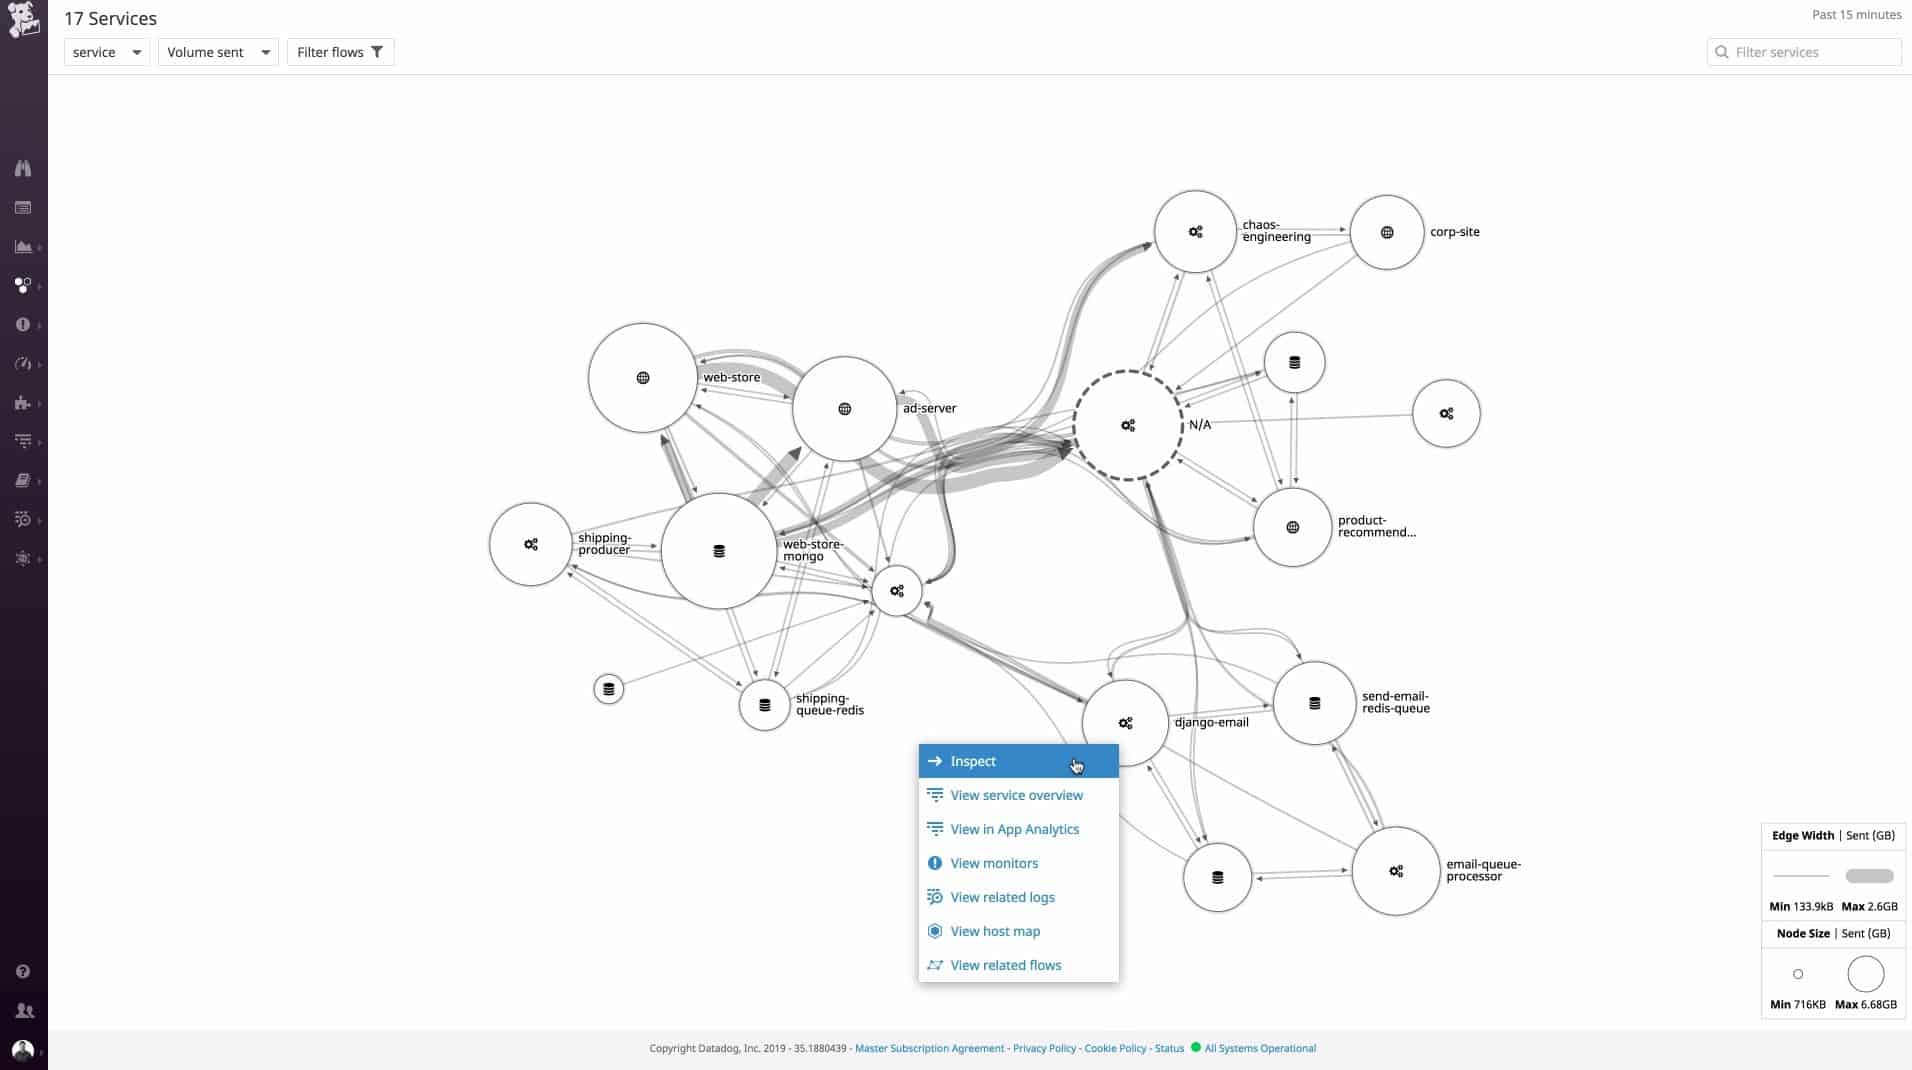
Datadog is a SaaS platform that offers many monitoring and system management modules. One of those packages is the Network Performance Monitoring service. This tool provides network device discovery, topology mapping, and traffic monitoring. The tool is able to gather information from a network through the installation of an agent onto a server connected to the LAN.
Key Features:
- Network Mapping: Requires the Datadog Infrastructure module
- Can Include Internet Links: Connection testing
- Live Traffic Monitoring: Uses flow protocols
Why do we recommend it?
Datadog Network Performance Monitoring is a SaaS package that provides traffic monitoring. Datadog also offers a Network Device Monitoring package. With these tools together, you will get network discovery, documentation, mapping, and traffic analysis plus live device status monitoring. Add on the Infrastructure Monitoring package for full stack monitoring.
Unlike most monitoring system providers, Datadog splits network device discovery and topology mapping from SNMP device health monitoring – that second part is provided by the Network Device Monitoring service.
From its cloud base, the Network Performance Monitoring service is able to unify the monitoring of networks on multiple sites and the internet links that connect them. It can also track the performance of internet connections to the cloud services that the business uses.
Who is it recommended for?
This tool is suitable for any business. The system is hosted on the cloud, so you don’t need to install and maintain the software for it. You do need to download an agent on your network, which is a guided process within the console. You access the dashboard through any standard web browser.
Pros:
- Adjustable Network Maps: Choose your preferred format
- Data on the Network Map: Traffic volumes written onto each link
- Alerts for Capacity Issues: Arise before they become critical
Cons:
- Device Health Monitoring is not Included: That function is in a package called the Network Device Monitoring module
Datadog Network Performance Monitoring is a subscription service with a rate per device per month. You can choose to pay for the service annually to get a lower rate. You can access Datadog Network Performance Monitoring on a 14-day free trial.
5. SolarWinds Network Performance Monitor

SolarWinds is the leading IT infrastructure monitoring system provider and its core product is the Network Performance Monitor. This system is based around SNMP. The benefits of this tool include an autodiscovery function that detects all devices connected to the network and logs them, including attributes such as make and model, addresses, and capacity. The inventory is updated constantly and it provides the source for an automatically drawn network topology map.
Key Features:
- Continuous Device Status Reporting: SNMP-based procedures
- Network Discovery: Creates a network inventory and map
- Handles Trap Messages: Device component problem issues from SNMP device agents
Why do we recommend it?
SolarWinds Network Performance Monitor is an on-premises package that discovers all of the devices on a network, creates a network inventory, and then generates a topology map. The tool will continuously monitor network device statuses and during that polling process will identify layout changes and adjust the map accordingly.
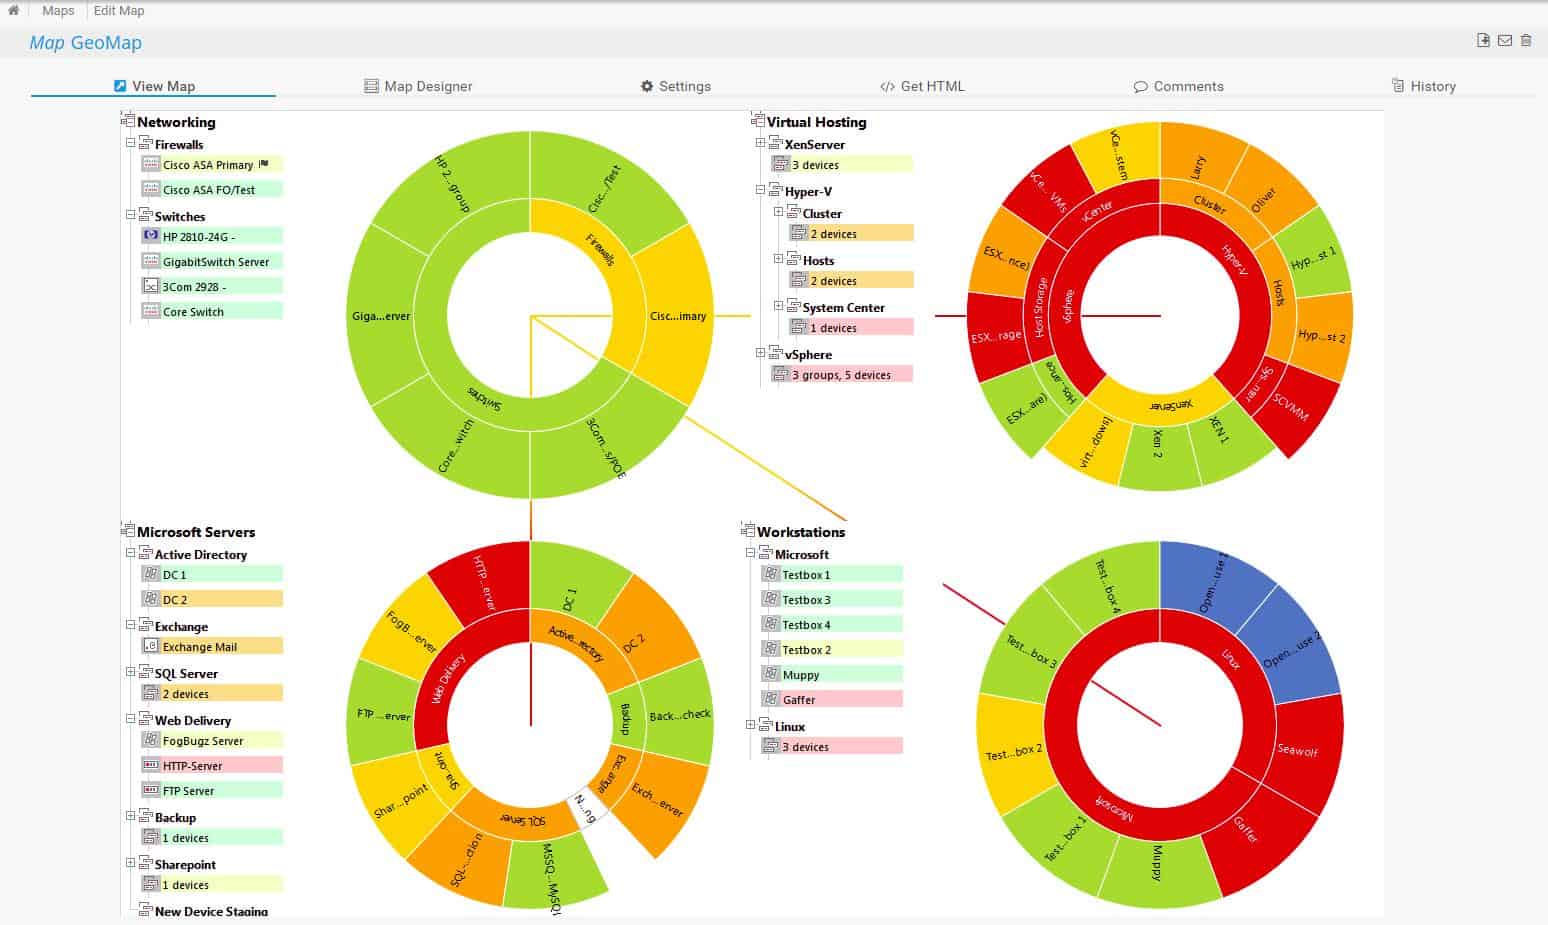
The dashboard for the service shows the overall health of each device with color-coded statuses for instant issue recognition. Other features include an alerting mechanism that enables IT staff to leave the monitor to watch over the network, knowing that they will be informed of developing problems as soon as they arise.
Who is it recommended for?
This system is a good fit for large organizations. It is able to manage an extensive network and monitor it without human intervention. The package includes a series of performance thresholds that will raise alerts if they are crossed. This automated monitoring optimizes the productivity of a system support team.
Pros:
- Gathers Data on All Hardware Connected to the Network: Can include status reports from endpoints
- Alert Notification Forwarding: Send alerts to technicians by SMS or email
- Supports Both SNMP Monitoring as well as Packet Analysis: Provides more control over monitoring than similar tools
- Customizable Screens: Uses drag and drop widgets to customize the look and feel of the dashboard
- Robust Reporting System: Provides pre-configured compliance templates
Cons:
- No SaaS Option: Only available for installation on Windows Server
SolarWinds Network Performance Monitor installs on Windows Server and it is part of a suite of monitoring and management tools that are written on a common platform, called Orion. Although combining this tool with other modules brings greater capabilities, it can also be used as a standalone system. SolarWinds offers a 30-day free trial.
6. Zabbix
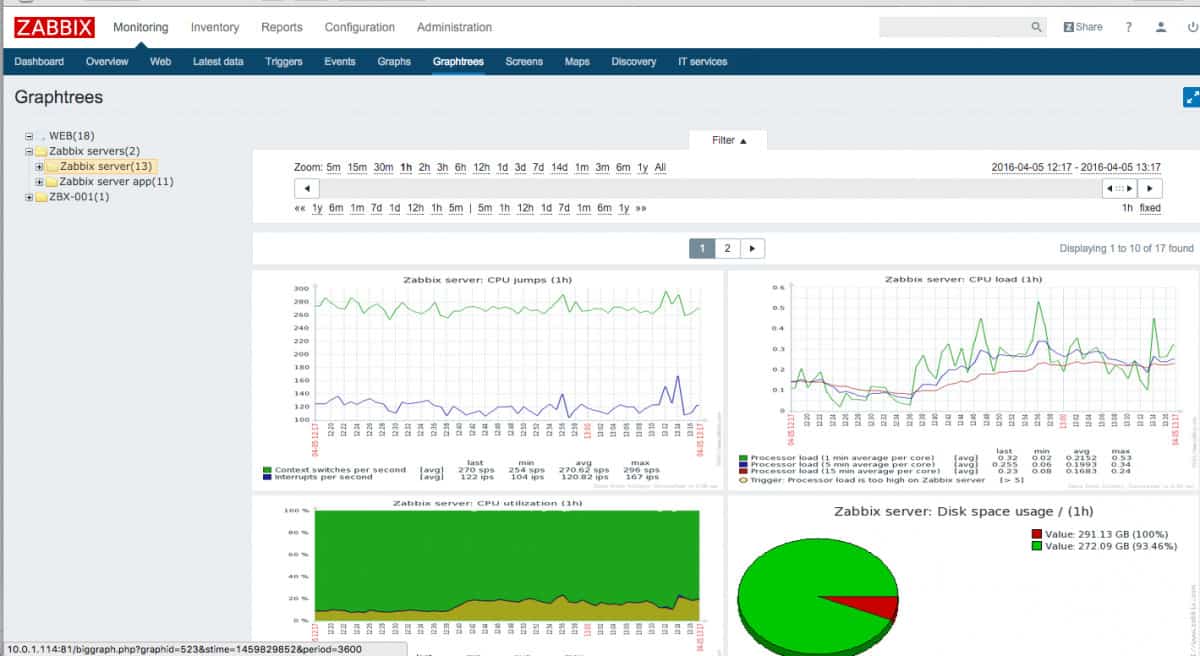
Zabbix is a free infrastructure monitoring system. The dashboard for the tool is very attractive, featuring a dark background and brightly-colored graphs. The Zabbix interface is much more graphical than all the other tools on this list, providing a graph or a chart for just about every tracked metric rather than lists of records.
Key Features:
- Free Monitoring Tool: Has a professional look and feel
- Device Discovery and Topology Mapping: Repeats continuously
- SNMP-Based Device Status Monitoring: Polls all hardware connected to the network
Why do we recommend it?
Zabbix is a free tool that provides network discovery. It generates both hardware and software inventories from its discoveries. The service continuously polls device agents for updates and any new devices get spotted and added to the inventories. Zabbix generates a network topology map from the data in the inventory.
Network monitoring is based on SNMP and the service includes alerts based on SNMP traps. Thanks to SNMP, Zabbix is also able to provide a device discovery service and the interface is able to create a network topology map, which can be presented in a range of formats.
Zabbix installs on Linux, Unix, or macOS. The system is able to monitor Windows devices, but they will need an agent installed on them. The dashboard module and the main processing engine of the service won’t install on Windows but it could be run on a VM over the Windows operating system.
Who is it recommended for?
This free system monitors networks, servers, and applications and it is completely free to use. This will appeal to small businesses and startups with tight budgets. Larger businesses that need a professional support package can get just that from the Zabbix team. The tool’s customer list includes some very large businesses.
Pros:
- Open-Source Transparent Tool: Long-established and reliable
- Uses Both SNMP and ICMP for a Broader Monitoring Range: Spots rogue devices
- Alert Notifications: Can be sent by SMS, email, custom script, and webhook
Cons:
- Professional Support isn’t Free: Access community guidance if you don’t want ot pay
Choosing an MRTG Alternative
MRTG is free, which is wonderful but sometimes it is better to pay for an improved service than put up with a less comprehensive option. There are many network performance monitors available that rely on SNMP and most of them show live data graphs, which are constantly updated.
Although stored data over time is good for performance analysis and capacity planning, systems that offer live data deliver immediate information on network performance while also creating the option to store metrics for analysis.
SNMP contains an emergency notification message format, which is sent by a device agent without waiting for a request. This is called a trap and live network monitors interpret these into alerts. A live network performance monitor with alerts enables the IT department’s technicians to leave the monitor to look after the network. As long as an alarm doesn’t appear, everything can be assumed to be working well.
Multi Router Traffic Grapher (MRTG) alternatives FAQs
What is the difference between PRTG and MRTG?
Dirk Paessler created PRTG to provide a better system monitor than MRTG, hence the similarity in the name. This private project eventually expanded into a commercial product to monitor networks, servers, and applications.
Is MRTG open source?
MRTG is not officially an open source project – it is the property of Tobi Oetiker. However, Oetiker distributes the software under the GNU General Public License, which permits others to alter the code for the system for their own private use.
What does MRTG mean?
MRTG stands for Multi Router Traffic Grapher. It is a tool that discovers a network and creates a map for it. The tool then watches the traffic load on each network link.


