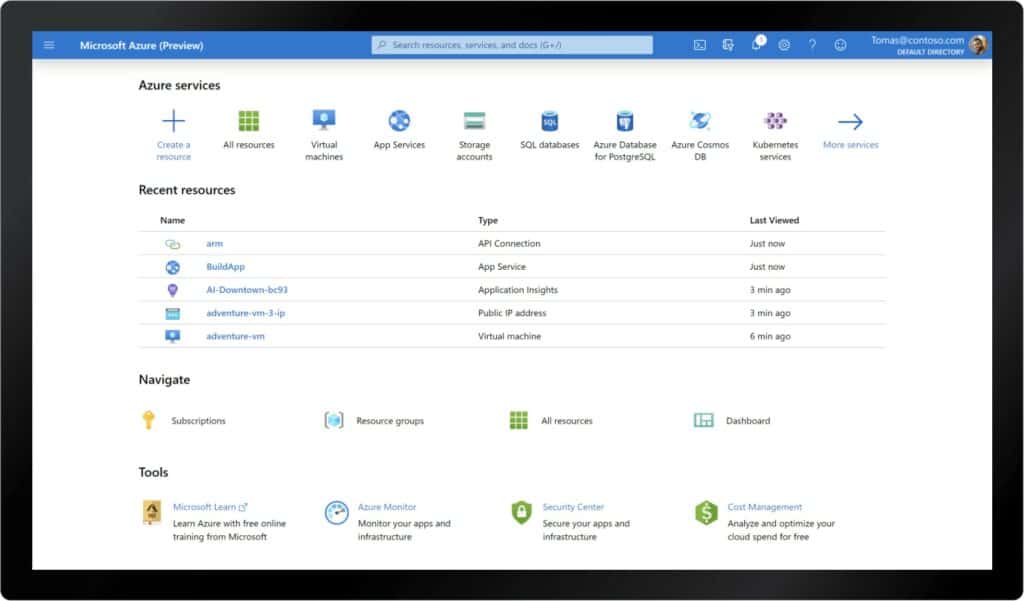
Microsoft Azure is one of the most widely-used cloud services on the market that many enterprises have used to move to the cloud. However, like any piece of infrastructure, Azure needs to be properly secured to decrease the chance of a data breach.
Here’s our list of the best Microsoft Azure monitoring tools:
- SolarWinds Server & Application Monitor (FREE TRIAL) Application monitoring software with Azure IaaS/PaaS monitoring, dashboards, autodiscovery, alerts, reports, and more.
- Datadog Cloud monitoring software with over 600 integrations, custom dashboards, machine-learning-powered alerts, full API access, and more.
- Dynatrace Application performance monitoring software with autodiscovery for Azure dependencies, Docker, and AWS containers, AI-driven alerts, and more.
- CrowdStrike Falcon for Azure A range of tailored solutions that provides threat detection and remediation for cloud platforms, and can integrate security monitoring across platforms. Accessed from the Falcon SaaS platform.
- AppDynamics Application performance management solution with autodiscovery for Azure, anomaly detection, custom dashboards, graphs, charts, and more.
- New Relic Microsoft Azure certified application performance monitoring software with dashboards, graphs, charts, alerts, anomaly detection, and more.
- LogicMonitor Infrastructure monitoring software with Azure integration, a customizable dashboard, threshold-based alerts, escalation chains, and more.
Secure Azure Step-by-Step
Keeping Microsoft Azure secure is all about knowing what controls you’re responsible for, and those your provider should control. Microsoft has a range of security measures including a security development cycle, mandatory security training, background checks, and physical security within data centers that your security measures should complement.
To get the most out of your Azure implementation, you should be familiar with the following security measures and best practices:
1. Become Familiar with The Shared Responsibility Model
The number one thing you need to address is understanding where Microsoft’’s security responsibilities as a provider begin and where yours as a customer begins. As a customer, you’re responsible for securing client endpoints, and accounts, and implementing controls such as access rights management.
On the other hand, Azure is responsible for maintaining and protecting the physical hosts, network, and datacenter your resources are hosted on. Other components like applications, network controls, operating systems, and identity, and directory infrastructure depend on the type of plan you’ve purchased.
Becoming familiar with the shared responsibility model is essential because it lets you know which segments of your infrastructure you need to monitor so you can cover all the bases. The shared responsibility model should be considered before completing a migration to Azure.
2. Implement the Recommendations Listed in Azure Security Center
Azure Security Center regularly monitors the state of your Azure resources and generates recommendations that you can use to help secure them. In the Recommendations tab, you can view a list of recommendations, which you can click on to view a description of each problem, which resources are affected, and steps you can follow to resolve the problem.
Implementing the recommendations listed in Azure Security Center helps you eliminate vulnerabilities. Following the guidance provided by the platform is a very easy way to tweak your settings and improve your overall security.
3. Limit the number of subscription owners
Every subscription owner or user with owner permissions represents a security risk if an account becomes compromised. The fewer people who have owner permissions the better. To lower your risk of exposure, limit the number of subscription owners to two or three, and no more.
4. Control Access with Temporary Permissions and Conditional Access
One great way to limit your exposure to threats is to grant temporary permissions to users with Azure AD Privileged Identity Management so they can perform privileged tasks. Users can complete their necessary tasks and then you can revoke access so there are no opportunities to exploit that access.
Another way to control access is to give conditional access to resources based on factors such as the device’s identity, network location, and assurance. You can restrict access through Azure AD Conditional Access, where you can configure automated access control decisions with trigger conditions.
5. Use Encryption
Microsoft Azure gives you the option to encrypt your data in transit and at rest. Encryption is essential for protecting your data from hackers. If your data is stored or transferred in an encrypted state, then a hacker can eavesdrop on the content, and steal your personal information.
With Azure disk encryption, you can protect Windows and Linux virtual machines with Windows BitLocker, and DM-Crypt to protect system disks. Using encryption adds an extra barrier of security that lowers the risk of a data breach.
6. Monitor Microsoft Azure
One of the challenges of moving to the cloud is that you don’t have physical access to the resources, so it can be difficult to identify when there’s a performance issue. To accurately measure performance, you need a cloud monitoring tool that’s compatible with Azure.
Monitoring Azure with a cloud monitoring platform helps you to track the performance of your resources and ensure they maintain high-quality performance. We’re going to look at some of the top tools for monitoring Microsoft Azure in the next section.
Our methodology for selecting a Microsoft Azure monitoring tool:
We reviewed the market for Microsoft Azure monitoring tools and analyzed them based on the following criteria:
- Proactive alerts
- Governance and auditing capabilities
- Integration with native tools
- Support for Azure resource dependency mapping
- Good customer support and assistance for troubleshooting
The best Microsoft Azure monitoring tools
Monitoring Microsoft Azure is essential for detecting application performance issues and dependencies. A reliable cloud monitoring tool will provide you with alerts when your service experiences performance difficulties so that you can start troubleshooting and addressing the problem. Monitoring Azure not only enables you to enhance the end-user experience but also allows you to verify your infrastructure stays safe against malicious entities.
1. SolarWinds Server & Application Monitor (FREE TRIAL)
SolarWinds Server & Application Monitor is an application monitoring solution you can use to monitor Azure applications. SolarWinds Server & Application Monitor provides Azure IaaS and PaaS monitoring so you can monitor virtual machines, Kubernetes, App Service, Event Hubs, and SQL databases through a single pane of glass. You can also monitor other Windows products such as Windows, Exchange, SQL Server, and Office 365.
Key Features:
- Contextual Overview and Insights: Monitor your Azure environment along with other infrastructure to obtain better context of a problem or issue. You can even get information on Azure’s region, configuration, and security. The results will be comprehensive and address many hard-to-find issues in your IT environment.
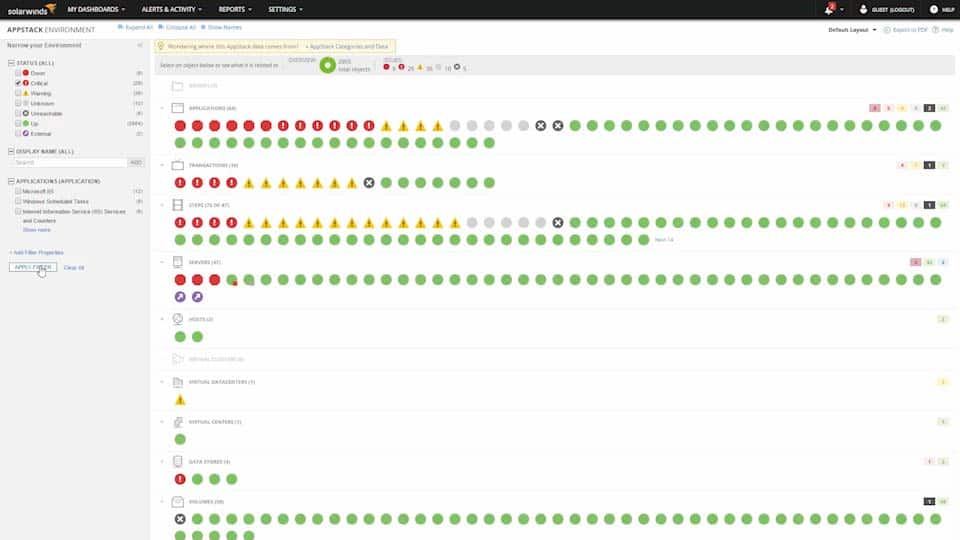
- Well-Designed Dashboard: Acts as a single pane to provide information and insights about your applications and infrastructure performance, regardless of their location. You can even correlate metrics on your dashboard to define baselines and measure deviations.
- Auto Discover VMs: Automatically discover newly-created VMs and containers, and monitor the communication between them. It can also map the communications, relationships, and dependencies between VMs and applications. All this information is displayed visually for better understanding.
Why do we recommend it?
SolarWinds Server & Application Monitor is an on-premises package, but it is able to monitor cloud platforms, including Azure. This monitoring tool can track the resources and performance of multiple platforms simultaneously, and that includes on-premises servers as well as cloud systems. The package will also track applications wherever they are hosted.
You can view performance data through the dashboard with the assistance of visualizations options like charts and graphs. SolarWinds Server & Application Monitor automatically discovers Azure virtual machines and containers so you don’t need to manually discover everything from scratch.
An alerts system notifies you about performance issues when they occur. Dynamic baselines define normal behavior so that the software can discover anomalous activity and alert you to take action. You can also create reports to share performance trends with the rest of your team.
Who is it recommended for?
This system is particularly good at monitoring a large number of applications, hosted on many different platforms simultaneously. This means that it is going to be most attractive for large organizations. Small businesses won’t need such large capacity and would be more likely to look for free and low-cost Azure monitoring systems.
Pros:
- Specifically offers Azure and cloud monitoring solutions out-of-the-box
- Some of the best alerting features that balance effectiveness with ease of use
- Supports both SNMP monitoring as well as packet analysis, giving you more control over monitoring than similar tools
- Uses drag and drop widgets to customize the look and feel of the dashboard
Cons:
- Designed for IT professionals, not the best option for non-technical users
SolarWinds Server & Application Monitor is a versatile application monitoring solution that is suitable for enterprises of all sizes. Prices start at $1,567 (£1,211). You can start the 30-day free trial.
EDITOR'S CHOICE
SolarWinds Server and Application Monitor is out editor’s choice because it is both simple to use, and at the same time, flexible and powerful with its advanced features. In particular, we love the infrastructure and application dependency mapping because it provides critical insights into server activity. Moreover, it can comprehensively track the performance of Azure monitors.
Download: Download a 30-Day Free Trial
Official Site: https://www.solarwinds.com/server-application-monitor
OS: Windows Server
2. Datadog
Datadog is a cloud monitoring tool that provides real-time monitoring for Microsoft Azure. With Datadog you can automatically discover and monitor Azure services such as CosmosDB, Service Bus, and AKS, and monitor performance through the dashboard. Dashboards are drag-and-drop so you can customize your point of view.
Key Features:
- Complete Observability: Offers complete visibility into every Azure layer including compute, networking, analytics, storage, and more. In-depth observability allows you to quickly detect and resolve issues before they impact a wider audience.
- Ease of Use: Collects and unifies data from complex environments, including 40+ Azure services through easy integrations. The agent can be deployed directly on Azure virtual machines to collect the required metrics.
- High Security: Seamlessly secure your Azure environment as it integrates into your production environment to provide threat detection, posture security, and application management. Moreover, you can use its 700+ integrations for security insights using out-of-the-box detection rules.
Why do we recommend it?
Datadog provides many modules and the Infrastructure Monitoring system is probably your best choice for Azure performance monitoring. Another option is the Serverless Monitoring module, which has an Azure edition. For security monitoring, you could look at the Cloud Security Management tools, which provide Cloud Security Posture Management (CSPM) and Cloud Workload Security (CWS). Another option is the Datadog Cloud SIEM.
Machine-learning-powered alerts automatically notify you about performance anomalies when they occur. The AI helps eliminate false positives by factoring in periodic spikes in activity. You can customize the alerts by setting thresholds for metrics about which the software will alert you.
There are over 500 different integrations included out of the box with Datadog for third-party vendors. However, if this isn’t enough, you can create your own with an API. Full API access allows you to capture events and metrics from external applications, helping the software to fit within your existing operations more easily.
Who is it recommended for?
The exact modules that will appeal to each company depend on how that buyer uses its Azure services. For example, a company that uses a storage account on Azure will opt for a different Datadog module from a company that hosts its microservices for use in the apps that it markets for use by other companies.
Pros:
- Supports monitoring Azure as well as other public and private cloud environments
- Cloud-based SaaS product allows monitoring with no server deployments or onboarding costs
- Supports auto-discovery that builds network topology maps on the fly
- Allows businesses to scale their monitoring efforts reliably through flexible pricing options
Cons:
- Would like to see a longer trial period for testing
Datadog is an excellent choice for enterprises searching for a cloud monitoring tool for Microsoft Azure and other applications. Prices start at $15 (£12) per month for the Infrastructure package. The agent is available for Windows, macOS, and Linux. You can start the free trial.
3. Dynatrace
Dynatrace is an application performance monitoring solution with Azure monitoring. The platform can automatically discover and map Azure dependencies on a dependency map. A dashboard view provides you with a run down of your entire environment providing key metrics on the availability of Hosts, Applications, Services, and Databases, alongside visualization options like graphs and charts.
Key Features:
- Deep Business Insights: Analyzes different parameters and makes sense of them within your larger context, and based on this analysis, provides recommendations and intelligent automation to save time and effort.
- Quick Onboarding: Deploy the platform in minutes, with no advanced scripting or technical knowledge required. Also integrates well with many Azure components like Functions, Firewall, Relays, DNS Zones, and more.
- Scalable and Cost-Effective: Automatically scales well to meet your organization’s diverse and growing needs, allowing you to verify the resource metrics and logs collected and make changes as needed.
Why do we recommend it?
Dynatrace is acclaimed for its application monitoring system, which is provided by a Full Stack Monitoring package. However, the platform also offers an Infrastructure Monitoring unit, which is much cheaper, and will give you Azure monitoring. Dynatrace also offers an Application Security module, which includes services hosted on Azure.
Monitoring containers with Dynatrace is made easier through the autodiscovery of Docker and AKS containers in real time. You can also use Dynatrace OneAgent Operator to deploy the OneAgent onto Kubernetes nodes automatically with less manual configuration.
AI-driven alerts automatically establish performance baselines and detect anomalies to notify you immediately. Users can configure custom alert thresholds to determine when the system will generate an alert. All events detected by custom alerts can be viewed in the Problems feed, providing a record of the latest security events.
Who is it recommended for?
The Dynatrace Application Security module focuses on applications and services rather than the platform. So, you get security monitoring for the services that you host on your Azure account rather than the platform itself. The package also won’t monitor the security of your storage accounts.
Pros:
- Secures complicated Azure/hybrid cloud environments with ease
- Sleek, customizable interface
- Real-time LAN and WAN monitoring that supports virtual environments, great for MSPs and large enterprise networks
Cons:
- More suited for larger networks and enterprise organizations
Dynatrace is a state of the art application monitoring solution that’s suitable for enterprises looking for a solution to gain transparency over the performance of Azure applications. The full-stack monitoring package stats at $6 (£4) per month per 8gb host. You can start the 15-day free trial.
4. CrowdStrike Falcon for Azure
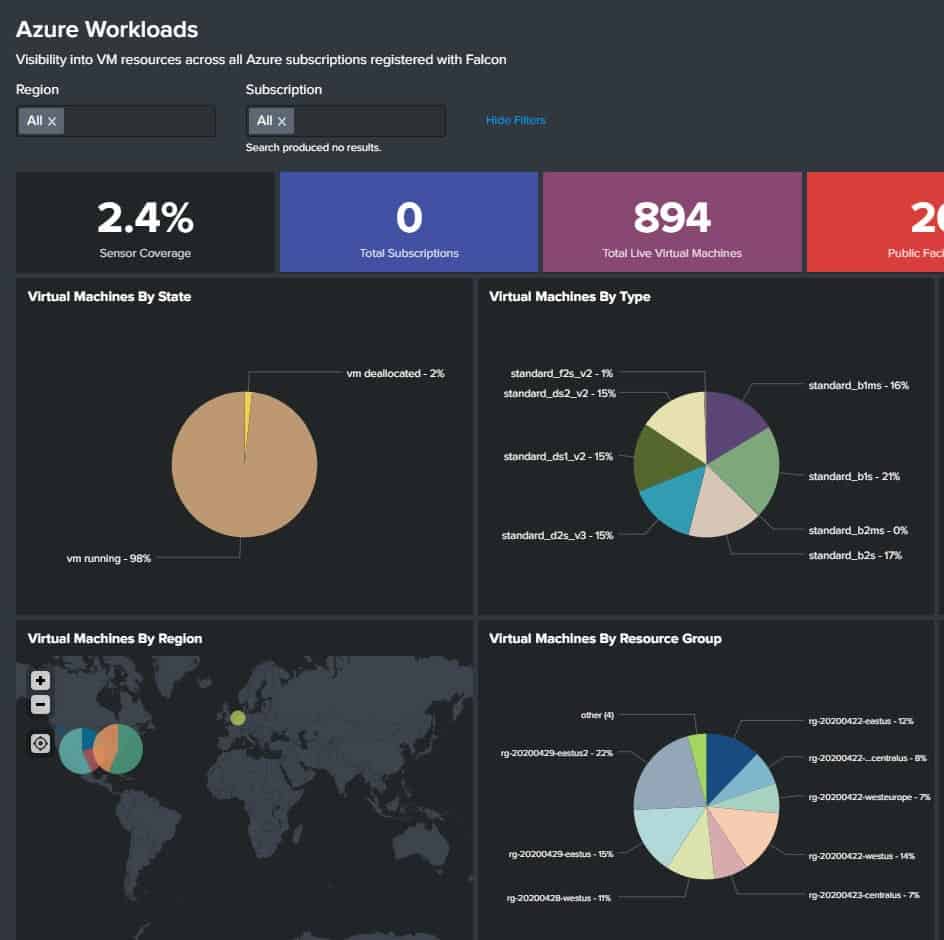
CrowdStrike Falcon for Azure is delivered from the CrowdStrike server in the cloud and reaches over to your Azure accounts. It can monitor processors, storage, and containers. This service is also able to monitor AWS and Google Cloud Platform accounts and it is possible to centralize the supervision of all of your accounts across all of these platforms with the Horizon system.
Key Features:
- Automatic Discovery: Automatically discovers Azure workload footprints to help understand how Azure resources are used, allowing you to secure all virtual machines, identify the relevant risks, and reduce the attack surface.
- Comprehensive Visibility: See everything in your Azure environment, including Azure workload events and virtual machine metadata to detect and respond to threats.
- Reduces Complexity: Its many integrations reduce complexity and support CI/CD workflows, allowing you to easily secure your Azure environment without worrying about performance. It even provides visibility into the container footprint of both on-prem and Azure deployments.
Why do we recommend it?
CrowdStrike Falcon for Azure is an impressive package from a leading cybersecurity provider. CrowdStrike’s Falcon suite is more conventionally designed to protect endpoints, and this Azure protection system is a new offering from the company. This system focuses on the security of VMs and web applications.
The CrowdStrike system provides an asset discovery service. It will search through your account and then list exactly what services and resources you have resident on Azure. This starts a continuous monitoring service that watches over resource usage as well as looking out for security threats.
The Falcon for Azure monitoring system is suitable for use in development environments as well as in operations. It examines your account settings and recommends adjustments that apply to your particular usage model. Monitoring extends to services, such as Azure AD, load balancers, databases, and containers.
Who is it recommended for?
The Falcon for Azure system can be integrated into CI/CD pipelines, which means it can be used as a continuous tester for development teams. When used for operations, the package acts as a vulnerability scanner for cloud platforms and applications. It looks for misconfigurations in systems such as platforms and containers.
Pros:
- Excels in hybrid environments (Windows, Linux, Azure, multi-cloud, etc.)
- Intuitive admin console makes it easy to get started and is accessible in the cloud
- Tracks and alerts anomalous behavior over time, improves the longer it monitors the network
- Lightweight agents take up little system resources
Cons:
- Could benefit from a longer trial period
You don’t need to install any software on your premises for CrowdStrike Falcon Horizon, you just need to sign up for a CrowdStrike account and then enter your Azure account credentials for access. The Horizon service can be integrated with other CrowdStrike Falcon products to monitor on-site endpoints as well. CrowdStrike offer a 15-day free trial.
5. AppDynamics
AppDynamics is an application performance management solution with Microsoft Azure monitoring. AppDynamics automatically discovers Microsoft Azure services including Azure App Service, Web Apps, WebJobs, and Azure functions, so that you can monitor issues such as performance bottlenecks.
Key Features:
- Complete Monitoring: Monitor complex and fast-growing applications at scale, and get visibility and insights about Azure services and serverless functions using .NET and .NET Core.
- Discovers Applications and Dependencies: Automatically detect your application’s services and dependencies, such as services like Azure App, Web App, Web Jobs, and Azure Functions, regardless of the environment or where it is deployed.
- Cloud Migration: Automatically checks the baseline performance metrics before and after migrating to the cloud, visualizing real-time interaction dependencies to ensure a successful migration.
Why do we recommend it?
AppDynamics is a strong rival to the Dynatrace system. It uses AI to track the activities of applications and is particularly strong at examining systems hosted on cloud platforms, such as Azure. The AppDynamics application monitoring system is available in three editions, and there is also an Infrastructure Monitoring plan, which will watch over your Azure account.
Anomaly detection, powered by machine learning, establishes performance baselines, and notifies you when resources display unusual behavior. For example, if the response time of an application is unusually high, the system will notify you so you can investigate further and find the root cause. Code-level root cause analysis allows you to see the precise cause of performance issues.
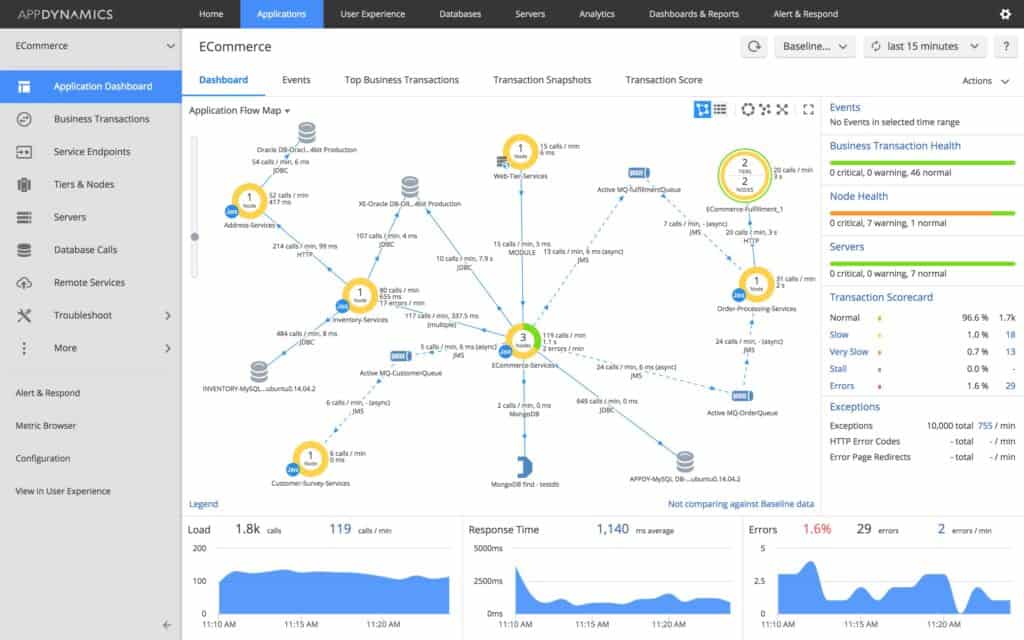
Visualization options like graphs and charts provide you with an overview of your infrastructure that’s easy to understand at a glance. Dashboards are customizable so that you can build the view that displays the performance issues most relevant to your environment.
Who is it recommended for?
This package is going to appeal to businesses that run applications on cloud accounts. The system uses AI to track the interdependencies of applications, and then predicts when their demands might overload platform resources. You can also use this facility to look for anomalous usage, which could indicate intruder activity.
Pros:
- Tailored for large-scale enterprise use
- Excellent dependency mapping and visualizations to help troubleshoot complex application systems
- Includes a fully functional free version
Cons:
- Can have a steeper learning curve than similar tools
AppDynamics is a solid application performance management tool for enterprises who require a solution with anomaly detection. To view pricing information you need to request a quote from the company directly. You can start with a 15-day free trial.
6. New Relic
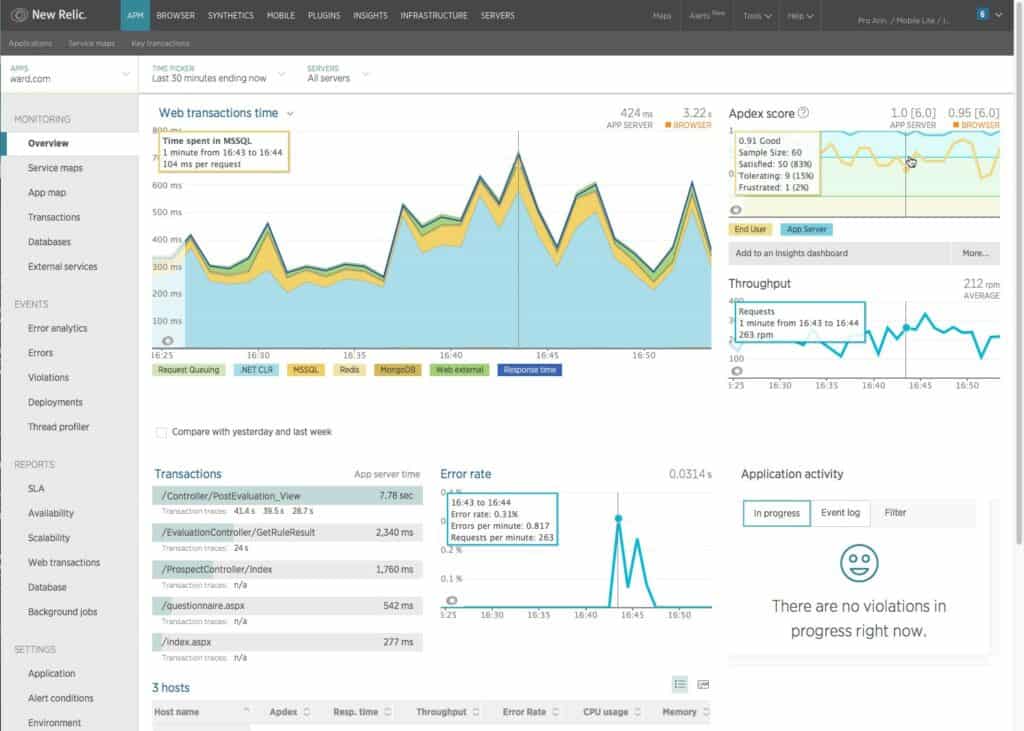
New Relic is a Microsoft Azure certified application performance monitoring you can use to monitor the performance of Azure web apps. View performance data through the dashboard complete with graphs and charts you can use to discover important performance trends.
Key Features:
- Rapid Onboarding: Integrates with Azure seamlessly to provide insights into the Azure portal, enabling you to install the infrastructure agents and manage the service you want to monitor. Also, you can set up the entire interaction to send events, logs, and traces to New Relic.
- Comprehensive Observability: Obtain end-to-end Azure observability as a single data platform for all metrics, logs, and traces, where you can visualize, analyze, and troubleshoot Azure environments.
- Scalability and Security: Scales well with your business and the data it generates, with all data stored in New Relic built on Azure, protecting your telemetry.
Why do we recommend it?
The New Relic platform has gone through a few changes recently. This is a large platform of 16 units that is growing all the time. Together, these systems represent full stack monitoring, and provide detailed performance monitoring for web applications and websites. The platform includes a Vulnerability Management module.
An Alerts system generates alerts whenever performance deteriorates. Alerts are threshold-based so you can configure trigger conditions that dictate when the software triggers an alert. There is also an applied intelligence feature that automatically detects anomalies and notifies you so that you can respond quickly and reduce your MTTR.
The platform comes with over 300 agents and integrations making it easy to monitor all of your infrastructures from one place. If you require more customization options then you can use the API to build custom apps.
Who is it recommended for?
The New Relic platform is offered as a single product, which means you get all of the units on it, but not every business will need all of the services on the platform. However, there is a Free Tier offered to everyone, including buyers who pay for extra capacity.
Pros:
- Certified for Microsoft Azure monitoring
- Uses anomaly detection to highlight abnormal behavior in your Azure environment
- Uses simple but intuitive admin dashboards
Cons:
- Better suited for small to medium-sized Azure networks
New Relic is a high-quality application monitoring software you can use to monitor Azure alongside the rest of your applications. The Standard version is available for free for a single user and costs $99 (£77) per additional user per month. You can sign up from this link.
7. LogicMonitor
LogicMonitor is an infrastructure monitoring platform that provides monitoring for Microsoft Azure. LogicMonitor has an Azure integration that can collect Azure monitor metrics. The user interface features a customizable dashboard so you can view the Azure performance metrics most relevant to your environment.
Key Features:
- Customizable Metrics: Monitor just the metrics you want and drill down into these at the application and operating system levels. Regardless of how granular your data is, you can gain a unified view of all the relevant metrics.
- Insightful Dashboards: Leverage the under-utilized and over-utilized resource dashboards to understand this resource drain and plug them in, allowing you to identify the right size of your virtual machine infrastructure.
- Automation: Keep your virtualized infrastructure optimized and available as you detect issues, reduce MTTR, and use automated forecasting to plan your resource usage.
Why do we recommend it?
LogicMonitor focuses on network and infrastructure monitoring, and it has a special plan for cloud and container monitoring. This unit examines AWS, Azure, GCP, and other cloud platforms. It is designed for cost control and performance monitoring rather than security monitoring. However, it offers log analysis for anomalies, which you can use for security alerting.
Out-of-the-box threshold-based alerts notify you whenever resources begin to perform poorly. Alerts are sent via email, SMS, and voice calls so you’re always up to date on the latest developments. Configure escalation chains to determine who is notified first. You have the option to configure recipient groups so that groups of users receive the same alerts.
Reports help you to record key performance trends to share with your team. Create report groups and schedule reports for automated email delivery to create regular updates on your resources.
Who is it recommended for?
LogicMonitor’s Cloud and Container Monitoring service is an appealing system for businesses that have everything loaded onto Azure. However, if you run a hybrid system with on-premises elements that you need to protect, you could look at the Unified Infrastructure Monitoring module.
Pros:
- Monitors application performance via the cloud
- Monitors assets in hybrid cloud environments
- Dashboard can be customized and saved, great for different NOC teams or individual users
Cons:
- Trial is only 14 days, would like to see a longer testing period
LogicMonitor is a robust Azure and infrastructure monitoring tool, with lots of configuration options. You need to request a quote from the sales team for pricing information. You can get the free trial.
Azure Security Guide: Monitoring Should be a Top Priority
Moving to the cloud brings to the table new security concerns that need to be managed the same as you would for on-premises infrastructure. Adhering to the best practices listed above and implementing continuous performance monitoring will help to make sure that your applications are not only secure but also perform well.
Tools like SolarWinds Server & Application Monitor, Datadog, and LogicMonitor are worth taking a look at if you want to monitor Azure performance long term. However, we recommend researching multiple tools before committing to a purchase or installation so that you find the best fit for your needs.


