OpManager is the central module in a suite of monitoring tools produced by ManageEngine. This is one of the leading network infrastructure monitoring tools available and the integration with sister products creates a very powerful system management support suite.
Key Features:
- SNMP Utilization: Enables real-time status monitoring of network devices.
- Wireless Monitoring: Tracks signal strength and traffic on wireless access points.
- Hardware Checks: Monitors hardware status like memory and disk space.
- Network Mapping: Automatically generates and updates network topology maps.
- Server Surveillance: Provides comprehensive monitoring of both physical and virtual servers.
- VoIP Oversight: Ensures priority and quality of voice traffic across the network.
- Syslog Management: Efficiently manages and analyzes syslog and event logs.
Who would need OpManager?
OpManager is a very comprehensive system with many screens of live statistics. The company offers a free version of the system that is limited to monitoring only three network devices. That implies that the system would be suitable for small businesses. However, a simple network with very few devices wouldn’t need all of the detailed information that OpManager produces.
This system is most suited to large businesses with complicated multi-site networks. The remote management elements within the tool make it an ideal conduit to centralize IT management in one location and cut costs on running support in every location.
Middle-sized companies would also benefit from using OpManager because the task automation included in the package enables a small team to support a complex network.
The tool focuses on the health of network devices, which are generic and not industry-specific, so OpManager is suitable for all sectors and all types of businesses that have sizeable networks to run.
OpManager features
OpManager’s main purpose is to monitor the successful operation of a network. The tool also has server monitoring capabilities. Here are the main activities that OpManager can be used for:
- Real-time network monitoring
- Wireless network monitoring
- Hardware monitoring
- Network mapping
- Physical server monitoring
- Virtual server monitoring
- WAN Link monitoring
- VoIP monitoring
- Syslog monitoring
The following sections explain these features in detail.
Real-time network monitoring
Network monitoring is the core task of OpManager. The tool doesn’t monitor traffic flows. Instead, it monitors the statuses of network equipment. The network monitor relies on the Simple Network Management Protocol (SNMP). This system is built into all networking equipment as an agent program. The only piece missing in the protocol’s implementation is a manager. OpManager provides that function.
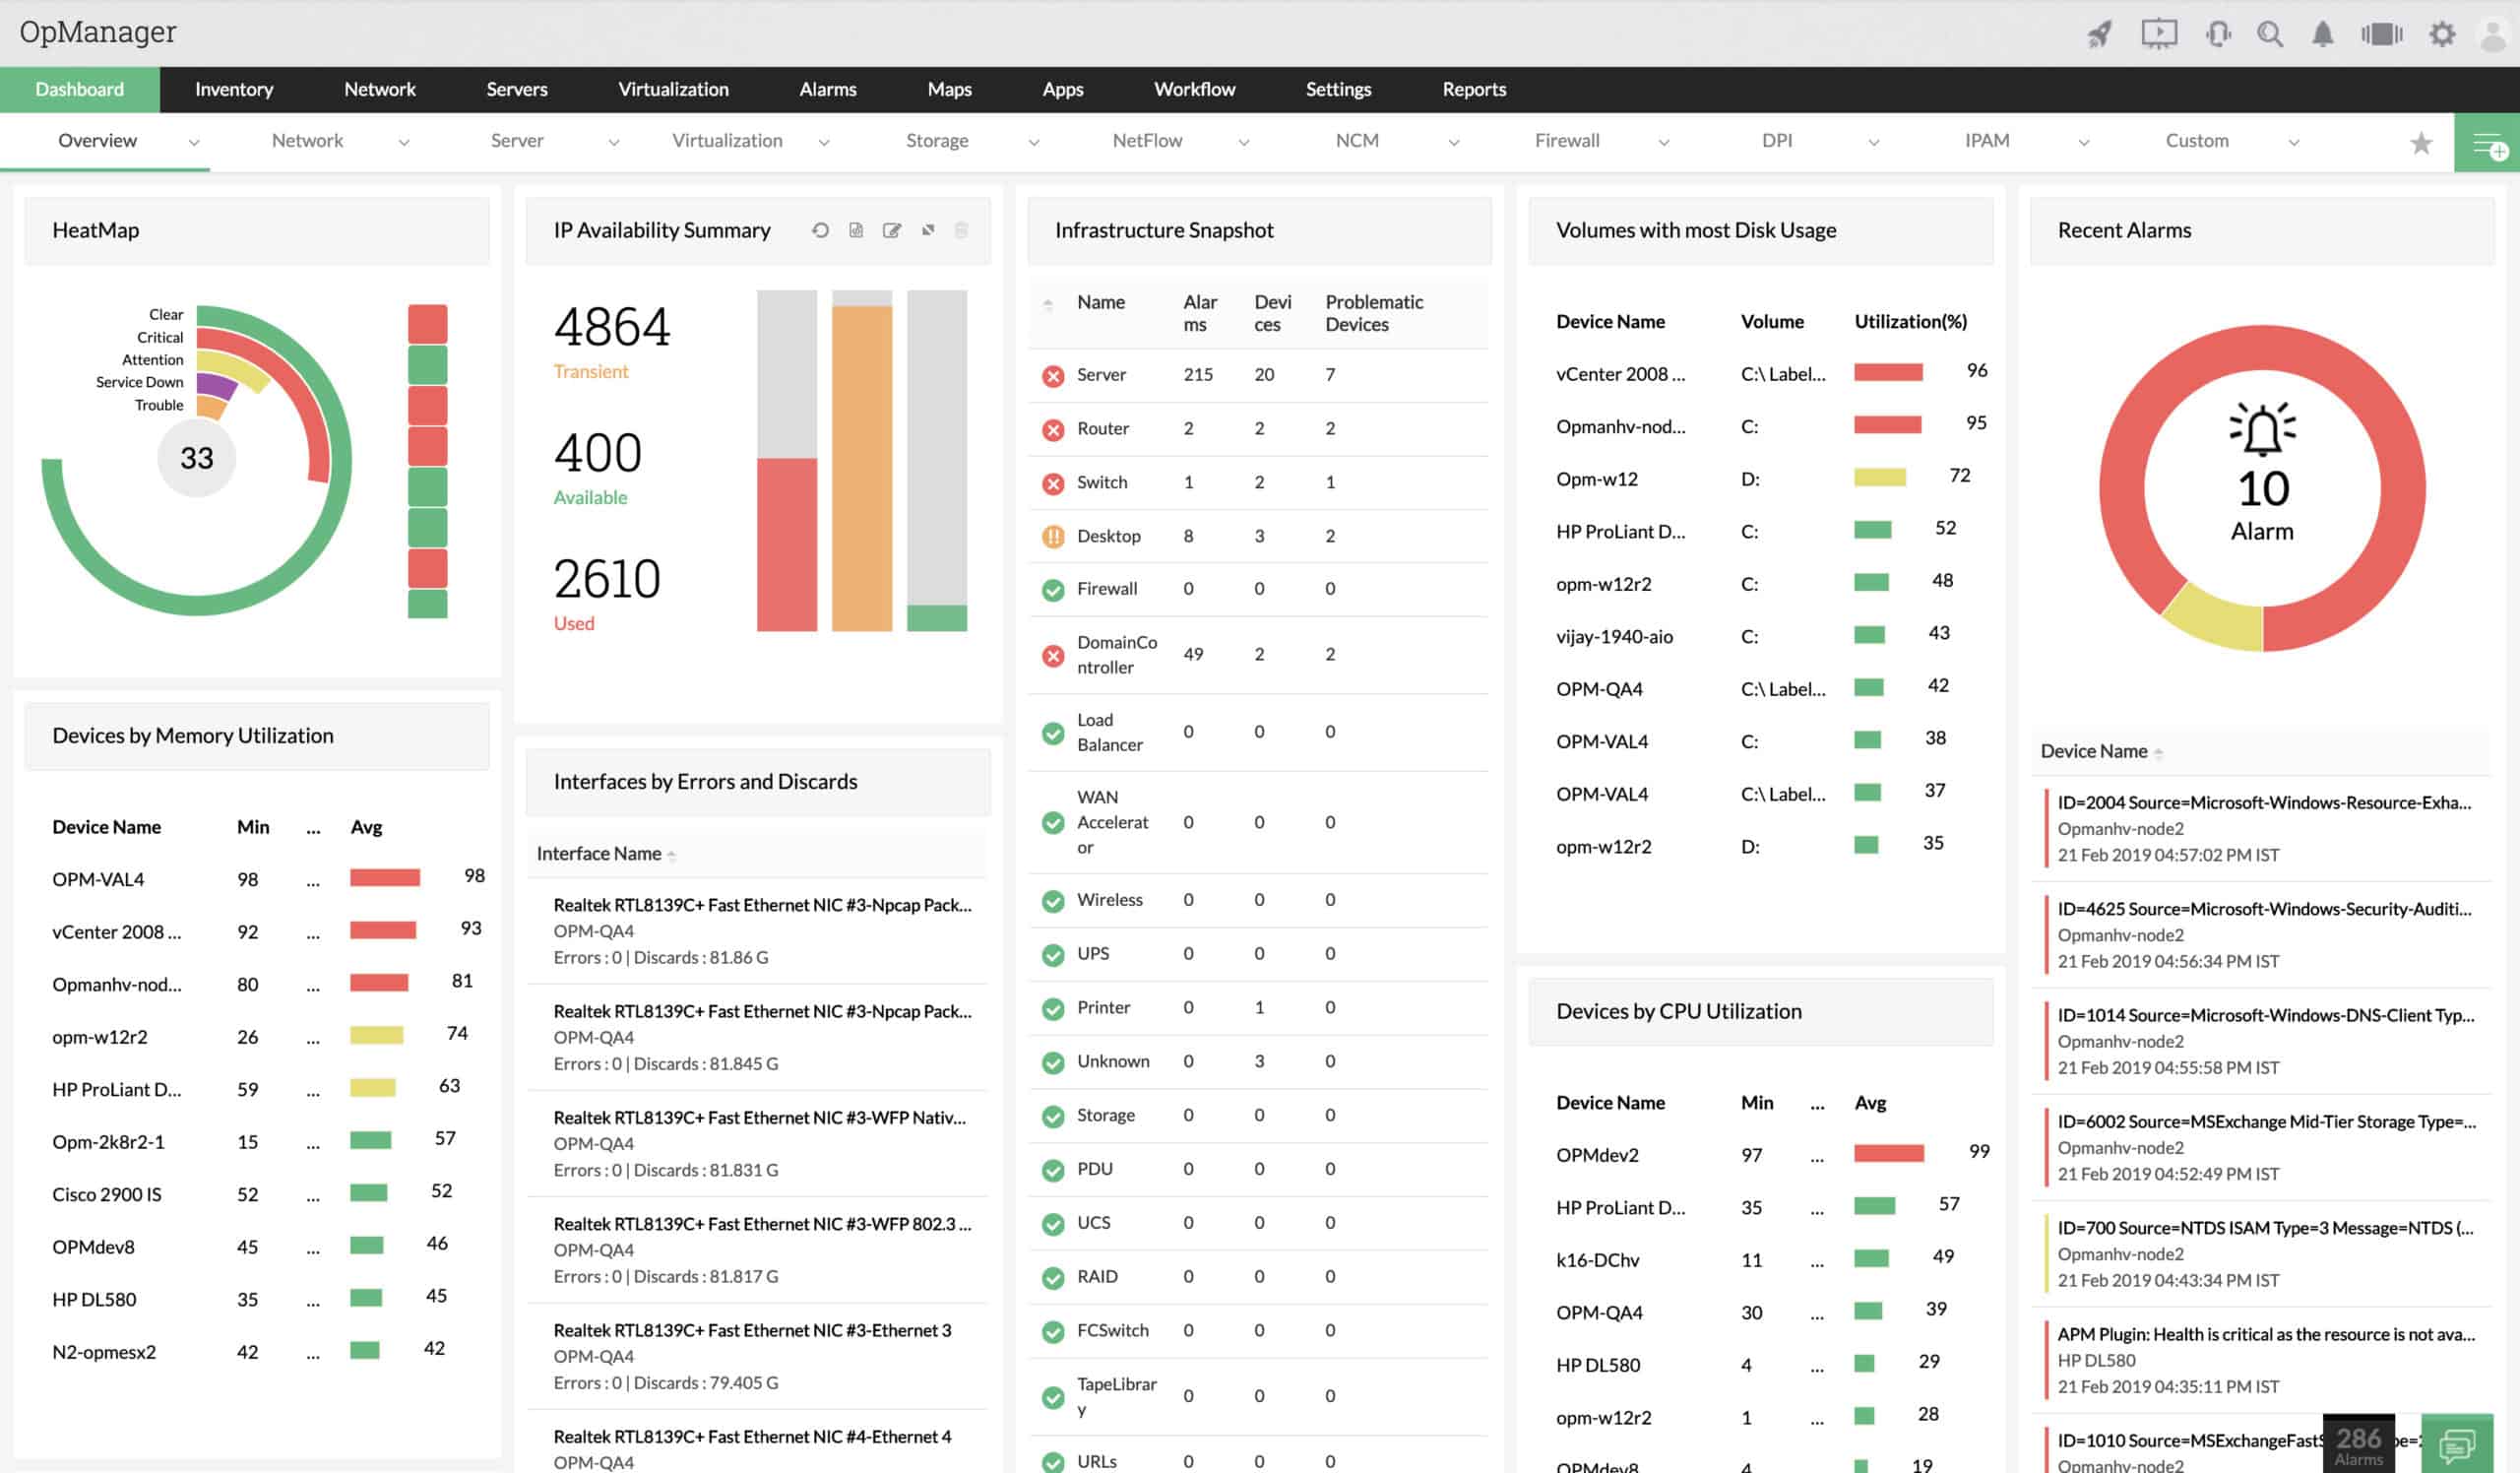
SNMP enables OpManager to constantly gather device statuses. The information from those continual inquiries is displayed in graphical and statistical formats in the dashboard of the tool. In regular operations, the manager requests status reports from all of the device agents. However, if the device is in trouble, the agent sends a report without waiting to be asked. This is called a “trap” and OpManager converts that into a warning or an alert. These notifications enable network technicians to head off device failure before it happens.
By catching problems before they escalate into disaster OpManager can reduce the number of calls to the help desk – problems can be solved before users notice them. This reduction of support calls saves costs and helps OpManager to pay for itself.
Wireless network monitoring
The wireless network monitoring module of OpManager is a very useful tool. Many companies deploy Wi-Fi in their offices these days, often as a separate network for employees to access for private use.
The network monitor shows the signal strength of all wireless access points on the premises and can also record the amount of traffic running to each wireless router. It also displays utilization statistics that illustrate when wireless routers are overloaded.
The monitor is useful for planning capacity and also for spotting rogue access points within the premises, which could threaten your security.
The Wireless network monitor stores templates for each router model. Once the operator sets a list of required monitors for a router type, those settings will be repeated for each router of the same model. Further time saving is available through task automation and automated data gathering.
Hardware monitoring
The network monitoring function of OpManager relies on the ability to query device agents through SNMP. Monitoring network performance automatically includes keeping an eye on the statuses of all the routers and switches that run the network.
The OpManager system compiles a list of all network devices and regularly checks on the status of various hardware elements, such as memory utilization and availability, disk space, temperature, and voltage. Spotting problems with those devices and dealing with them keep the network running.
Network mapping
OpManager takes full advantage of all of the information that SNMP provides and creates network maps from that data. First of all, those SNMP responses from device agents notify the manager of the existence of those devices. Thus, OpManager can compile an equipment inventory without any human intervention.
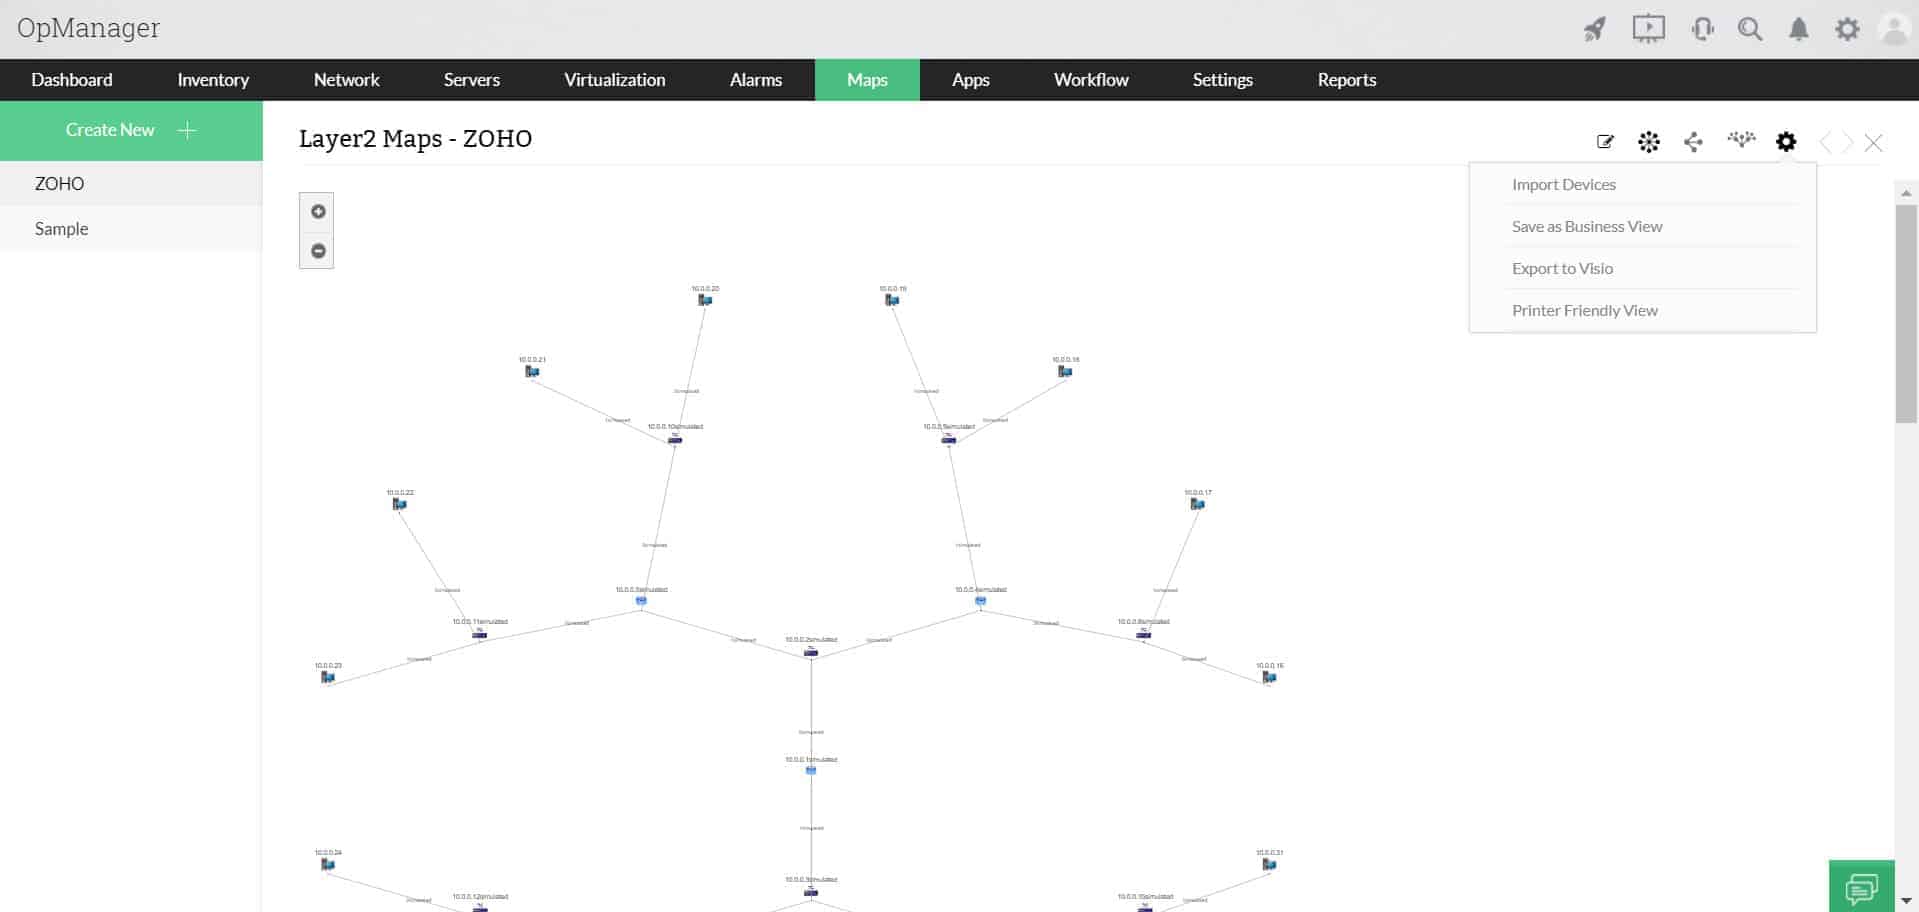
OpManager also creates a map of this information. Both the inventory and the network topology map get updated in real-time, so it is easy to see when new devices are added to the network and old devices are retired. It is even possible to see when devices are moved.
The network topology maps of OpManager are a great feature. The mapper Is able to show the network as links between all devices, just the Layer 2 or Layer 3 devices, as a 3D representation of the building, and as a map with all sites of a WAN plotted on it. Another great visualization is a view of each server rack with all the equipment in it.
Physical server monitoring
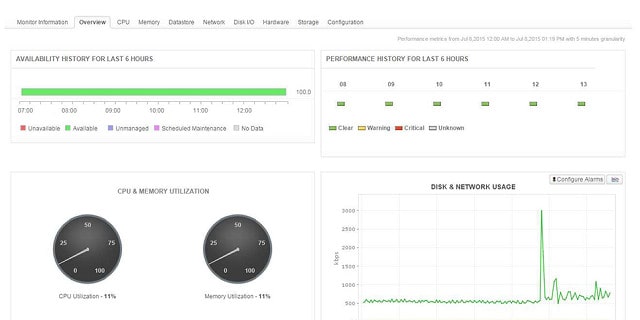
Rival monitoring systems create separate network performance monitors and server monitors. OpManager covers servers as well as network equipment. CPU, performance, CPU memory, storage, disk, power supply, and fan speed are all constantly monitored and displayed as visualizations in the dashboard of the tool.
The capacity of servers is very important for successful application delivery, so OpManager also monitors running processes, observing their resource utilization and ensuring that capacity limits are not hit.
Virtual server monitoring
Virtualizations create great resource efficiency, but they can get complicated very quickly if they are not properly monitored. Switching from VMs between servers is a necessary part of keeping virtualizations running effectively.
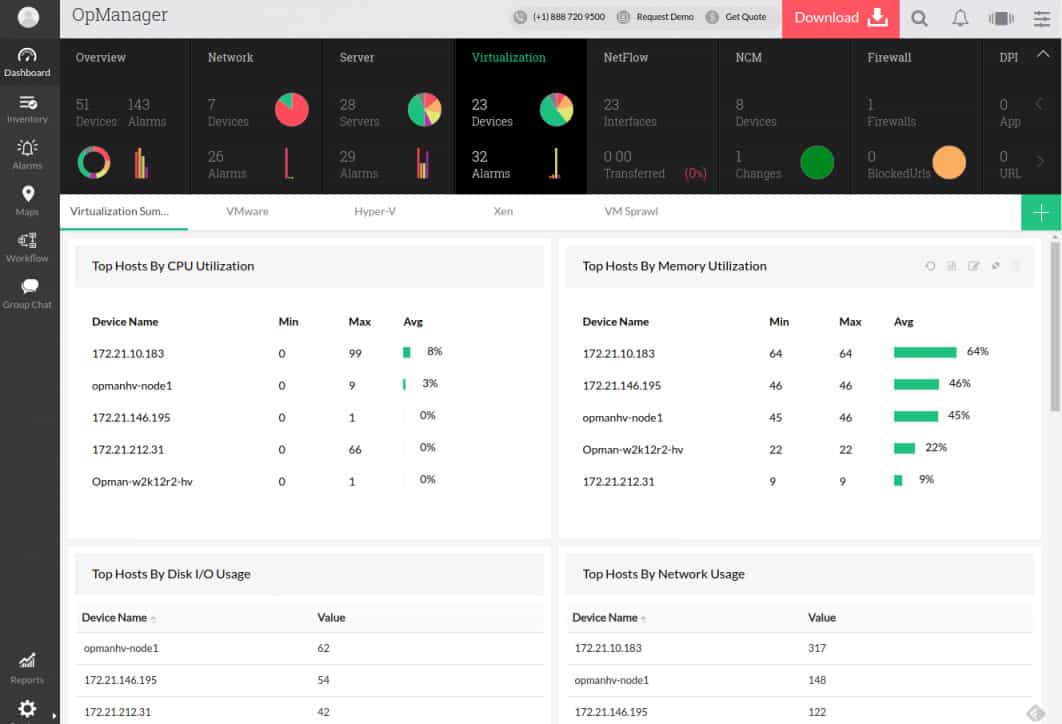
The virtual server monitoring tool in OpManager tracks all of the links between VMs and servers. It keeps track of the environment software that maintains the virtualizations and it watches the capacity of the physical resources that support and connect all of the elements of the virtualizations.
A very useful feature in the tool is a virtualization map. This is compiled automatically and updated whenever any changes occur in the mapping. This is a particularly useful assistant if you implement dynamic allocation. OpManager has specialist sections for monitoring VMWare, Hyper-V, and Citrix Xen Server virtualizations.
WAN link monitoring
Running a multi-site operation requires remote monitoring, which makes the internet connections between sites vital to the smooth operation of the organization. The WAN link monitoring system in OpManager is modeled on Cisco IP SLA standards. This tracks the quality of the links between sites in a WAN and the central monitoring station. The monitoring package also includes a constant measure of connection roundtrip times.
VoIP monitoring
Running a telephone system over the data network places even greater importance on constantly available network services. The VoIP monitor in the OpManager package helps keep the voice traffic prioritized so it gets all of the speed that it needs.
OpManager deploys QoS strategies, implementing queuing and prioritizing where necessary to keep VoIP traffic moving at sufficient speeds. OpManager monitors packet loss, delay, jitter, the Mean Opinion Score (MOS) and roundtrip time (RTT).
Syslog and Windows Event log monitoring
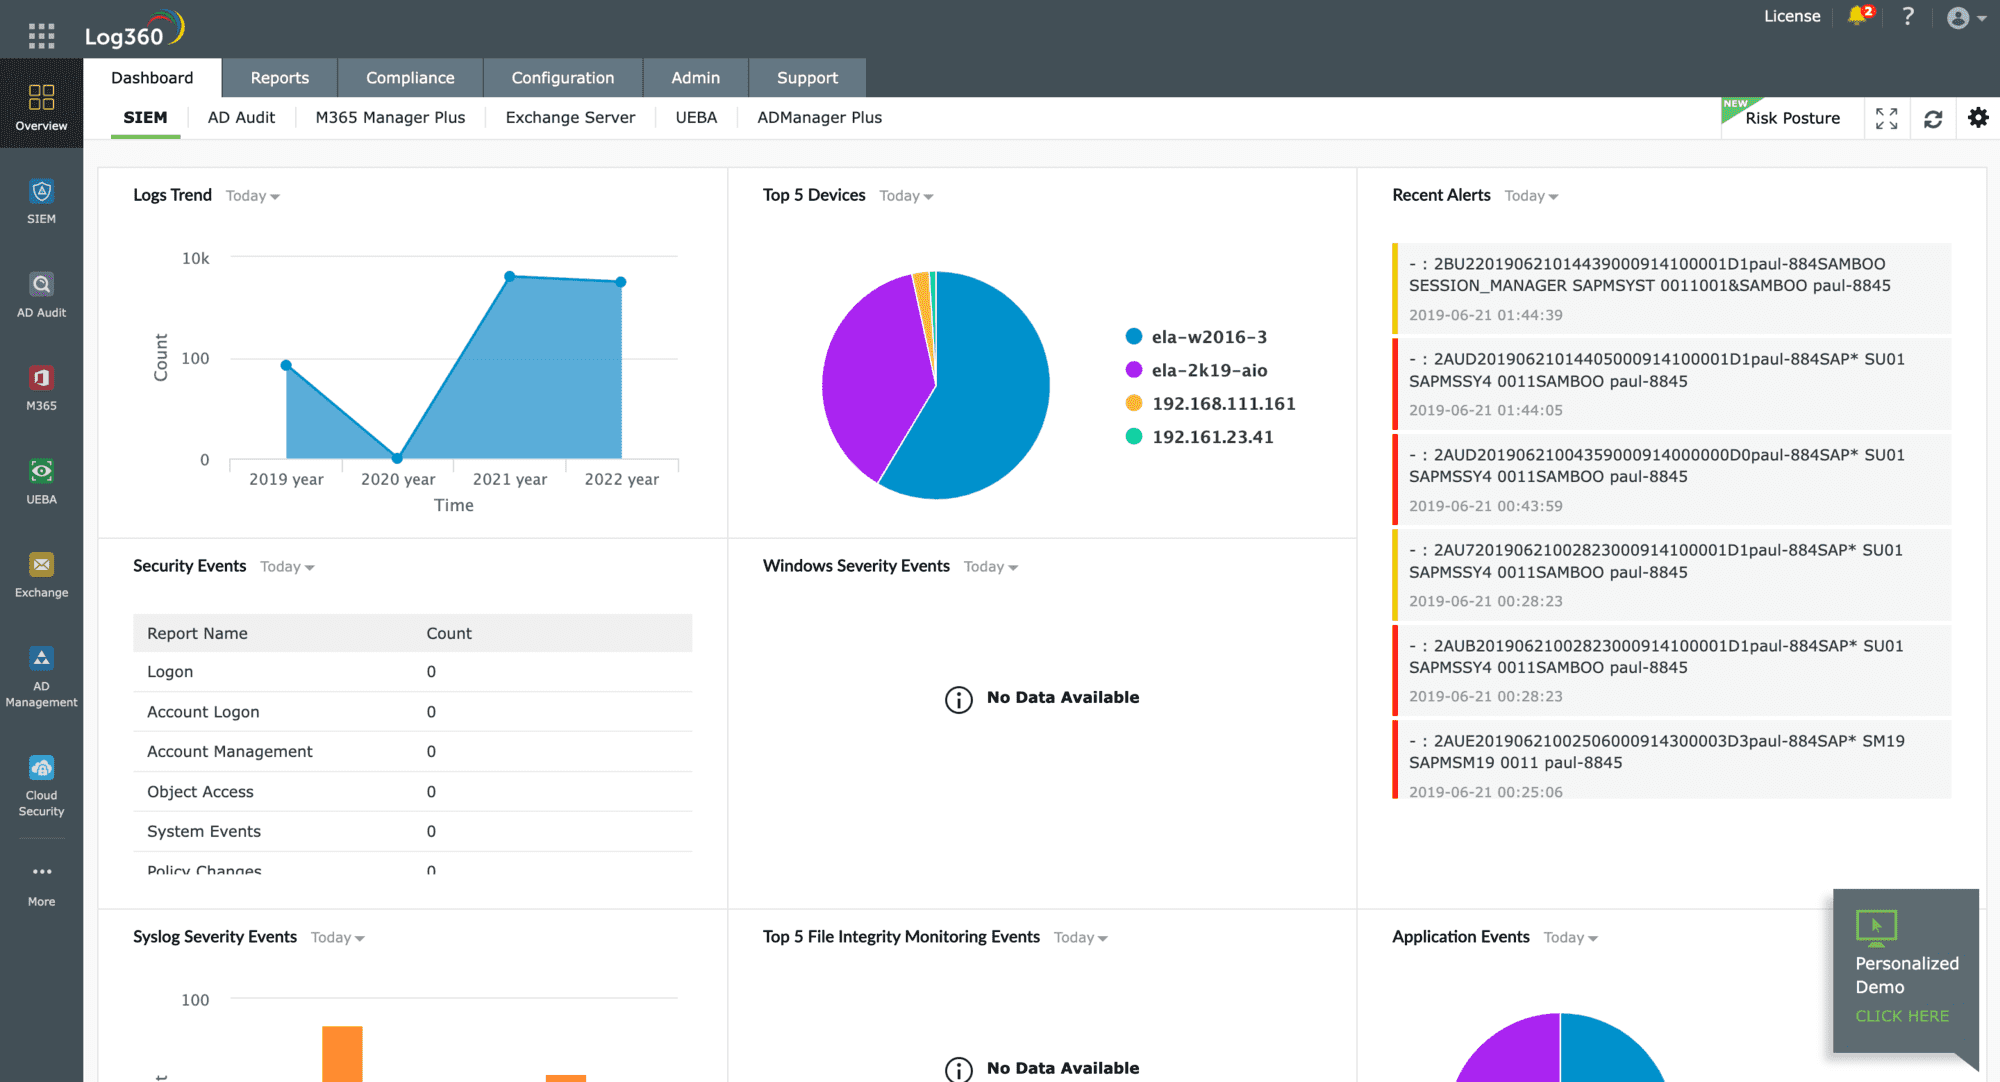
Syslog and Windows Event log are becoming increasingly important in intrusion detection managing those logs so that they are in a scannable format. It also ensures that they are properly filed in meaningful directories which is an important step in gleaning useful information from them.
OpManager acts as a syslog server and a Windows event log server to properly manage these records and make them available for analysis.
Pros & Cons
Pros:
- Comprehensive Monitoring: Offers detailed surveillance across network hardware, servers, and VoIP systems.
- Integrated Management: Combines network, server, and log monitoring in one platform.
- Automated Mapping: Automatically updates network and virtualization maps, enhancing operational visibility.
- Preemptive Alerts: Uses SNMP traps to provide early warnings about device issues, reducing downtime.
- Scalability: Effectively supports large, multi-site networks with complex infrastructure.
Cons:
- Overwhelming Data: The amount of data and statistics generated can be overwhelming for smaller networks.
- Limited Free Version: The free version’s limitation to monitoring three devices may be insufficient even for small businesses.
OpManager system requirements
OpManager is an on-premises software that needs to be installed on a server.
Operating system
The OpManager software is available for Windows Server and Linux.
The Windows version runs on:
- Windows Server 2008
- Windows Server 2012 (including R2)
- Windows Server 2016
- Windows Server 2019
The Linux version runs on:
- Ubuntu
- Suse
- Red Hat Enterprise Linux (up to version 8)
- Fedora
- Mandriva (Mandrake Linux)
Browser types
The interface for the system loads into a browser:
- Google Chrome (preferred)
- Mozilla Firefox
- Microsoft Edge
Host hardware
The hardware requirements for the software depend on the edition that has been selected and the number of devices that are to be monitored.
For OpManager Standard and Professional editions monitoring up to 250 devices:
- Hard drive space: 20 GB minimum
- CPU: Intel Xeon 2.0 GHz 4 cores/ 4 threads
- RAM: 4 GB
For OpManager Standard and Professional editions monitoring 251 to 500 devices:
- Hard drive space: 20 GB minimum
- CPU: Intel Xeon 2.5 GHz 4 cores/ 8 threads
- RAM: 8 GB
For OpManager Standard and Professional editions monitoring 251 to 500 devices:
- Hard drive space: 40 GB minimum
- CPU: Intel Xeon 2.5 GHz 4 cores/ 8 threads or higher
- RAM: 16 GB
For OpManager Enterprise editions monitoring 251 to 500 devices:
- Hard drive space: 100 GB minimum
- CPU: Intel Xeon 3.5 Ghz 4 cores/ 8 threads or higher
- RAM: 16 GB or higher
Editions
OpManager is available in four editions:
- Free
- Standard
- Professional
- Enterprise
The Free version is the same as Standard edition but with a limit of three devices to monitor.
Standard
Includes:
- Network performance monitoring
- Hardware monitoring
- Physical server monitoring
- Alarms and notifications
- Network topology mapping
Professional
Includes:
- Network performance monitoring
- Hardware monitoring
- Physical server monitoring
- Alarms and notifications
- Network topology mapping
- Virtualization monitoring
- Workflow automation
- 3D rack view
Enterprise
Includes:
- Network performance monitoring
- Hardware monitoring
- Physical server monitoring
- Alarms and notifications
- Network topology mapping
- Virtualization monitoring
- Workflow automation
- 3D rack view
- WAN monitoring
- Failover/high availability
Complementary modules
ManageEngine built a standard platform for its main monitoring tools. This includes some cross-modular functions that only become activated for those who buy all contributing modules. The common platform is called Orion and it ensures a standard ‘look and feel’ to all ManageEngine infrastructure monitoring systems.
The commonality and joint facilities are activated automatically at the point of installation. Technicians do not need to perform any adaptation in order to get separately-bought modules to work together.
The ManageEngine catalog keeps expanding every year. The company now produces many specialized infrastructure monitors. However, a number of these work particularly well with OpManager and compliment to the information that the network and server monitor can provide.
NetFlow Analyzer
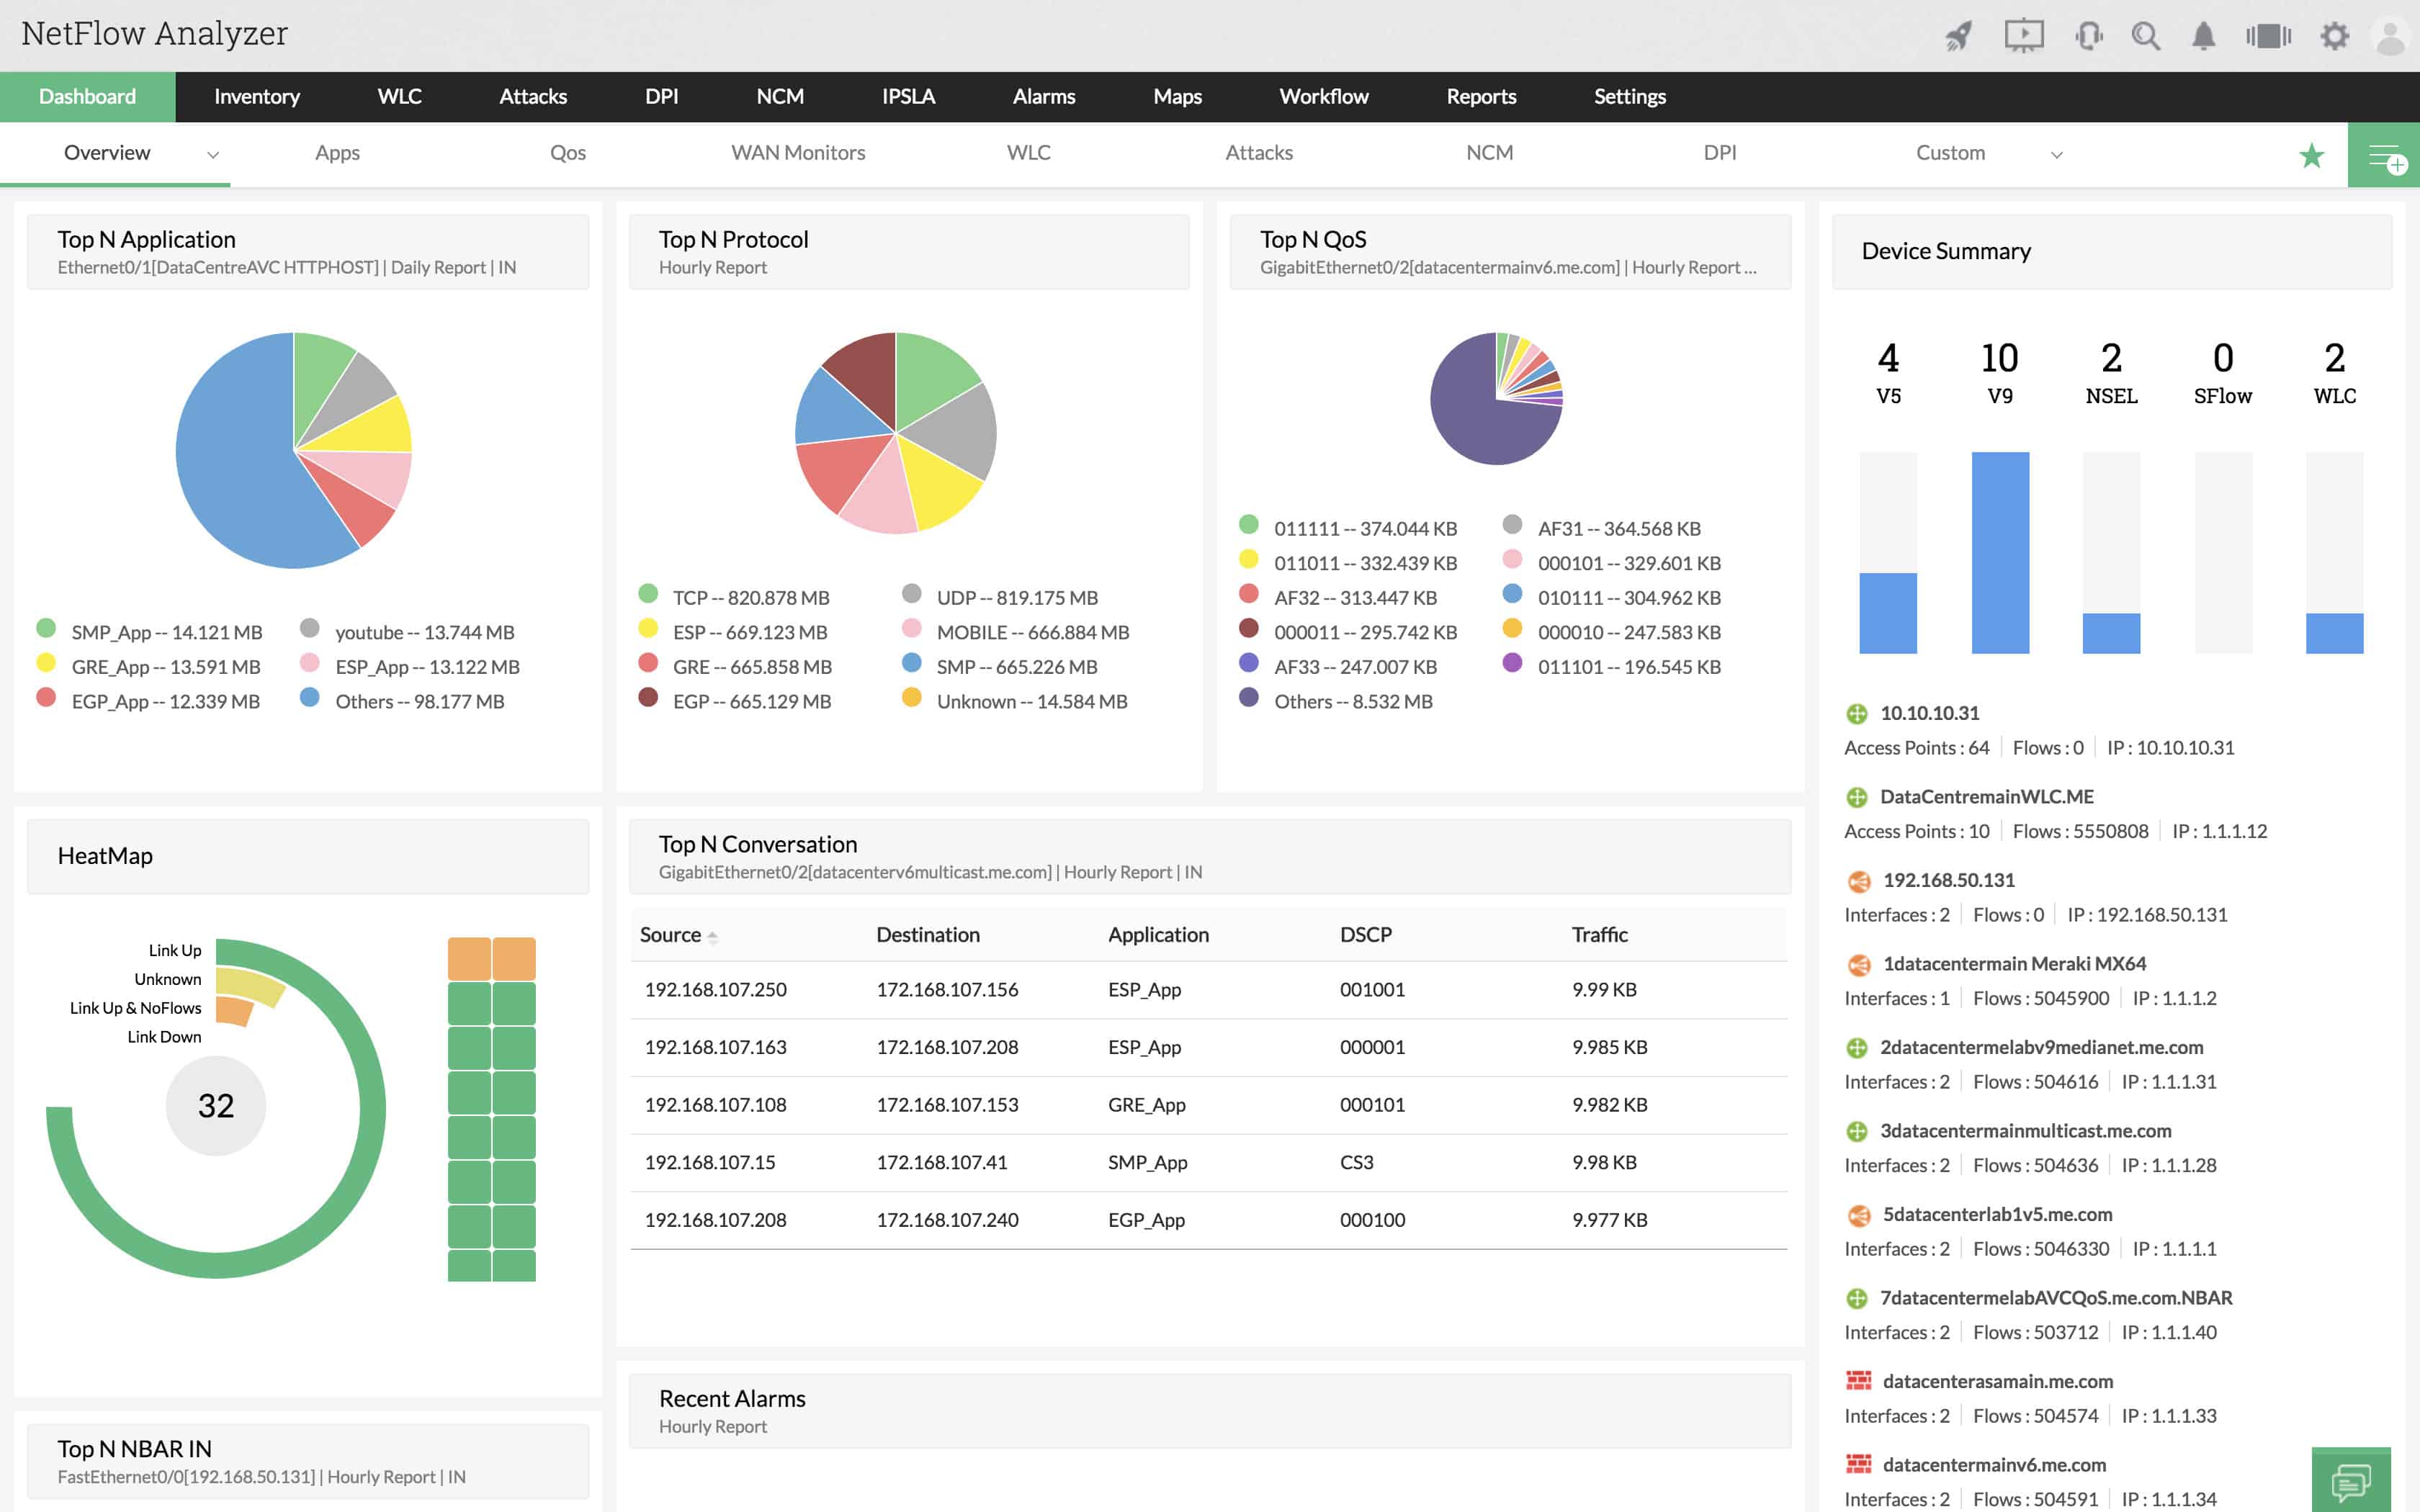
ManageEngine NetFlow Analyzer works particularly well alongside OpManager. While OpManager attends to the statuses of network devices to keep the system running efficiently, NetFlow Analyzer focuses on traffic flows.
Key Features:
- Traffic Analysis: Focuses on monitoring and analyzing network traffic flows to optimize bandwidth and performance.
- Protocol Support: Compatible with multiple traffic sampling protocols including NetFlow, sFlow, and IPFIX.
- Integrated Platform: Seamlessly works with OpManager for comprehensive network management from a single console.
- Real-Time Monitoring: Offers real-time insights into network traffic to quickly detect and resolve issues.
- Customizable Reports: Generates detailed and customizable traffic reports to aid in decision-making.
Why do we recommend it?
NetFlow Analyzer works well as a standalone package for traffic analysis but it can also operate alongside the OpManager system. This service also supports solutions for traffic bottlenecks, such as queuing, and prioritization for time-sensitive applications, such as VoIP and video conferencing. Both packages are built on a common platform so you access them through a single console.
Who is it recommended for?
This package is suitable for any business that runs a network. Very small businesses can access a Free edition. However, it caters to networks that are so small that most of the analytical tools, such as network path analysis, would be worthless. So, the package is more suitable for mid-sized and large organizations.
The monitor doesn’t tap the cable to spy on passing data packets. Instead, it queries network devices, accessing their firmware to query traffic records and gather copies of data streams. Different makes of switches have different traffic sampling protocols loaded on to them, so it is important that OpManager can communicate in many different protocols in order to examine traffic in multi-vendor environments. The system can communicate in NetFlow, sFlow, IPFIX, Netstream, J-flow, and Appflow.
Pros:
- Enhanced Traffic Visibility: Provides deep visibility into network traffic, helping identify and rectify bottlenecks.
- Versatile Protocol Handling: Supports a wide range of protocols, ensuring compatibility across diverse network environments.
- Unified Management: Integrates with OpManager, simplifying network management through a unified platform.
- Prioritization Features: Enables effective bandwidth management for critical applications like VoIP, improving overall network efficiency.
- Scalable Solution: Scales effectively to meet the needs of mid-sized to large enterprises, supporting extensive network infrastructures.
Cons:
- Complexity for Small Networks: May be overly complex and underutilized in very small business environments.
- Resource Intensive: Requires significant system resources to operate, which could strain smaller network setups.
- Limited Free Capabilities: The free version may be insufficient for businesses needing comprehensive traffic analysis and management.
OpUtils
OpUtils offers a peculiar combination of system functions that no other network monitoring software provider has ever put together in one package; these are an IP address manager and a switch port mapper.
Key Features:
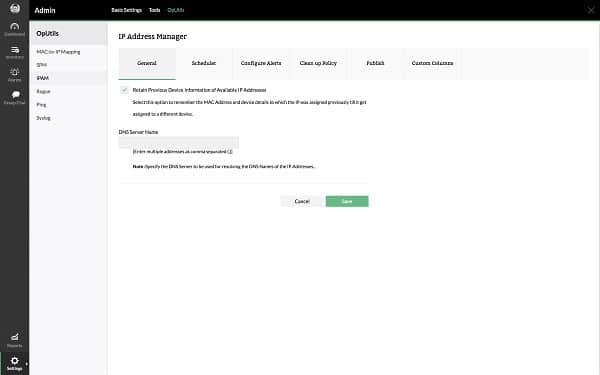
- IP Address Management: Efficiently manages IP addresses across the network, reducing conflicts and ensuring proper allocation.
- Switch Port Mapping: Automatically identifies and documents every connection to switch ports, facilitating easier network management.
- Integration Capabilities: Seamlessly integrates with Microsoft DHCP, DNS servers, and Active Directory for enhanced network control.
Why do we recommend it?
OpUtils manages all of the addressing issues in a network, which includes IP addresses and switch port numbers. The tool will also look at Transport Layer port numbers in IP headers. You can use this tool as a DDI solution to reconcile records in your DNS and DHCP servers and also implement network segmentation.
The IP address manager in OpUtils isn’t a full DDI solution, but it is close. The package doesn’t include integrated DHCP and DNS servers, but the IP address manager is able to coordinate with Microsoft DHCP and DNS servers. The system can also integrate with Active Directory for its access permissions system.
The integration of the IP address manager with Windows services shows that this software, although it can install on Linux, works better on Windows Server.
Who is it recommended for?
OpUtils manages the logical activities of switches and routers while OpManager looks at their physical properties. Any network of more than a couple of switches would need an IP address manager, which is the core function of the OpUtils system. Multi-site businesses would be better off considering a package that can implement SD-WANs.
The Switch Port Mapper automatically identifies the connections made to each port on a switch, which makes documenting a network a lot easier than visiting each device and waggling the cables plugged into it.
Pros:
- Comprehensive Address Management: Streamlines the management of IP addresses and switch ports, enhancing network efficiency.
- DDI Solution Support: While not a full DDI solution, it closely integrates with essential network services to simplify DNS and DHCP management.
- Active Directory Integration: Leverages Active Directory for sophisticated access control and permissions management.
Cons:
- Limited to Windows Optimization: Performs best on Windows Server environments, which might limit its use in varied IT ecosystems.
- No Full DDI: Lacks integrated DHCP and DNS servers, which may require additional solutions for complete DDI functionality.
- Complexity in Small Networks: May be overly complex for smaller networks, leading to underutilization of its capabilities.
Applications Manager
A weakness with ManageEngine modules lies in the boundaries between them. The Applications Manager contains many functions that would usually be counted as a separate server manager. Other parts of that non-existent server manager are bundled into OpManager.
Key Features:
- Full-Stack Observability: Provides comprehensive visibility into server resources and application performance.
- Service Monitoring: Tracks the performance and health of on-premises applications such as mail servers, web servers, and databases.
- Virtualization Support: Offers monitoring capabilities for virtual environments, enhancing resource management.
Why do we recommend it?
Applications Manager looks at server resources and the activities of the services and software that runs on those platforms. This package takes up observability just above the server monitoring services in OpManager. So the combination of OpManager and Applications Manager is a good fit to create full-stack observability.
Who is it recommended for?
The field of application management is in a bit of a state of flux at the moment. Many monitoring providers now refer to application monitoring in terms of Web applications; On-premises applications, such as mail servers, web servers, and databases, tend to be referred to as “infrastructure.” Applications Manager is a rare opportunity to get a tool that covers both types of application monitoring.
Although there are virtualization and server monitoring facilities in OpManager, it is necessary to buy and install the Applications Manager to fully manage servers and virtualizations. As the name suggests, this tool monitors all applications including web servers and database management systems.
Pros:
- Integrated Monitoring Solution: Works seamlessly with OpManager to offer full-stack observability for a wide range of applications.
- Extensive Application Coverage: Monitors a broad spectrum of applications, including critical infrastructure and web-based services.
- Enhanced Virtualization Management: Complements OpManager’s features by providing in-depth monitoring of virtual servers.
Cons:
- Complex Integration: May require complex setup and integration, particularly in environments not already using OpManager.
- Overlap in Functionality: Some features may overlap with those in OpManager, potentially complicating the management landscape.
- Niche Application Focus: While comprehensive, the focus on specific application types may limit its utility for broader IT environment needs.
OpManager Plus
OpManager Plus is an integrated combination of several ManageEngine products. This package includes the network device and server monitoring capabilities of OpManager, the bandwidth monitoring facilities of the NetFlow Analyzer, the applications, virtualization, and server monitoring utilities of the ManageEngine Applications Manager, the IP address manager and switch port mapper of OpUtiils, the configuration monitoring that can be bought separately as the ManageEngine Network Configuration Manager, and the firewall monitoring capabilities of the ManageEngine Firewall Analyzer.
OpManager’s market niche
ManageEngine OpManager, Paessler PRTG, and Solarwinds Network Performance Monitor are all very similar tools and all aim for the same market. None of these options is suitable for small networks. The extensive utilities of each become economically beneficial for middle-sized to large enterprises.
Fortunately, ManageEngine offers a 30-day free trial of OpManager, so while you are testing the Paessler and SolarWinds products, you can also assess ManageEngine’s OpManager.
ManageEngine is part of Zoho Corporation, which is a very sharp marketer. This tool is well designed and has an attractive user interface. One day soon, it might well become the leading network monitoring system.

