
With the large amount of money you have to pay for a mainframe, you would expect that nothing will go wrong with the computer. However, hope is not a very effective business strategy and you would be better advised to implement a monitoring process that ensures evolving issues can be spotted early
Performance problems with mainframes usually boil down to a shortage of resources with processor time, memory availability, and disk space being the top three services to watch. However, if you have ensured that the system still has spare capacity, you might struggle to work out exactly what is going wrong.
IT systems are complex and involve contributions from a combination of hardware types and software. Getting results delivered to end-users also involves the network and the internet plus the user’s device. It could well be that problems encountered by users are not the fault of the mainframe. This is why mainframe performance tracking really should be integrated into a system-wide monitoring strategy.
Unfortunately, mainframes haven’t caught the interest of the major monitoring system providers and you will struggle to find an automated monitoring service for all of your resources that includes mainframe management capabilities. Many systems administrators, therefore, separate the monitoring of mainframes from the facilities used to monitor the rest of their IT assets.
Mainframe performance indicators
One of the key tasks to perform when implementing mainframe performance management is to keep an eye on capacity. You need to ensure spare capacity and that important management task chain back to when you assessed the resources that you needed from your mainframe when you purchased it.
Once your mainframe is in place, many of the performance problems you experience will probably relate to any mistakes you made while forecasting capacity requirements. If you got your requirements right, you will only have performance threats at times of unexpectedly high demand. This increase in demand could be due to new service requirements that only arose once the mainframe was in place. Thus, it is important to convey the capacity limitations of your current hardware to stakeholders who demand extra services.
The capacity that you need to track concerns:
- Processor capacity
- Memory capacity
- Storage capacity
- I/O capacity
You should baseline the activity in these four areas over time to identify peaks and troughs in demand.
Smoothing demand
One of the main pieces of advice you will see in mainframe performance guides is to implement offloading. In practice, this tip is not much help. Servers and desktops are a lot cheaper than mainframes and if your tasks could have been performed on smaller devices, you wouldn’t have bought a mainframe.
Making sure that you only have heavy processing running on your mainframe that can’t be performed equally well on cheaper equipment is a key cost saver. However, the best opportunity you have for managing performance on a mainframe is to shift processing over time.
Start your mainframe performance management by examining load overtime to get a constant readout of demand overall hours of the day, every day of the month. Year-end demand is the type of load that you don’t get to see very often. When that hits, you should be sure that you have enough spare capacity to cope with the unexpected.
You also need to see demand per user and application. Specifically, you need to look at tasks that must be delivered quickly and those that are not catering to immediate demand. Also, look at the processes that fulfill the core business needs of the enterprise and those that are implemented for support of the system.
The target for your demand smoothing options is those processes that can be shifted out of business hours. There might be core business processes that can also be moved out of hours. This category would include the compilation of data summaries or very large and repetitive batch jobs, such as printing, which require a lot of interfacing out to networked services.
Capacity planning and monitoring
There are command-line utilities that you can run to see the current process list and the activities of those processes in terms of processor, memory, disk, and I/O utilization. You could set up a batch file to run these commands recursively but it would be better to find an automated tool to perform this task for you.
You need to be able to see each reading displayed in a time-series graph of recent events and also store each set of metrics for capacity planning analysis. Each metric can be assessed for capacity exhaustion by checking utilization levels over full capacity. These calculations will tell you when action needs to be taken. If you can get the test to send you an email in the event of capacity reaching into your safety margin, you have automated performance management and you don’t need to sit and watch the activity on your mainframe all day.
Monitoring Fujitsu BS2000 mainframes
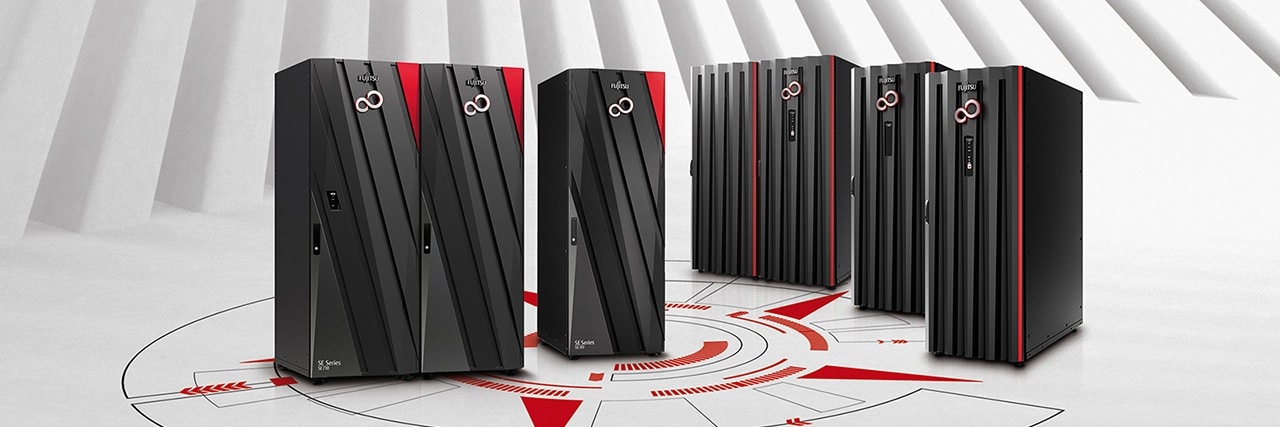
Although there are very few monitoring tools for mainframes available from third-party vendors, there are almost none that monitor BS2000 mainframes. It is easier for users of IBM systems to find monitoring options., There is one monitoring package that is worth looking into. That is the SM2-PA system, which is available from Fujitsu.
Using SM2-PA isn’t very straightforward because you will still need to set up a batch job to use it. The monitor records and collates data related to a named software package, you would need to set up an instance for each software system, called a user task, that is operating on your mainframe.
The lack of competent, automated performance monitoring systems for the BS2000 is frustrating. However, there is a solution. This comes in the form of the Simple Network Monitoring Protocol (SNMP). By installing and activating an SNMP agent on your BS2000 mainframe, you can get any system monitoring tool to spot and track your mainframe.
Network performance monitors use SNMP to poll all network devices for statuses. This means that you don’t need to extract data to import into your monitor, the performance monitor gathers the data automatically over the network. These tools can also store performance metrics for analysis. An SNMP-based tool will enable you to monitor your network and servers along with your BS2000 mainframe and these systems all include threshold assessment with alerts.
You can find out more about SNMP and the monitoring tools that use it by reading the Best SNMP Monitoring Tools Plus SNMP Guide. All of the available SNMP-based monitors will track your Fujitsu mainframe over the network from another device. As well as on-premises packages, you will find that there are cloud-based platforms available. These enable you to monitor multiple sites from anywhere with dashboards that can be accessed through any standard Web browser. These tools allow you to centralize monitoring in one operations center for all of your IT systems.
Monitoring IBM Z Series mainframes
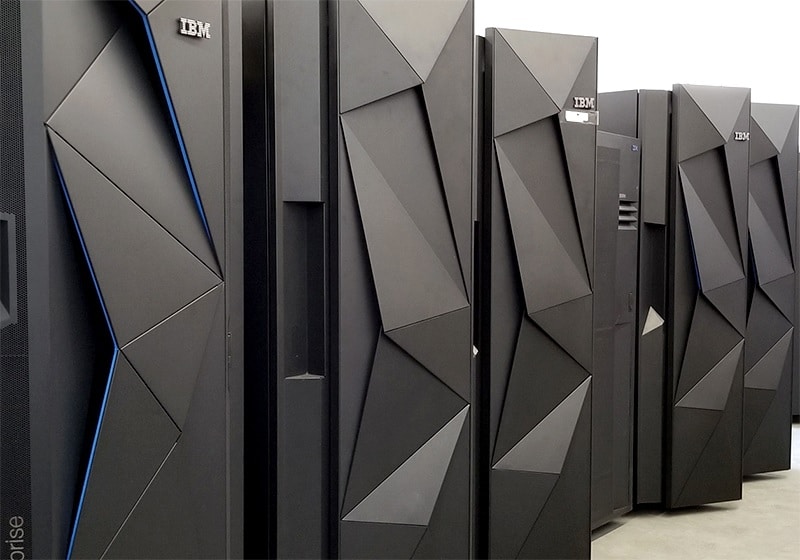
Several monitoring system providers offer remote monitoring for IBM Z Series mainframes. These providers also offer monitoring modules for other IT systems, such as networks and applications. Although mainframe monitoring is offered as a separate module by these providers, their platforms allow different units to be slotted together, so you can get a single dashboard to monitor all of your systems.
IBM z/OS also has a native SNMP agent. That gives you many more options for monitoring your mainframes. You should check out our SNMP Guide for more information on monitoring mainframes via the Simple Network Management Protocol.
Automated monitoring
Setting up automated monitoring for your mainframe drastically reduces the time and effort that you need to implement mainframe performance management. If you set up the alert thresholds in your monitoring package, you don’t even need to pay attention to your mainframe’s performance statistics. These monitoring tools can also forward alerts by email or SMS as notifications.
With an effective alerting system active in an integrated mainframe monitor, you can safely assume that the mainframe is running well unless you are notified that a performance safety buffer has been breached.
Implementing automated performance monitoring for your mainframe will release your hours for other tasks and prevent performance issues from evolving to a point where system response times are impaired. Take a look at Best Mainframe Monitoring Tools for more information.

