Internet Information Services (IIS) is a versatile and powerful web server solution developed by Microsoft. Available on both Windows and Windows Server, IIS is widely used to host websites, applications, and services in diverse environments, from small businesses to large enterprises. Its flexibility, integration with other Microsoft technologies, and reliability make it a popular choice for web hosting.
Here’s our list of the best third-party tools for using with IIS Windows Web Server:
- ManageEngine Applications Manager EDITOR’S CHOICE A server and application monitoring system that includes specialized screens for IIS monitoring. Runs on Windows Server and Linux.
- Datadog Infrastructure with IIS integration (FREE TRIAL) This is a cloud-based monitoring system that tracks the connections between applications and services and includes specialized IIS monitoring.
- ManageEngine EventLog Analyzer (FREE TRIAL) This package of log management and analysis services creates a SIEM for protecting many applications, including IIS. Runs on Windows Server and Linux.
- Site24x7 (FREE TRIAL) This cloud-based package provides real-time visibility into network devices, including hardware firewalls.
- Paessler PRTG Network Monitor (FREE TRIAL) This monitoring system is ideal for IIS management because it monitors network and server statuses as well as application performance.
- Dynatrace A cloud-based monitoring service that can watch the performance of servers, applications, and services, including IIS.
- AppDynamics A SaaS package that has excellent fault investigation tools for IIS.
- SolarWinds Server & Application Monitor Monitors servers and the applications that run on them, including IIS sites.
- IIS Crypto A free extension for IIS that enables you to change IIS statuses, features, and services.
- G Enterprise Uses external agents to monitor the performance of IIS-based websites.
IIS supports a broad range of protocols, including HTTP, HTTPS, FTP, and SMTP, and is compatible with frameworks like ASP.NET, PHP, and Node.js, making it ideal for hosting dynamic web applications. Whether you’re managing a single website or a complex, multi-tiered application, IIS provides the tools needed to deliver a reliable and scalable web presence.
However, to ensure optimal performance and availability, monitoring IIS is essential. A properly monitored IIS server helps administrators detect and address performance bottlenecks, resource constraints, and security vulnerabilities before they impact users.
Monitoring key metrics such as response times, CPU and memory usage, error rates, and traffic levels provides invaluable insights into the server’s health and ensures smooth operation. Additionally, proactive monitoring aids in capacity planning and helps maintain compliance with service-level agreements (SLAs).
This guide will take you through the process of setting up and using IIS on Windows and Windows Server. Whether you’re deploying IIS for the first time or looking to optimize an existing installation, this guide covers everything you need to know – from installation and configuration to best practices for monitoring and maintenance. By following this guide, you’ll be equipped to leverage IIS effectively while keeping your web server secure, responsive, and reliable.
Version History
Generally speaking, the last version of IIS that is suitable for an enterprise environment is IIS 6 or Microsoft Windows Server 2003. If you try to use any later version of the product you will struggle to function within a fast-paced environment. Below we’ve included a brief breakdown of the version history:
| Version | Information/ Additional Features |
|---|---|
| IIS 6 (Windows Server 2003) | Support for IPV6 but no future updates |
| IIS 7 | Available with Windows Vista with more security and support for .NET framework |
| IIS 7.5 | Available with Windows 7 with support for TLS 1.1 and 1.2 |
| IIS 8 (Windows Web Server 2012) | Support for SNI and offers general support until 2023 |
| IIS 8.5 | Available for Windows 8.1 with more login capabilities and dynamic site activation |
| IIS 10 | Beta with support for HTTP/2 and PowerShell 5.0 |
As it stands, IIS 8.5 is the best version in terms of security and features. Once the beta has been completed for IIS 10 then we recommend you make the transition.
How to Install and Configure IIS Server Software
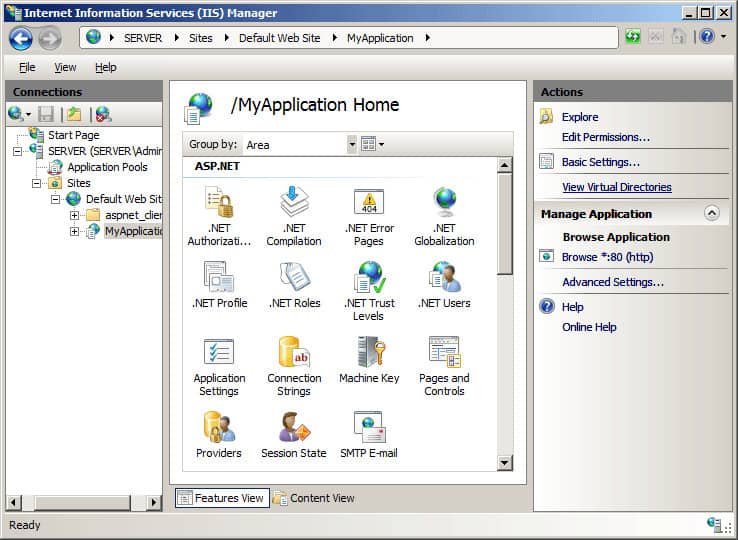
It may surprise you to know that while IIS server does come with Windows it isn’t accessible unless you install it. However, the installation and configuration process is relatively straightforward.
- To begin, open the Control Panel and click Add or Remove Programs.
- Next click Add/Remove Windows Components.
- Check the Internet Information Services (IIS) box and click Next.
- Click Finish.
As you can see, the basic installation process is swift. Once you’ve installed IIS server it is time to configure it.
If you want to use PowerShell to install IIS Windows server then you can do this by entering the following command:
< PS C:\> Install-WindowsFeature -Name Web-Server -IncludeManagementTools >See also: Powershell Cheatsheet
How does IIS server work?: IIS Processing Model
As a web server IIS has its own Process Engine that handles all requests from client to server. Essentially a client sends a request to the server and then IIS processes that request and sends a response to the client. The processing architecture of IIS can be separated into two distinct layers:
- Kernel Mode – Executed code has complete access to connected hardware and can execute any command. Kernel Mode is mainly used for trusted processes. Crashes in Kernel Mode are devastating to the overall system. You can find HTTP.SYS within Kernel Mode.
- User Mode – In this mode, any code you execute are commands short of accessing hardware or reference memory. This affords an extra layer of protection against mistakes and can be recovered much more quickly. When you execute code in user mode it delegates APIs to interact with hardware and reference memory instead. In User Mode, you’ll find Web Admin Service, Virtual Directory, and Application Pool.
Kernel Mode has the job of using HTTP.SYS to accept requests from a client and forwarding them on to an application pool. This is initiated when the client clicks on or enters the site URL, and requests access to the page. HTTP.SYS captures these requests and adds a queue for each application pool.
Once a request has been forwarded to the application pool, the Worker Process or w3wp.exe (outlined below) loads the ISAPI filter. Depending on the request, the Worker Process opens HttpRuntime.ProcessRequest and if it is an APSX page loads “aspnet_isapi.dll” as well.
The launch of Http.Runtime.ProcessRequest shows that processing has begun. The HttpRuntime process builds a pool of HttpApplication objects, which are then passed on through HTTP. HTTP Modules continue to be activated until the request reaches the HTTP handler of the ASP.NET page. Once the request has passed on through the HTTP route, the page starts.
As you can see, the Worker Process and the Application Pool are two fundamental concepts in the world of IIS. Below we’re going to look further at what these two concepts actually mean:
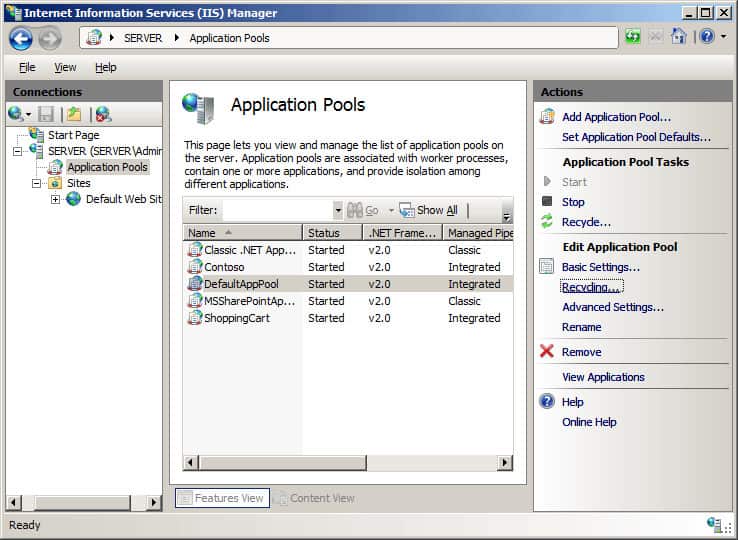
Application Pool
On the other hand, the Application Pool acts as a container. It contains the Worker Process and segregates multiple applications from each other. This is true whether they are running on one or multiple servers. One application pool can contain multiple websites. Putting it another way, an application pool is basically a group of URLs that have been served by worker processes. Separating applications from one another simplifies management and ensures that if one application pool experiences an error, the others do not.
Configuring IIS Server Software
- Locate the My Computer icon on your desktop and click Manage.
- Click on the Services and Applications option in the Computer Management box.
- Click on Internet Information Services and then Web Sites.
- If your default node hasn’t started, right-click on the Default Web Site node.
Configuring IIS Websites and Active Directories
One of the main reasons why people use IIS is to deploy web applications. With IIS and the Advanced Installer utility, you can deploy web applications on multiple servers very quickly. This also has the advantage of eliminating the need to add new configurations for each machine.
The first step when configuring websites is to open the Files and Folders view. From here you can examine your current application files and add new ones. You want to make sure that your application files are placed in their individual directory (The admin panel of the website you connect to will use these later).
Once you’ve done this switch to the IIS Server view and enter your new website name using the New Web Site toolbar.
At this point, you need to configure your website settings for HTTP and HTTPS. You also need new SSL options for your website. In the section below we show you how to configure a website or folder with SSL and HTTPS:
- Log on to your computer as an Administrator.
- Press Start and go to Settings. Click Control Panel.
- Double-click on Administrative Tools and Internet Services Manager.
- In the left-hand pane select the website you want to configure.
- Right-click on your website (or folder or file) that you want to configure SSL for and click Properties.
- Click on the Directory Security tab.
- Select Edit.
- To add SSL as a requirement, click Require Secure-Channel (SSL).
- Next click Require 128bit Encryption.
- (Optional) If you want users to connect regardless of whether they have a certificate, click Ignore client certificates. If you want to block users without a certificate, select Accept client certificates.
Securing IIS Web Server with Secure Sockets Layer (SSL)
Most enterprise users are naturally going to want to secure their data against unauthorized access. This can be done through the use of SSL. SSL allows you to encrypt all the data that you transmit. This prevents any outside entities from getting access to data they don’t have permission. To use SSL to secure your server, you need to install a server certification on the server machine. The first step to enabling SSL is to create a certificate. This can be achieved by following the steps below:
- Install Windows Server 2003.
- Ensure that you have IIS Web server installed and configured.
- Install Microsoft Certificate Services (this allows you to create authentication certificates).
- Open Internet Explorer and browse for Microsoft Certificate Services (http://MyCA/certsrv).
- Click Request a Certificate and click Next.
- Next click Advanced request.
- Click Next, then submit a certificate request to this CA using a form. Click Next. This will raise the certificate request form and add the domain name of your server machine.
- Now click Server Authentication Certificate in the Intended Purpose or Type of Certificate Needed field.
- Select either Microsoft RSA SChannel Cryptographic Provider, Microsoft Base Crypto Provider version 1.0 or Microsoft Enhanced Cryptographic Provider. (Take extra care not to select Microsoft Strong Cryptographic Provider).
- Select the Use Local Machine store box and verify that Enable Strong Private Key Protection is unchecked.
- Click Submit. Now you will either have the certificate installed immediately or you will have to wait for it to be administered by the CA administrator.
Designating an SSL Server Certificate to a website
To add an SSL server certificate to a website:
- Open IIS Manager, click on Local Computer, and then the Web Sites folder.
- Look for the website that you want to assign the certificate to and right-click Properties.
- Next, click the Directory Security section and click Server Certificate. (You’ll find this under Secure Communications).
- Raise the Web Server Certificate Wizard and press Assign an existing certificate.
- Complete the Web Server Certificate Wizard process. Once completed, go to the Properties page, select the Directory Security tab and press the View Certificate button (here you can view more information about the certificate).
Virtual Directories
IIS web server not only allows you to create sites and applications but also allows you to create virtual directories. In IIS you specify a name that maps to a physical directory. The direct name provides users with a way to access the content hosted on a server quickly. In many cases, this is another website, but it can be smaller media elements like photos and videos.
In the older IIS 6.0, virtual directories and applications were considered to be separate objects. An application was comprised of the following metabase components:
- AppFriendlyName
- AppRoot
- AppIsolated
- AppPoolID
As of IIS 7.0 and after, virtual directories and applications are still considered as separate objects but they also exist in a hierarchy. For example, one website can contain multiple applications. In turn, one website can contain multiple virtual directories that lead to a physical directory on a computer.
Log Files
Log files are used to record a variety of actions on your server. Loading up the log files will show you everything from the date and time of the event, the IP address involved, and the quantity of data transmitted. Most of the time your log files can be found here:
< %SystemRoot%\system32\Logfiles\ >On most contemporary versions of IIS Windows server, you can find your IIS log files by performing the following actions:
- Click Start and Control Panel.
- Click Administrative Tools and run Internet Information Services (IIS).
- Look for your website on the left-hand side of the tree and select it.
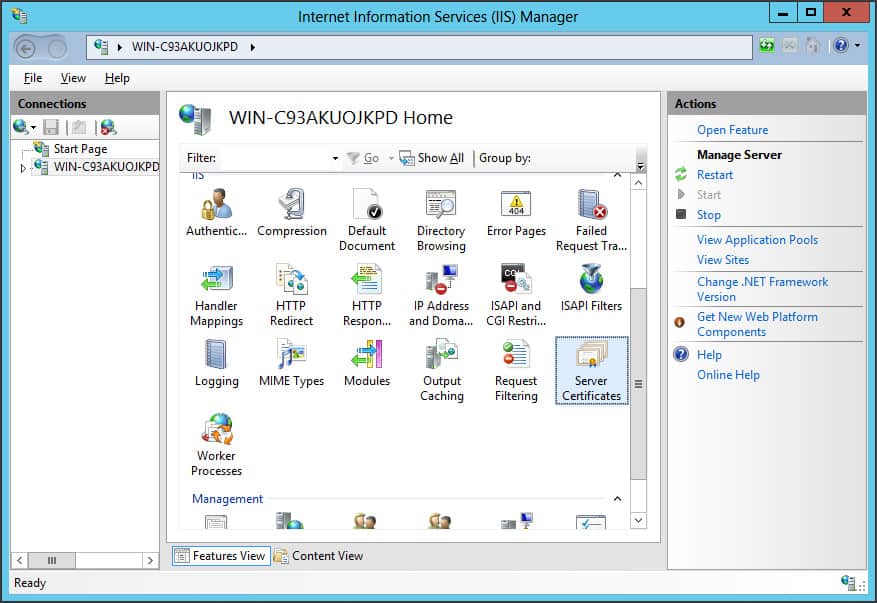
- Next, click the Logging icon.
- Look for the dialog box at the bottom of the screen that says Directory, and click Browse.
If you’re using IIS 6 then:
- Go back to step 3 of the instructions above.
- Right-click on your website and click Properties.
- Find the Website tab and look for the Active Log Format section.
- Click the Properties button and look at the bottom of the box where the log file directory and log file name are shown.
Ports
Generally speaking, your server will use port 80 for all of your HTTP traffic. However, if this isn’t suitable for your needs, then you can change it as required. You can do this by following the steps below:
- Open Internet Information Services (IIS Manager).
- Right-click on your website then press Properties.
- In the Properties window find the TCP port box and change it to a port of your choice.
Please note that if you change the port from the default setting when you go to open up your website, you will need to enter your domain name and the new port. For example: domainname:80 (type the number of the port you wish to use instead of 80).
Windows 8 and 8.1
On Windows 8.1 there are a couple of differences:
- Type IIS Manager into the Search Box on the homepage.
- Select Internet Information Services Manager in the search results.
- On the left-hand side of the screen you’ll see a navigation tree; click Default Web Site.
- Next, go to the sidebar on the right-hand of the screen and click Bindings.
- Highlight http from the main view and click Edit.
- Enter the new port you want to use in the Port text box.
- Press Ok and click Close.
- Go back to the left-hand tree and select the relevant server node.
- Finally, click Restart Server from the sidebar on the right-hand side.
The Best Third-Party IIS Server Tools
Our methodology for selecting an IIS Web server monitor
We reviewed the market for Windows Web server monitoring systems and analyzed the tools based on the following criteria:
- Tracking of IIS operations
- Monitoring of hosting server resources
- SSL certificate management
- Connection monitoring
- Tracking of demand on the Web server
- A free trial or a demo option for a no-cost assessment opportunity
- Value for money, represented by a reliable tool that can interface directly to IIS and is offered at a fair price
With these selection criteria in mind, we looked for application and server monitoring packages that include specialized IIS integration.
1. ManageEngine Applications Manager (FREE TRIAL)
ManageEngine implements IIS monitoring within its Applications Manager software package. This monitoring tool can also track the performance of the Apache Web Server.
Key Features:
- Application dependency mapping
- IIS and Apache Web server integrations
- Performance tuning
- Server resource monitoring
Why do we recommend it?
ManageEngine Applications Manager provides scanning to identify all of your applications and populates the console with a list of what it needs to monitor. The tool also identifies which applications access other applications and also which services and resources support each application. This is great for IIS, which can be a choke point for application delivery.
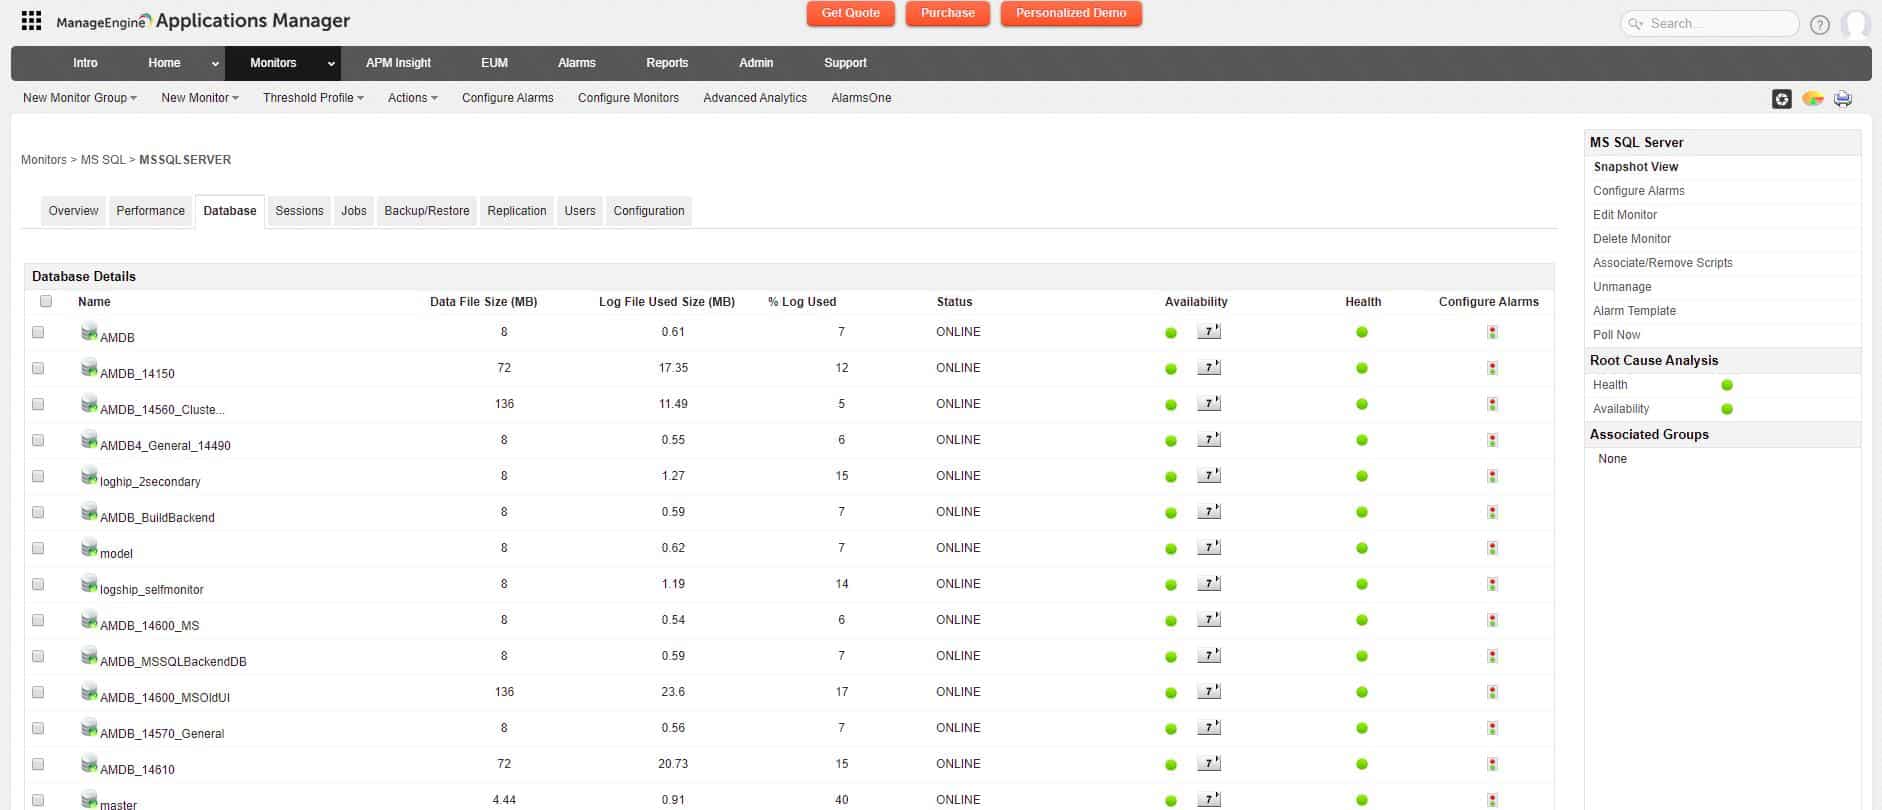
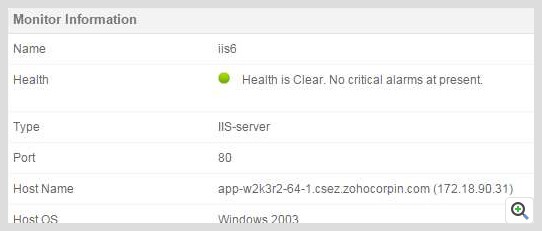
Live status monitoring for IIS includes Application Pool monitoring. The main screen of the IIS monitor lists all operating application pools with a traffic light system that shows the availability and health of each. The system manager can then drill down into each application pool, should problems be indicated. The structure of the monitoring screens means that managers don’t get trapped by only viewing one part of the system and miss critical problems shown in other data screens.
An alerting system means that technical staff don’t have to sit and watch the Applications Manager screens. They can get on with other tasks – many of which would be supported by analytical and performance tuning utilities included in Applications Manager. Performance thresholds are set at levels that allow time for remedial action should problems arise.
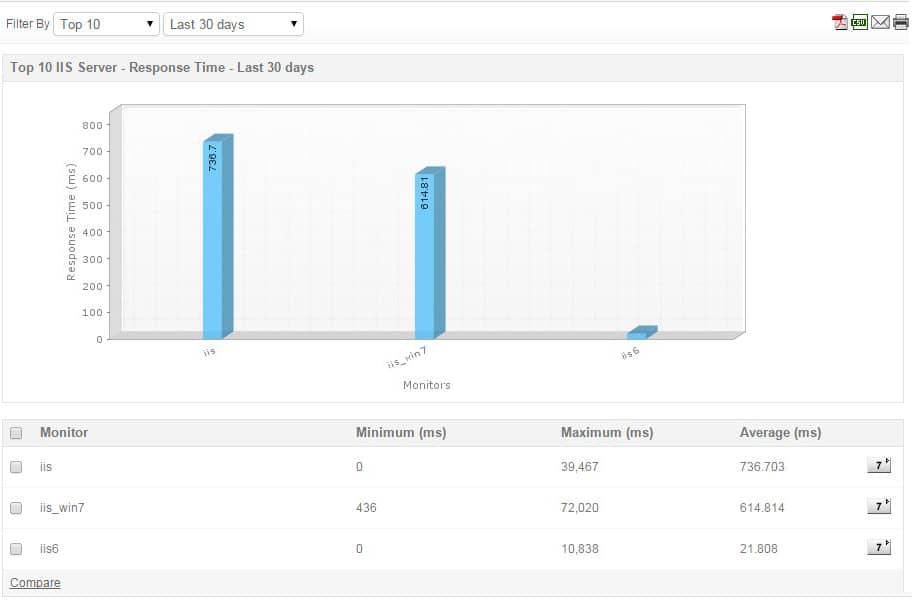
Factors covered in Applications Manager screens for IIS include website uptime and response times recording. Other statistics include transfer speeds, connection statuses, counts of users and anonymous visitors, and page code accesses.
The Applications Manager also monitors physical server performance. So, it gives live feedback on server load and the interactions between IIS and its underlying support services. Key metrics such as disk and memory availability and usage and I/O speed are shown live in the application monitoring screens.
Who is it recommended for?
This monitoring tool can run on Linux or Windows Server – it tracks applications from across a network. It is also available as a service on AWS and Azure. There is a Free edition, which can only monitor five assets and that might not be enough to watch over IIS and its associated services.
Pros:
- Offers on-premise and cloud deployment options, giving companies more choices for install
- Can highlight inter-dependencies between applications to map out how performance issues can impact businesses operations
- Offers log monitoring to track metrics like memory usage, disk IO, and cache status, providing a holistic view into your database health
- Includes monitors and dashboards tailored for IIS monitoring
Cons:
- Can take time to fully explore all features and options available
The Applications Manager installs on Windows Server and Linux. ManageEngine makes the tool available for a 30-day free trial.
EDITOR'S CHOICE
ManageEngine Applications Manager is our top pick for a IIS monitoring tool because it offers a comprehensive and easy-to-use solution that provides in-depth monitoring of IIS servers and web applications. With its wide range of features tailored to web server management, it enables IT teams to ensure high availability, optimize performance, and quickly troubleshoot issues. One of the key strengths of ManageEngine Applications Manager is its real-time monitoring of IIS performance metrics such as request rates, response times, CPU usage, memory usage, and error rates. These metrics are essential for ensuring that IIS servers are running efficiently and meeting user demands. The tool also allows for detailed transaction monitoring, helping administrators track and optimize web application performance by identifying slow or failing processes. Alerting and notifications are a crucial aspect of ManageEngine Applications Manager. It provides customizable thresholds and automated alerts when issues arise, enabling IT teams to respond swiftly before problems affect end-users. This proactive approach helps prevent downtime and minimizes the impact of potential server failures. The user-friendly dashboard in ManageEngine Applications Manager makes it easy to visualize IIS server performance, and its integration with other network monitoring tools allows for centralized management of multiple systems. The tool also offers detailed reporting capabilities, which help administrators analyze long-term trends, identify bottlenecks, and improve server efficiency.
Download: Get a 30-day free trial
Official Site: https://www.manageengine.com/products/applications_manager/download.html
OS: Windows Server, Linux, AWS, and Azure
2. Datadog Infrastructure with IIS Integration (FREE TRIAL)
Datadog Infrastructure is a cloud-based monitoring system that traces the performance of applications and service that lie behind user-facing interfaces, such as websites.
Key Features:
- SaaS package
- Specialized IIS screens
- Connection monitoring
Why do we recommend it?
Datadog Infrastructure is a cloud-based system and it watches over all of the IT Bassets that support your systems between the user-facing applications and servers. The remit of this tool includes Web servers, such as IIS. The system is provided as a SaaS package. It is also able to monitor serverless functions.
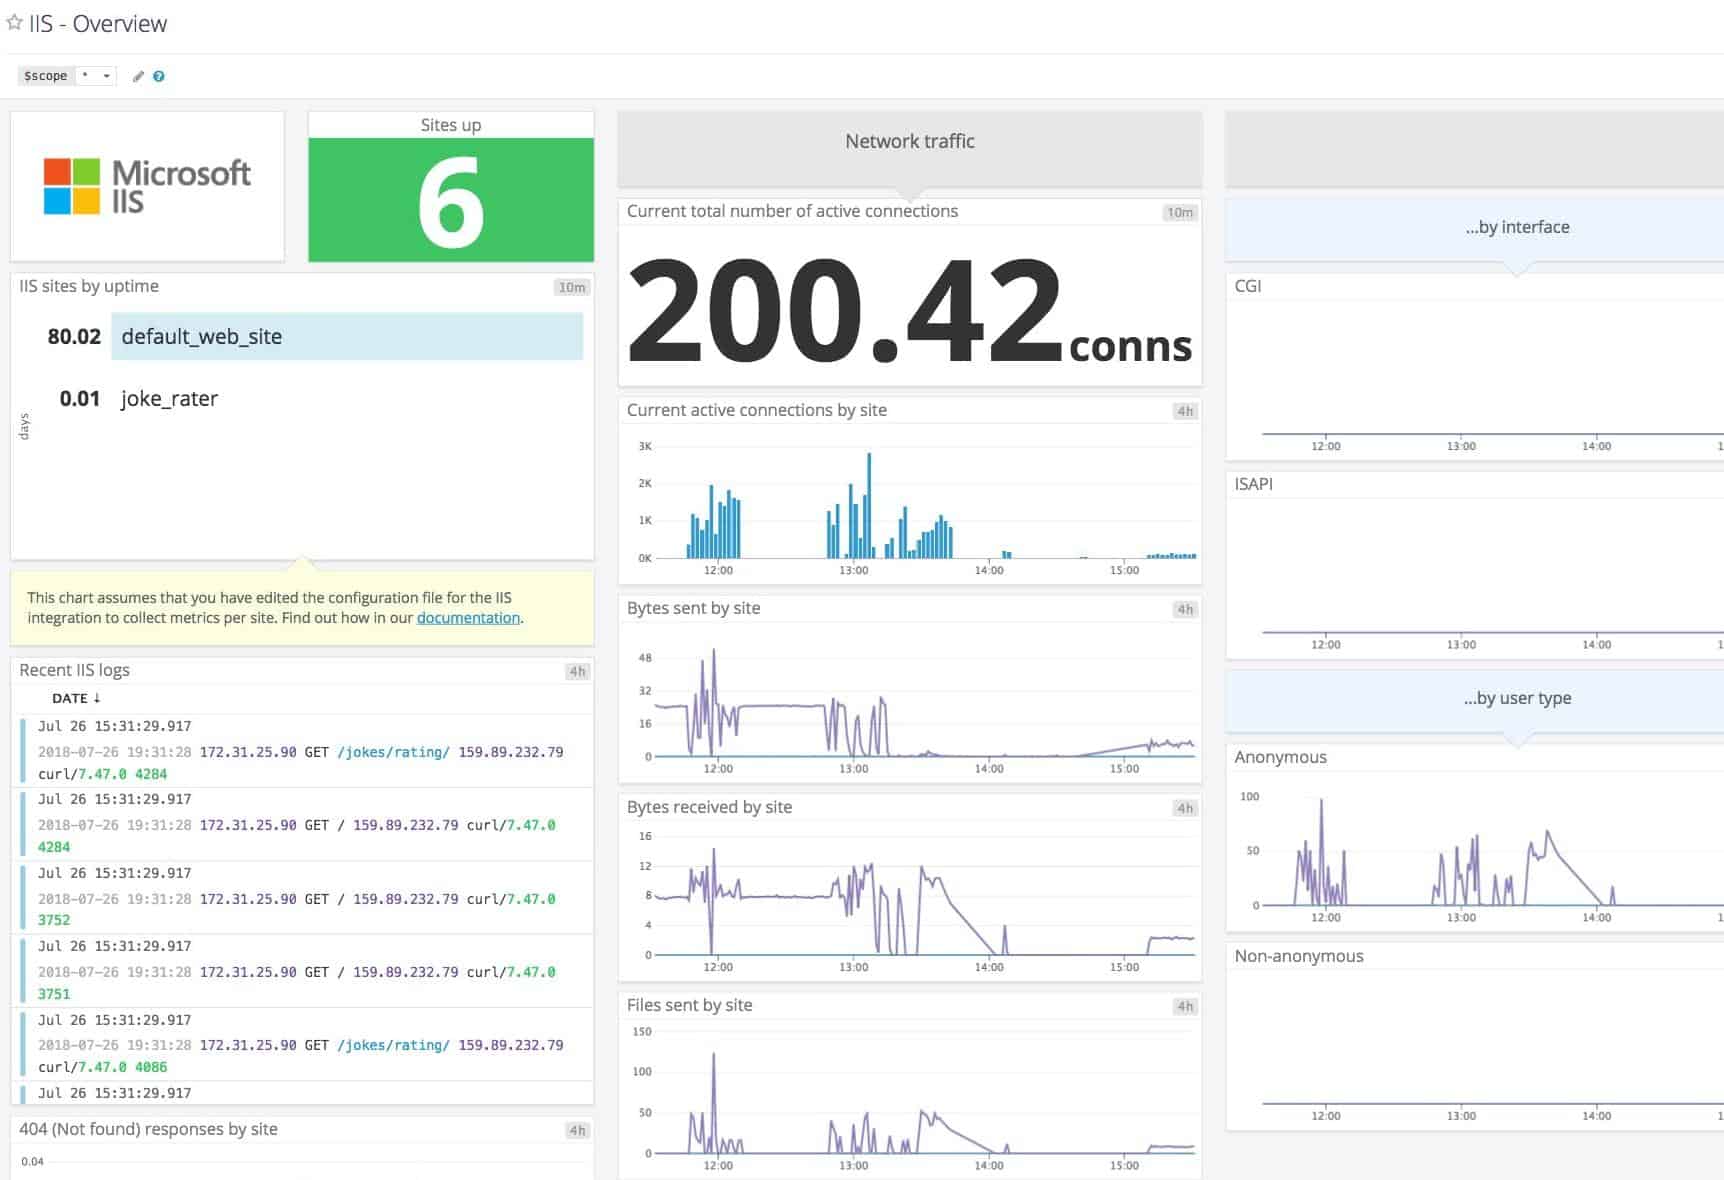
The system, in its bare form, tracks basic services. However, the system can be expanded by integrations. There is an integration for IIS. The benefit of the integration system is that it avoids the dashboard for the system being cluttered with functions that monitor services that the customer doesn’t have. By this strategy, the subscriber adds on integrations for all relevant services when beginning a subscription to the monitoring system. The result of this adaptation process is a tailored monitoring service that focuses on just the applications and services that the subscribing business uses.
The IIS monitor tracks more than 180 metrics about the web server’s operations. The type of data that the monitor collects concerns the proper functioning of the services performed by IIS, such as managing connection and maintaining applications, such as HTTP. The dashboard shows connection counts in terms of requests served, those rejected and the number of connections dropped. The system notes service availability, latency, response times, and function calls.
As well as monitoring the IIS Web server, the Datadog Infrastructure service keeps track of the performance of load balancers and network services.
Who is it recommended for?
The Datadog Infrastructure is priced per host, that is, per physical server, which makes it accessible to all sizes of businesses. The Free edition is particularly appealing to small businesses – it will monitor up to five hosts with a data retention period of just one day. However, it will track the performance of IIS.
Pros:
- Easy to use customizable dashboards – displays IIS/web server metrics quickly
- Cloud-based SaaS product allows monitoring with no server deployments or onboarding fees
- Can monitor both internally and externally giving network admins a holistic view of network performance and accessibility
- Offers numerous other monitors – great for scaling your monitoring efforts to other systems
- Flexible pricing makes DataDog accessible to nearly all businesses
Cons:
- Would like to see a longer trial period for testing
Datadog Infrastructure is a subscription service with a rate per month per host, although most customers take the cheaper option of paying annually. There are three editions to the service and the first of these is Free. That option doesn’t get access to the IIS integration and it can only monitor five hosts. The two paid plans are Pro and Enterprise. The higher plan includes machine learning for performance baselining and premium support. You can get a 14-day free trial of the system.
3. ManageEngine EventLog Analyzer (FREE TRIAL)
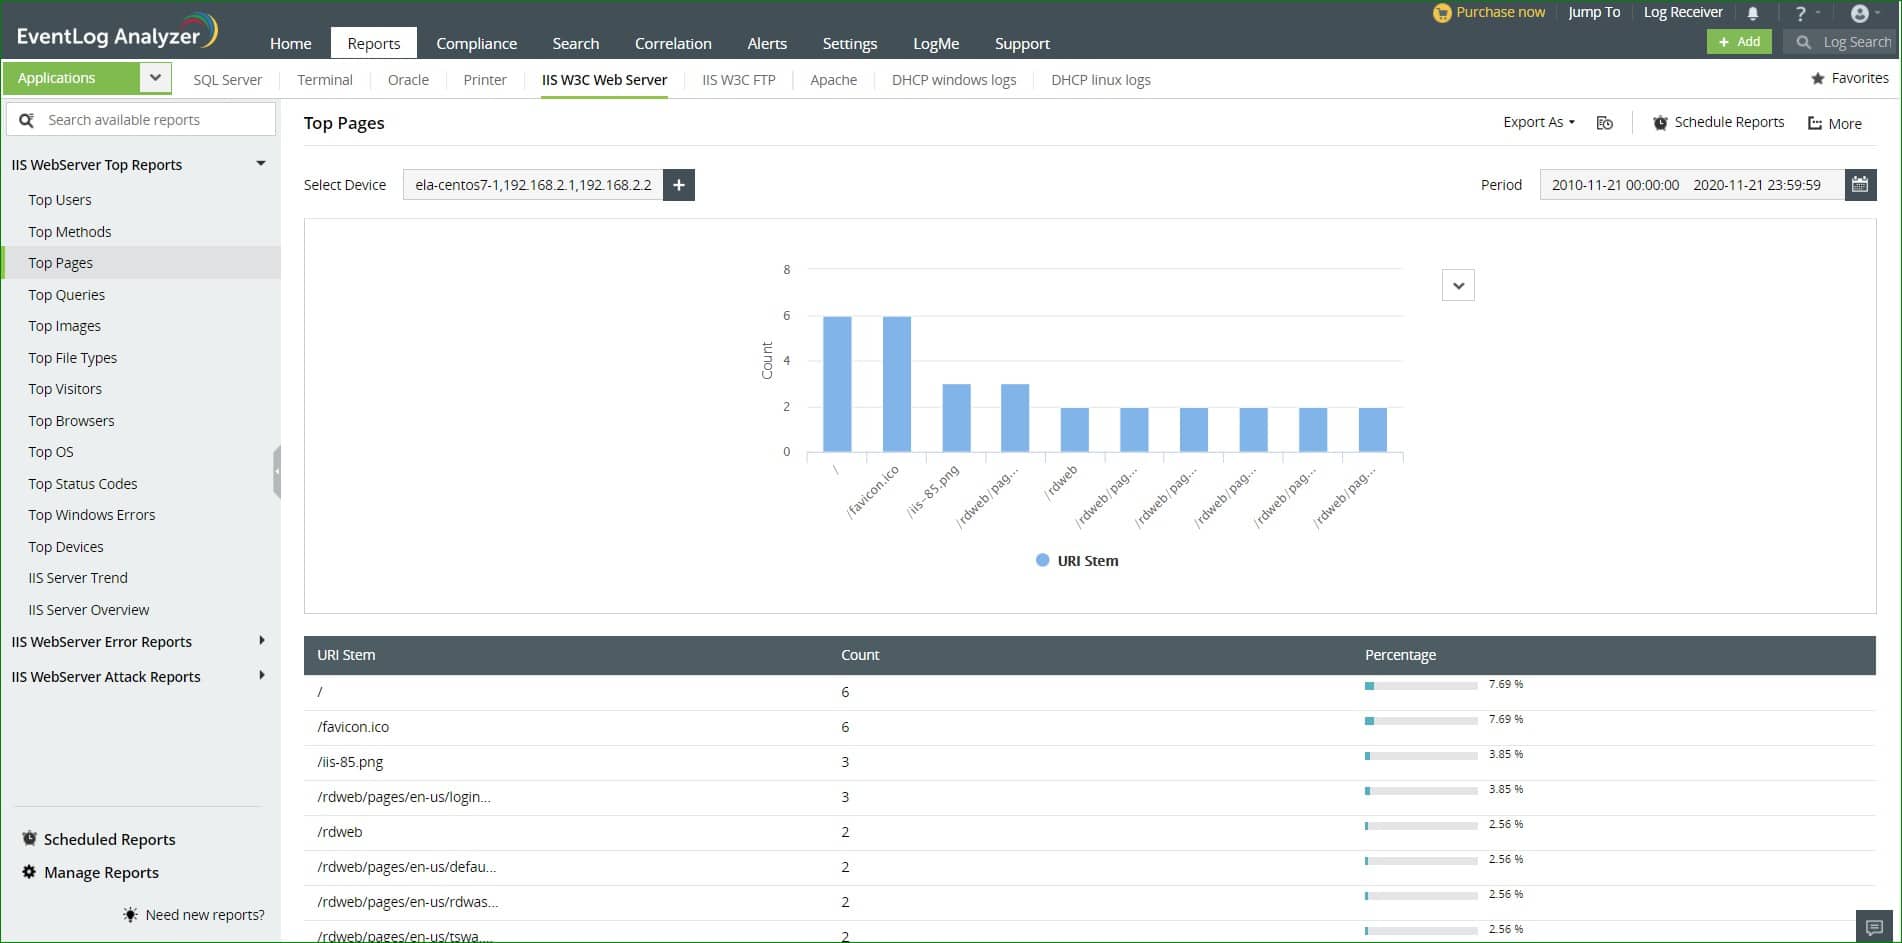
ManageEngine EventLog Analyzer provides a system-wide SIEM service for security monitoring and it has specific processes for tracking activity in IIS Web Server and IIS FTP Server. The service produces reports that can be viewed on screen. These display the top users of your Web server. You also get Web Server error reports and attack assessments for events such as DDoS attacks, cross-site scripting, and SQL injection.
Key Features:
- IIS activity reports
- Security breach detection
- Error monitoring
Why do we recommend it?
ManageEngine EventLog Analyzer provides activity monitoring, error reporting, and security monitoring for IIS Web Server and also monitors IIS FTP Server. The package is a log manager and SIEM system so you get system-wide security protection from this system. The tool also includes compliance auditing and reporting functions.
The ManageEngine system operates with data from your IIS logs, so it doesn’t interfere with regular operations of the server – it won’t slow your server down with data gathering routines. The logs are sent to the EventLog Analyzer’s log server, which consolidates those messages with logs derived from other sources so that they can be searched and stored together.
The source of each log message in the collection is tagged and so it is still possible to analyze IIS logs separately. The system’s IIS FTP Server analysis also provides activity reports and error reports. You also get a record of issues such as password changes or other account management actions.
Suspicious actions in both the IIS Web Server and the IIS FTP Server raise alerts and also mark out the user account for further investigations. You can specify that these alerts should be channeled into your Service Desk system for technician attention. It is also possible to set up playbooks for automated remediation. The Evenlog Analyzer can coordinate actions in third-party tools, such as access rights managers and firewalls.
The EventLog Analyzer system provides a threat intelligence feed, which includes an IP address blacklist, so you can block requests from those sources immediately. The package also includes network security monitoring.
Who is it recommended for?
There is a Free edition of the EventLog Analyzer but that only provides log management and won’t give you IIS security monitoring. However, the base package for this system is reasonably priced and accessible for small businesses. There is also a version for multi-site monitoring, so this system is suitable for use by businesses of all sizes.
Pros:
- IIS activity monitoring for Web and FTP systems
- Security monitoring that identifies attacks and intrusion
- Compliance reporting
Cons:
- IIS protection not included in the SaaS version
The software for EventLog Analyzer installs on Windows Server or Linux. The SaaS package for this module doesn’t include application log analysis and so won’t give you IIS protection. The on-premises EventLog Analyzer is available for a 30-day free trial.
4. Site24x7 (FREE TRIAL)
Site24x7 is a platform of system monitoring and management tools that is hosted on the cloud. The package includes an extensive network monitoring service that includes firewall status monitoring.
Key Features:
- Continuous Firmware Scanning: Regularly scans and monitors firmware versions across devices to detect known vulnerabilities and potential security risks in real-time.
- Vulnerability Database Integration: Leverages an extensive database of known firmware vulnerabilities, sourced from security advisories and public repositories, to provide accurate detection.
- Vulnerability Alerts and Notifications: Sends instant alerts for detected vulnerabilities, allowing teams to take timely action to mitigate risks and prevent security breaches.
Why do we recommend it?
Site24x7 offers comprehensive firewall monitoring that helps businesses ensure the security and performance of their network firewalls. It provides real-time monitoring of firewall health, traffic, and security policies, ensuring that firewalls are operating optimally and effectively blocking unauthorized access. This helps identify issues like congestion or misconfigurations, allowing quick corrective action to ensure network security.
With Site24x7’s firewall monitoring, administrators can track critical metrics such as throughput, packet drop rates, and connection counts, giving them detailed insights into the behavior of the firewall.
The package will scan through firewall logs, which helps detect potential security threats, such as unusual access patterns or unauthorized attempts to breach the network. The tool automatically parses and analyzes firewall logs, alerting administrators to any suspicious activity or security events. Site24x7 also tracks the status of firewall policies, ensuring that security rules are consistently applied, and firewall devices are running the latest firmware versions, keeping the network protected from known vulnerabilities.
Who is it recommended for?
Site24x7’s firewall monitoring is recommended for businesses of all sizes that rely on firewalls to protect their network infrastructure. It is especially beneficial for organizations with complex network environments, such as managed service providers (MSPs), data centers, large enterprises, and cloud-based companies. Companies in industries like finance, healthcare, and telecommunications, where network security is critical particularly need such a tool.
Pros:
- Policy Status Monitoring: Tracks the status of firewall policies and security rules, ensuring that they are correctly configured and enforced across the network.
- Firmware Version Monitoring: Monitors the firmware version of firewalls to ensure they are up-to-date with the latest security patches, reducing the risk of vulnerabilities.
- Alerting and Notifications: Sends instant alerts for any firewall performance or security issues, allowing administrators to take immediate action to resolve them.
Cons:
- No Self-Hosting Option: This is a cloud-based platform.
Site24x7 is a subscription service and there are many plans available. The Infrastructure Monitoring edition is one of the cheapest plans, starting at $9 per month. The MSP edition, which is designed for use by managed service providers, starts at $35 per month. The platform is available for a 30-day free trial.
5. Paessler PRTG Network Monitor (FREE TRIAL)
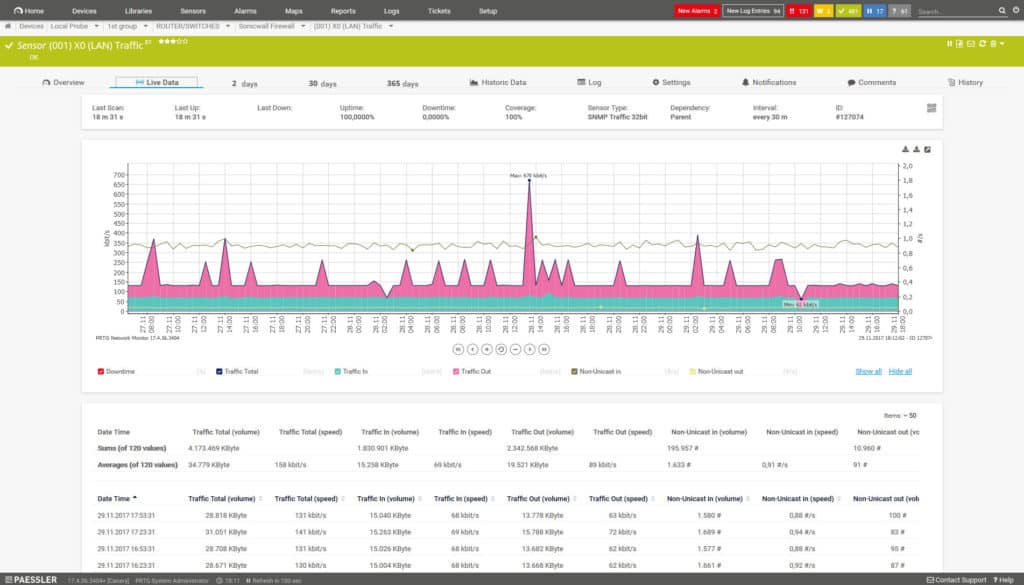
PRTG Network Monitor is a free network monitoring tool that can be used to monitor IIS services. With PRTG Network Monitor you can use the dedicated Windows IIS Application Sensor to monitor sent and received bytes per second, number of sent and received files per second, number of anonymous and known users per second, number of common gateway interface requests per second, and more.
Key Features:
- IIS source code analysis
- Network and application interactions
- Server resource monitoring
Why do we recommend it?
Paessler PRTG Network Monitor doesn’t only monitor networks. It also tracks the performance of networks, applications, and services, including IIS. This flexible package is a bundle of monitoring tools, called “sensors” and you decide which of these to turn on. You can combine IIS monitoring with performance tracking for many other assets.
While monitoring IIS Windows server performance can be challenging, PRTG Network Monitor analyzes performance right down to the application source code. For instance, PRTG Network Monitor measures the loading time of the source code to spot problems as early as possible.
Likewise, alerts can be configured to alert you once a predefined threshold has been crossed. Alerts are sent to your email, SMS, or mobile device (through push notifications) to make sure that you’re always up-to-date.
PRTG Network Monitor can also monitor physical hardware performance. In many instances, the performance of physical hardware will have a tremendous impact on the performance of IIS services. As such, using PRTG Network Monitor’s infrastructure monitoring capabilities to track hardware CPU and memory can catch performance issues in their infancy.
The performance monitoring experience offered by PRTG Network Monitor is perfect for enterprises on a shoestring budget. PRTG Network Monitor is free up to the first 100 sensors.
Who is it recommended for?
The software for PRTG installs on Windows Server and it is also available as a SaaS platform. You pay for an allowance of sensors with the minimum quantity being 500. If you only want 100 sensors, you don’t have to pay anything. This makes PRTG a great tool for small businesses.
Pros:
- Uses both premade and customizable sensors to monitor web servers and IIS
- Drag and drop editor makes it easy to build custom views and reports
- Monitors both network and server metrics – provides a more holistic view
- Supports a free version
Cons:
- Is a very detailed platform with many features that require time to learn
However, there are several paid versions available for larger organizations. Paid versions of PRTG Network Monitor start at $1600 (£1,233) for 500 sensors. You can download a 30-day free trial.
6. Dynatrace
Dynatrace is an application monitoring platform that can monitor IIS server performance. Through the dashboard, you can view the availability of existing web servers and delve down into web server process groups.
Key Features:
- Service dependency monitoring
- Response time metrics
- Interactive mapping
Why do we recommend it?
Dynatrace is a SaaS package that has a discovery service at its heart. The system creates a dependency map that shows how services such as IIS fit into the entire IT asset landscape of a business. This enables the package to monitor multiple applications and services simultaneously and generate predictive alerts.
For instance, you can see active services and dependent applications with information like the application version immediately visible. Once you install the Dynatrace Agent you can also see All Requests, Response times, Response sizes, Active threads, CPU usage, and memory usage.
The fast-track configuration capabilities of Dynatrace make it a powerful tool. There is an autodiscovery feature that can automatically detect IIS web servers in your network. All you need to do is install one agent and Dynatrace will do the rest of the work for you. These services are then displayed to you on an interactive map so that you can view your IIS architecture in more detail.
Another great feature is the ability to visualize IIS service requests. On the Service Flow screen, you can view an IIS service from start to finish. Here you are shown a chart that details each service request type. This feature allows you to see what processes contribute to the response time of IIS.
Who is it recommended for?
Dynatrace is suitable for all sizes of businesses. However, those companies that have very many applications to manage would benefit the most from the system. It is able to monitor cloud services as well as on-premises software and servers. The tool isn’t so great at monitoring networks.
Pros:
- Sleek, customizable interface
- Track IIS metrics such as incoming requests and response times
- Can visualize complicated physical connections with ease
Cons:
- Better suited for larger enterprise networks
- Would like to see a longer 30-day trial period
For end-to-end IIS monitoring, Dynatrace is one of the top performance monitors on the market. To find out the price of Dynatrace you’ll have to contact the company directly. However, there is a 15-day free trial.
7. AppDynamics
AppDynamics is an application performance monitoring solution that offers a flawless IIS monitoring experience. AppDynamics monitors the throughput, memory usage, Disk I/O, and CPU utilization of IIS web servers. The platform is straightforward to deploy and can be installed in just a few minutes.
Key Features:
- Traffic throughput
- Server resource tracking
- Traffic flow mapping
Why do we recommend it?
AppDynamics is a strong competitor to Dynatrace. Both systems deploy AI and provide predictive alerts. Like Dynatrace, AppDynamics is able to monitor IIS alongside many other applications and it watches all applications and services simultaneously. This tool will also combine the monitoring of cloud and on-premises services in one console.
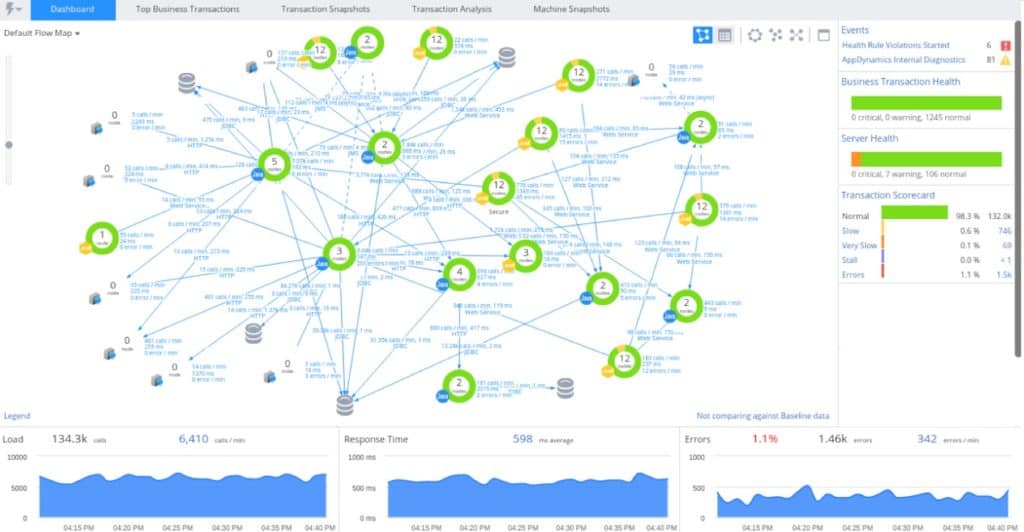
The user interface is extremely user-friendly. IIS applications are automatically discovered and displayed as part of a flow map. The flow map displays the transactions that are occurring with a web server or application.
If you want to view memory information then clicking the memory tab will show you the real-time memory utilization of your resources. This information is displayed as line graphs so that you can view the change over time.
Where AppDynamics excels as a IIS monitoring solution is in its diagnostic capabilities. The tool automatically provides you with code-level data if an application is slow or a bottleneck is detected. By viewing the code execution you can see where the problem originated and find a solution.
Who is it recommended for?
AppDynamics offer a basic plan, called Infrastructure, which will track the performance of your network, servers, and services, such as Web servers and databases, but you don’t get an application dependency map. Nevertheless, this plan is very cheap and a good choice for small businesses that don’t have many applications to track.
Pros:
- Tailored for large-scale enterprise use
- Excellent dependency mapping and visualizations to help troubleshoot complex application systems
- Leverages AI and machine learning to provide root cause analysis and remediation steps
Cons:
- Would benefit from a longer 30-day trial period
- Many features are designed for larger more complex networks – not ideal for smaller networks
The root cause abilities of AppDynamics are essential for those who want a performance monitoring solution. AppDynamics supports Microsoft IIS Express 7.x, Microsoft IIS 6.0, Microsoft 7.0, Microsoft 7.5, and Visual Studio development server. You can download the 15-day day SaaS trial.
8. SolarWinds Server & Application Monitor

SolarWinds Server & Application Monitor is an application monitoring platform that can monitor IIS sites. With SolarWinds Server & Application Monitor you can see the availability of IIS servers and websites.
Key Features:
- Application monitoring
- Server resource monitoring
- IIS integration
- SSL certificate management
- Activity alerts
Why do we recommend it?
The SolarWinds Server and Application Monitor deals with IIS under its applications remit. This system is an on-premises package, so it needs to be able to access the server on which the IIS is hosted – it doesn’t need to be resident on the same machine. The tool measures ISS activity and server resource availability.
Key metrics like CPU usage, memory usage, response time, and disk usage can all be monitored with this tool. If there is a problem with a site then you can automatically restart it to try and fix the issue.
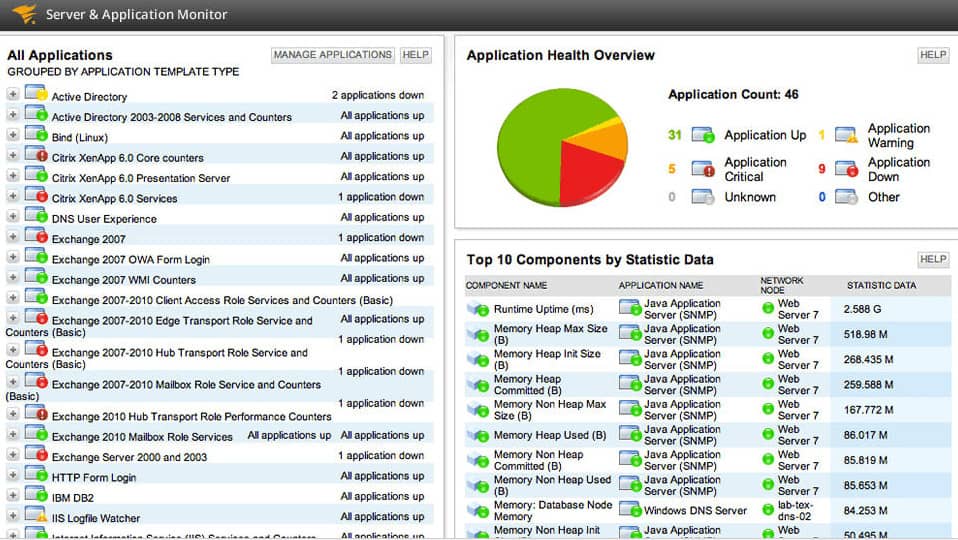
Graphs and status buttons drive the monitoring experience. Graphs show you details about resource usage and other information so that you can see how an IIS website or server is performing.
For example, graphs are outlining IIS Average CPU and Memory Usage to show how many resources you have available. This helps you to know whether you need to buy more resources or not.
Security-wise, SolarWinds Server & Application Monitor can monitor SSL certificate expiration. The tool can tell you the dates when your SSL certificates expire and the number of days you have left before that point in time. Having this information on hand makes it easy to manage SSL certificates for multiple sites or servers without running the risk of them expiring.
Who is it recommended for?
This package runs on Windows Server – which is the host of IIS. The package is large and covers a lot of other applications, not just your Web server. This means that it is suited for large organizations that run their own Web servers. The tool includes alerts for performance problems and resource shortages.
Pros:
- Offers pre-made templates, monitors, and dashboards for IIS and web server monitoring
- Offers a wide range of integrations into other monitors and security solutions
- Uses drag and drop widgets to customize the look and feel of the dashboard
- Robust reporting system with pre-configured monitors – great for quick insights
Cons:
- Designed for IT professionals, not the best option for non-technical users
As a performance monitoring solution for IIS, SolarWinds Server & Application Monitor has everything you need to manage IIS resources efficiently. It is also competitively priced, starting at $2,995 (£2,308). There is a 30-day free trial available.
Add on the SolarWinds Log Analyzer to get the most value out of your IIS logs. This is available together with the Server & Application Monitor in the Log and Systems Performance Pack, which is available for a 30-day free trial.
9. IIS Crypto
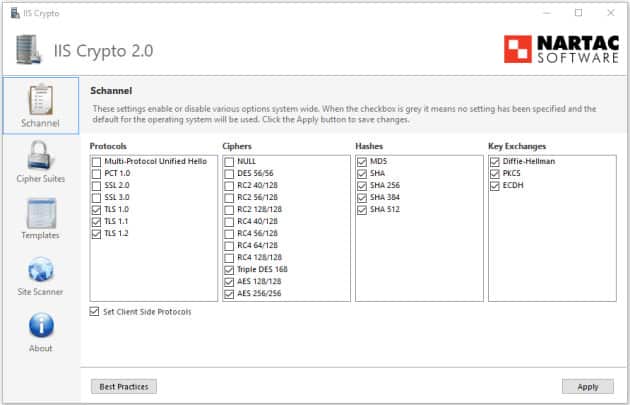
IIS Crypto is an IIS extension that can enable or disable protocols, hashes, and key exchange algorithms. The user interface is easy to use, with six main tabs: sChannel, Cipher Suites, Advanced, Templates, Site Scanner, and About.
Key Features:
- Extension to IIS
- Web server feature management
- Free to use
Why do we recommend it?
IIS Crypto is a free tool and it is more of a management system for IIS than a monitoring system. The tool operates as an add-on to IIS. The system in available as a GUI and also as a command line system. The tool lets you adjust IIS settings and manage TLS.
On the sChannel screen you can enable or disable different features and protocols. There are five lists you can interact with: Server Protocols, Ciphers, Hashes, Key Exchanges, and Client Protocols. On the Cipher suites page you can reorder cipher suites.
The next most notable feature is that of templates. You can create custom protocol templates that can be run on multiple servers. This helps to make managing multiple sites or applications more convenient. However, it is essential to note that you need to have administrator privileges to use IIS crypto.
Who is it recommended for?
Anyone that uses an IIS server will appreciate this tool. It is available for Windows Server versions up to 2022. The system helps those who aren’t top experts in managing IIS because it makes some of the obscure settings easier to find and update. However, can’t monitor IIS with it.
Pros:
- Completely free extension
- Designed specifically for IIS
- Improves upon basic IIS functionality
Cons:
- Not the best solution for those looking to scale their monitoring beyond IIS
One of the biggest perks of IIS Crypto is that it is completely free. IIS Crypto is available for Windows Server 2008, Windows Server 2012, Windows Server 2016, and Windows Server 2019. The software is available as a GUI or a command line interface. You can download IIS Crypto free of charge.
10. eG Enterprise
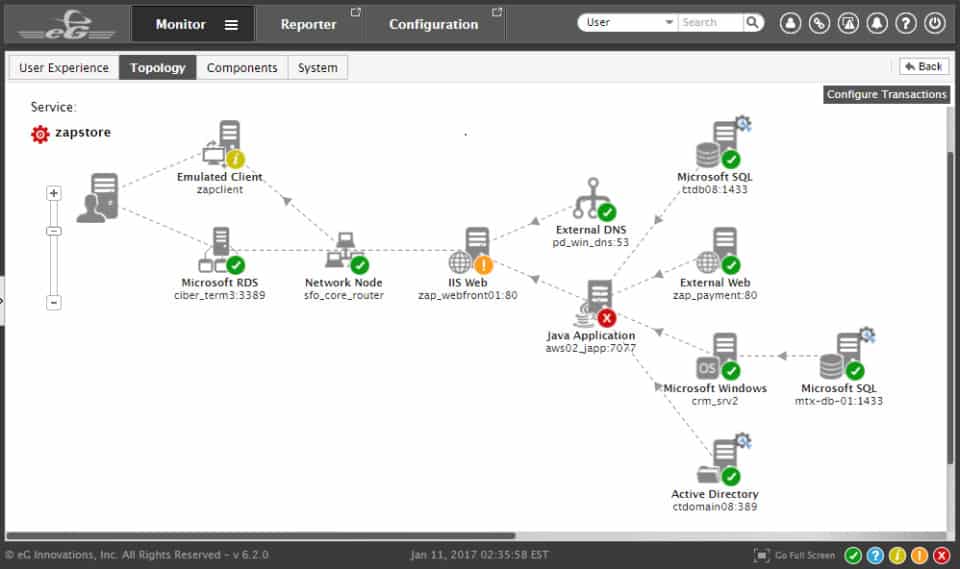
eG Enterprise is a performance monitoring platform with IIS monitoring. eG Enterprise monitors the availability and response time of transactions between IIS websites and users. Monitoring the user experience is eG Enterprise’s primary concern with IIS monitoring. The external agent tests the quality of the user experience in different locations by using request emulation and measuring the response time users are experiencing.
Key Features:
- Server-to-user connection tracking
- Response times
- Load monitoring
Why do we recommend it?
eG Enterprise from eG Innovations is a full stack monitoring package with each type of asset covered by its own module. The Infrastructure Monitoring unit includes IIS monitoring. This is a typical performance monitor that looks at throughput metrics and checks for server resource availability.
The internal transaction monitoring of eG Enterprise breaks down the request rate of individual web transactions, average response times, and the number of aborts by web transactions. With this information, you can pinpoint if your site is living up to expectations or needs to be tweaked further.
Who is it recommended for?
This system is available for installation on Windows or Linux and it is also offered as a SaaS platform. You get either option on a subscription and it is possible to buy the on-premises software outright. The price depends on which features you select – you don’t have to take all of the modules.
Pros:
- Can monitor a wide range of ISS environments
- Threshold-based altering can notify when web servers go offline or become slow due to resource-related issues
- Offers root-cause analysis to help technicals solves issues faster, resulting in more uptime
Cons:
- Doesn’t offer a freeware version
eG Enterprise can be deployed on-premises or in the cloud as a license or subscription. However, you need to contact the sales team to view a quote. There is a free evaluation version that supports up to five servers as a cloud-deployed platform. You can download a free trial.
Tools for monitoring IIS server
Once you have IIS set up, you will need to keep ahead of any possible problems. Monitoring a complex application, such as IIS takes a lot of resources and you can reduce the amount of staff that you need to dedicate to the task by introducing automated tools.
SolarWinds Microsoft Management Tools
SolarWinds Microsoft Management Tools can watch out for key attributes in the performance of IIS. You will particularly need the Web Performance Monitor and the Server and Application Monitor to keep IIS running smoothly. Both of these tools are written to a common platform, called Orion. This enables them to connect together into a contiguous tool. Both tools will also help you manage other Microsoft products, including Exchange Server, Sharepoint, and Office 365.
Pros:
- Can monitor hardware and IIS health statistics in one platform
- Users can monitor as little or as much as they want through modular add-ons
- Designed to easily monitor ISS and other Microsoft environments
- Offers built-in alert and data visualization
Cons:
- Designed for system administrators – not ideal for home networks
These monitoring systems are not free to use. However, you can get both of them on a 30-day free trial.
Microsoft Extensions
1. UrlScan 3.1
UrlScan 3.1 is a security tool that helps to protect IIS web servers against cyber attacks. There are a number of added protections that you get from using UrlScan 3.1 that you don’t get from the standard version of IIS.
First, this tool can restrict HTTP requests that will be processed by IIS. Blocking some HTTP requests is advantageous because it protects against requests that can be part of a cyber attack.
Also, UrlScan 3.1 can also filter HTTP values and headers to eliminate the risk of SQL injection attacks. This is done by creating deny rules which prohibit certain requests that could be malicious. To make sure that you don’t block out legitimate connections there is also an AlwaysAllowedUrls section where you can specify URLs that should always be permitted.
For further information, UrlScan 3.1 also provides log files that you can use for more sophisticated analysis. In practice, log files help to provide additional information on errors and other problematic activity on IIS. With this information, you can make changes and deliver a more reliable service.
On account of its security features, UrlScan 3.1 is an essential download. It helps to supplement some of the security limitations that come with an unmodified version of IIS. UrlScan 3.1 supports IIS 5.1, IIS, 6.0, and IIS 7.0 for Windows Vista and Windows Server 2008. You can download UrlScan 3.1 for free here.
2. URL Rewrite 2.1
URL Rewrite is another IIS extension that allows the user to create rules to modify URL rewriting behavior. By configuring URL rules the user can change how HTTP headers, responses, or request headers are rewritten.
In the context of an organization, configuring URL rules is useful as an administrator can configure a rule. URLs can be created that are easy for users to remember and simple to index for search engines.
Having URLs that are easy to index on search engines is a valuable step towards making your site or application available to clients. URLs that are search engine-friendly increase the visibility of your site. You don’t have to write your own rules for this either. There are many rule templates included out-of-the-box to help you get started.
URL Rewrite is also an excellent tool because it updates the user interface in IIS Server Manager. Having an integrated tool that allows you to create new rules helps to manage URLs much more effectively. As an extension for IIS, URL Rewrite 2.1 is available for free. You can download this tool here.
3. IIS Manager for Remote Administration 1.2
IIS Manager for Remote Administration 1.2 is vital for any enterprise looking to manage IIS remotely. You can manage IIS remotely on devices with Windows XPand up.
You can perform the majority of the functions you could on the original IIS without being onsite. Administration privileges can be used to restrict access to those employees who require access.
Managing remotely with IIS Manager for Remote Administration 1.2 is also secure, using HTTP over SSL. There are also automatic downloads where features are downloaded on the local IIS Manager that have already been installed on the web server. This simplifies the manual administrative concerns that come with remote updates.
For teams working remotely or looking to share control of web applications across multiple sites, IIS Manager for Remote Administration 1.2 is an absolute must. IIS Manager for Remote Administration 1.2 is available for IIS 7, IIS 7.5, IIS 8, and IIS 8.5. You can download the tool for free via this link here.
10. Web Deploy 3.6
Web Deploy 3.6 or msdeploy is a tool that integrates with IIS to synchronize IISsites, servers, and applications. When synchronizing, Web Deploy 3.6 can detect the difference between two locations and make only the necessary changes to synchronize servers. Using this tool is more efficient because it identifies which data needs to be synchronized rather than attempting to do everything from scratch.
Another use case where Web Deploy 3.6 is very valuable when deploying web applications. The user doesn’t need any user administrative privileges to deploy updates. However, the server administrator still has the control to delegate tasks to lower-ranked users without administrative privileges. In other words, deploying web applications is much easier and less restrictive than it is in the default version of IIS.
For enterprises looking to synchronize IIS sites and deploy web applications, Web Deploy 3.6 is a must have. Web Deploy 3.6 is available for IIS 7, IIS 7.5, IIS 8, IIS 8.5, and IIS 10. You can download Web Deploy 3.6 for free here.
IIS Resources You Should Know
There are many different sources of valuable IIS information. We have listed some of the best below so that you can learn more about IIS works:
1. IIS.net
If you’re looking for information on IIS then this site should be at the top of your list. This is the official Microsoft IIS site that provides downloads news, updates, and guides on how to use Microsoft IIS.
There are almost 30 different Microsoft-supported downloads from the site. These include IIS Compression, Web Platform Installer, IIS CORS Module, HttpPlatformHandler v1.2, IIS Manager for Remote Administration 1.2, WinCache Extension for PHP, Administration Pack, Advanced Logging, and Application Initialization Module for IIS 7.5.
Blog posts on this website include IIS PowerShell Cmdlets, Getting Started with the IIS CORS Module, and Using Azure Activity Log to Check the Progress of Deployment Slots Swap Operation.
2. Microsoft
Another excellent resource for IIS downloads is the Microsoft website itself. The Microsoft website has a range of IIS downloads and an IIS-specific course for you to incorporate to improve your IIS experience. Some of the most helpful downloads are listed below:
- IIS Database Manager – Allows you to manage local and remote databases through IIS Server Manager
- IIS PowerShell Snap-in – Allows you to automate the administration of website creation and configurations
- Administration Pack for IIS 7.0 – Provides a range of tools and extensions with additional administrative capabilities
- IIS Advanced Logging – Adds real-time logging on the client and server side as well as more data collection capabilities
Unfortunately, we could only find one course relating to IIS, but it is still a valuable resource for when you’re starting out with IIS. The course title is 10972B Administering the Web Server (IIS) Role of Windows Server. The course is available over five days in a classroom or provides you with three-months worth of online access if you choose to do it online
3. Channel 9
Channel 9 is a Microsoft-driven website that is led by a group by a group of developers who discuss various technologies. There is a substantial amount of video content on this site relating to IIS, including the IIS show. However, the site also features tutorial-driven content such as the Extending IIS Configuration video. This site is recommended if you want to get a feel for IIS and older versions of IIS (IIS content hasn’t been updated for some time so this is not suitable for later versions of IIS).
4. Stackify
When it comes to technical content on IIS you’ll be hard-pressed to beat Stackify. Stackify is a company that specializes in providing tailor-made tools and content for developers and other IT professionals. There are currently over 100 articles and tutorials on IIS. Live articles include:
- What is IIS Express: How it Works, Tutorials and More
- How to Read and Customize IIS Log Files
- How to Monitor IIS Performance: From the Basics to Advanced IIS Performance Monitoring
5. tecadmin
Techadmin is a tech blog that was started in 2013 by Rahul Kumar. The site has been designed specifically to help Windows and Linux Network Administrators to get the most out of their tools. There are many different IIS articles on the site that offer some of the most accessible guides you’ll find online. Past articles on IIS include:
- How to Install IIS on Windows 8 and Windows 10
- How to Set Default Document in IIS
- How to Create Website in IIS On Windows
- How to Restart IIS via Command Line
6. Accelebrates
Another excellent resource is Accelebrate IIS training. The Accelebrate website has several IIS courses with an average rating of 4.66 out of 5. These courses are based on 60% labs and 40% lectures so that you get the right balance of building your theoretical and practical knowledge. These are paid courses so you’ll need to contact the company directly to request a price. Accelebrate’s IIS courses are as follows:
In the IIS 10 Administration course students will learn how to plan for and install an IIS installation, as well as building their knowledge of the overall architecture of IIS. You’ll also learn how to perform day-to-day administration tasks by using IIS Manager, PowerShell, and AppCmd.
7. forums.iis.net
While this is technically part of the IIS site the forum deserves its own section based on how useful it is in its own right. Here you can find a vast range of information on IIS and various features. The forum provides information on general IIS issues, extensions, security, configurations, web farms, performance, and troubleshooting. So if you have a question that you need an answer to, taking a trip to the IIS forums will likely include what you need.
IIS is a Windows Web Server at the Top of the Game
That concludes our guide to using IIS. IIS software can be needlessly complicated sometimes, but once you get the basics down like how to configure your website, then you’re well on your way to nailing the learning curve. The key is to keep at it, as learning to use the second-largest Windows web server in the world is more than worth the initial struggle you face when new to the utility.
Remember that an IIS server can be considerably different depending upon the operating system you’re using. If you don’t see the version of IIS you’re using supported in this article then there are plenty of other online resources covering all facets that you can think of. You’ll have to mix and match, but you’ll be able to piece together more specific guidance for your system.
IIS Web Server FAQs
What are the characteristics of IIS server?
The main characteristic of IIS is that it manages the hosting of websites. Apart from storing static web pages, the IIS system is able to manage services and web applications such as ASP.NET. Another feature of IIS is its ability to act as an FTP server. Among the characteristics of IIS is the integration of the Windows Communication Foundation (WCF) framework that provides support for service-oriented applications. IIS can be extended to include the capability to host PHP sites and web applications built on other platforms.
How do I install IIS management scripts and tools?
Follow these steps to install ISS management scripts and tools.
- Get to the IIS dashboard by selecting Administrative Tools from the Start menu and then click on Server Manager.
- In the Server Manager, expand the Roles node and select Web Server (IIS).
- Click on Add Role Services to get the Select Role Services screen. You will be in the Role Services section of this window.
- In the main panel of the screen click on IIS Management Scripts and Tools. Click the Next button at the bottom of the window.
- Click the Install button at the bottom of the Confirm Installation Selections screen.
- Watch the installation progress until it completes.
- Check the details in the Installation Results screen and press the Close button.
IIS management scripts and tools will now be available in the Server Manager.
Can I run IIS on Windows 10?
Yes. Follow these steps to activate IIS on Windows 10 and run it.
- Click on the settings cog icon in the Start menu.
- Type Turn Windows features on or off in the search field and select this option from the results.
- Scroll through the folder structure in the Windows Features popup. Check the Internet Information Services node box to activate it.
- Press OK to close the popup.
- Open any web browser and type in http://localhost/ to check that IIS is working.
To run IIS on Windows 10 follow these steps.
- Click on the Start button.
- Scroll through the programs list to find Windows Administrative Tools
- Expand that folder to find Internet Information Services (IIS)
You will now see the Internet Information Services (IIS) Manager dashboard.
How do I monitor IIS requests?
You first need to activate the Request Monitor. These instructions are for IIS 8 on Windows Server.
- Select Administrative Tools from the Start menu and then click on Server Manager.
- Expand the Roles node and select Web Server (IIS).
- Click on Add Role Services to get the Select Role Services screen.
- Scroll down to the Health and Diagnostics section. Click on Request Monitor.
- Press the Next button at the bottom of the screen.
- Click the Install button at the bottom of the Confirm Installation Selections screen.
- Watch the installation progress until it completes.
- Check the details in the Installation Results screen and press the Close button.
Then monitor IIS requests by following these steps.
- Go to the IIS Manager.
- Select the web server you want to monitor and look at the Home Features view.
- Go to the IIS section and open the Worker Processes view.
- Select the process that you want to monitor.
- In the Actions pane, click on View Current Requests.

