
Packet loss is one of the most critical network performance metrics, but what is packet loss, what causes it, and how do you fix it?
In a hurry? Here is our list of the best tools to fix packet loss:
- Site24x7 EDITOR’S CHOICE This SaaS platform is packaged as full-stack monitoring services that cover web systems, applications, servers, and networks. The packages all include both network device monitoring and traffic analysis. Start a 30-day free trial.
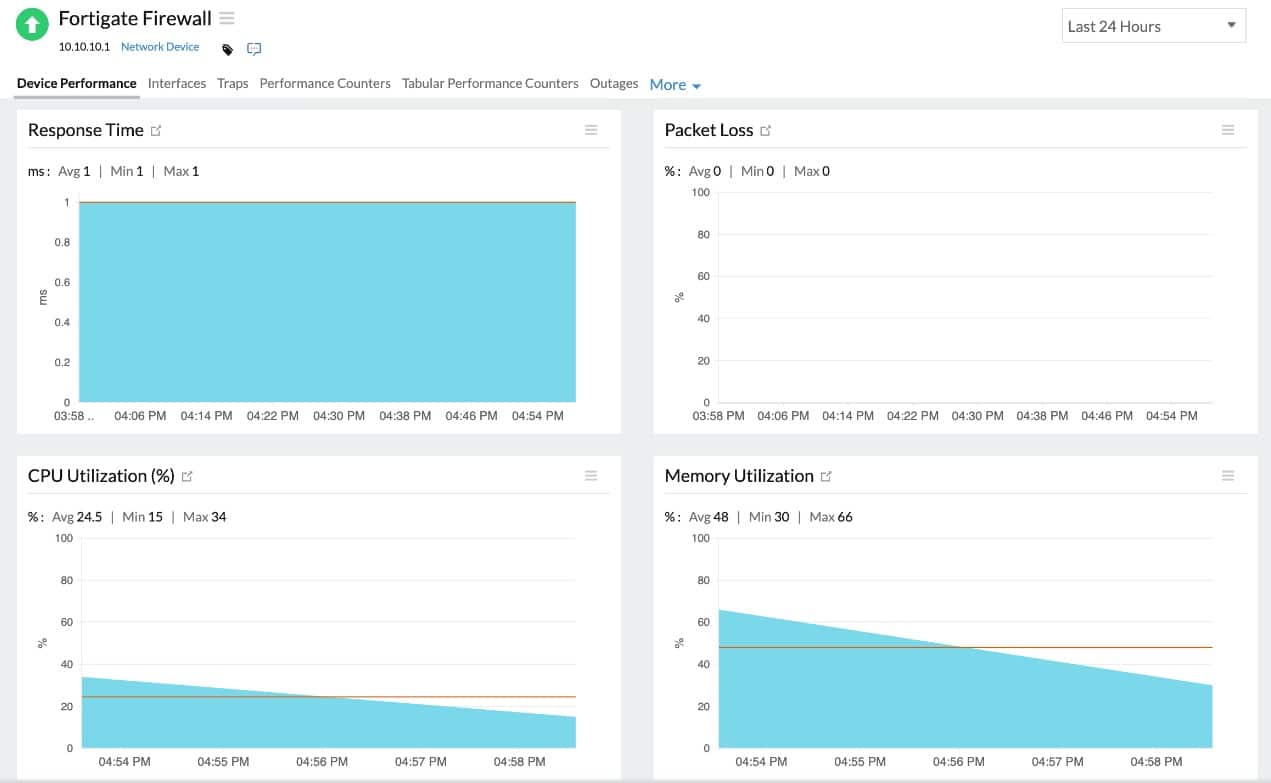
- ManageEngine OpManager This package monitors network devices and can reveal the causes of packet loss before they impact traffic. Available for Windows Server, Linux, AWS, and Azure.
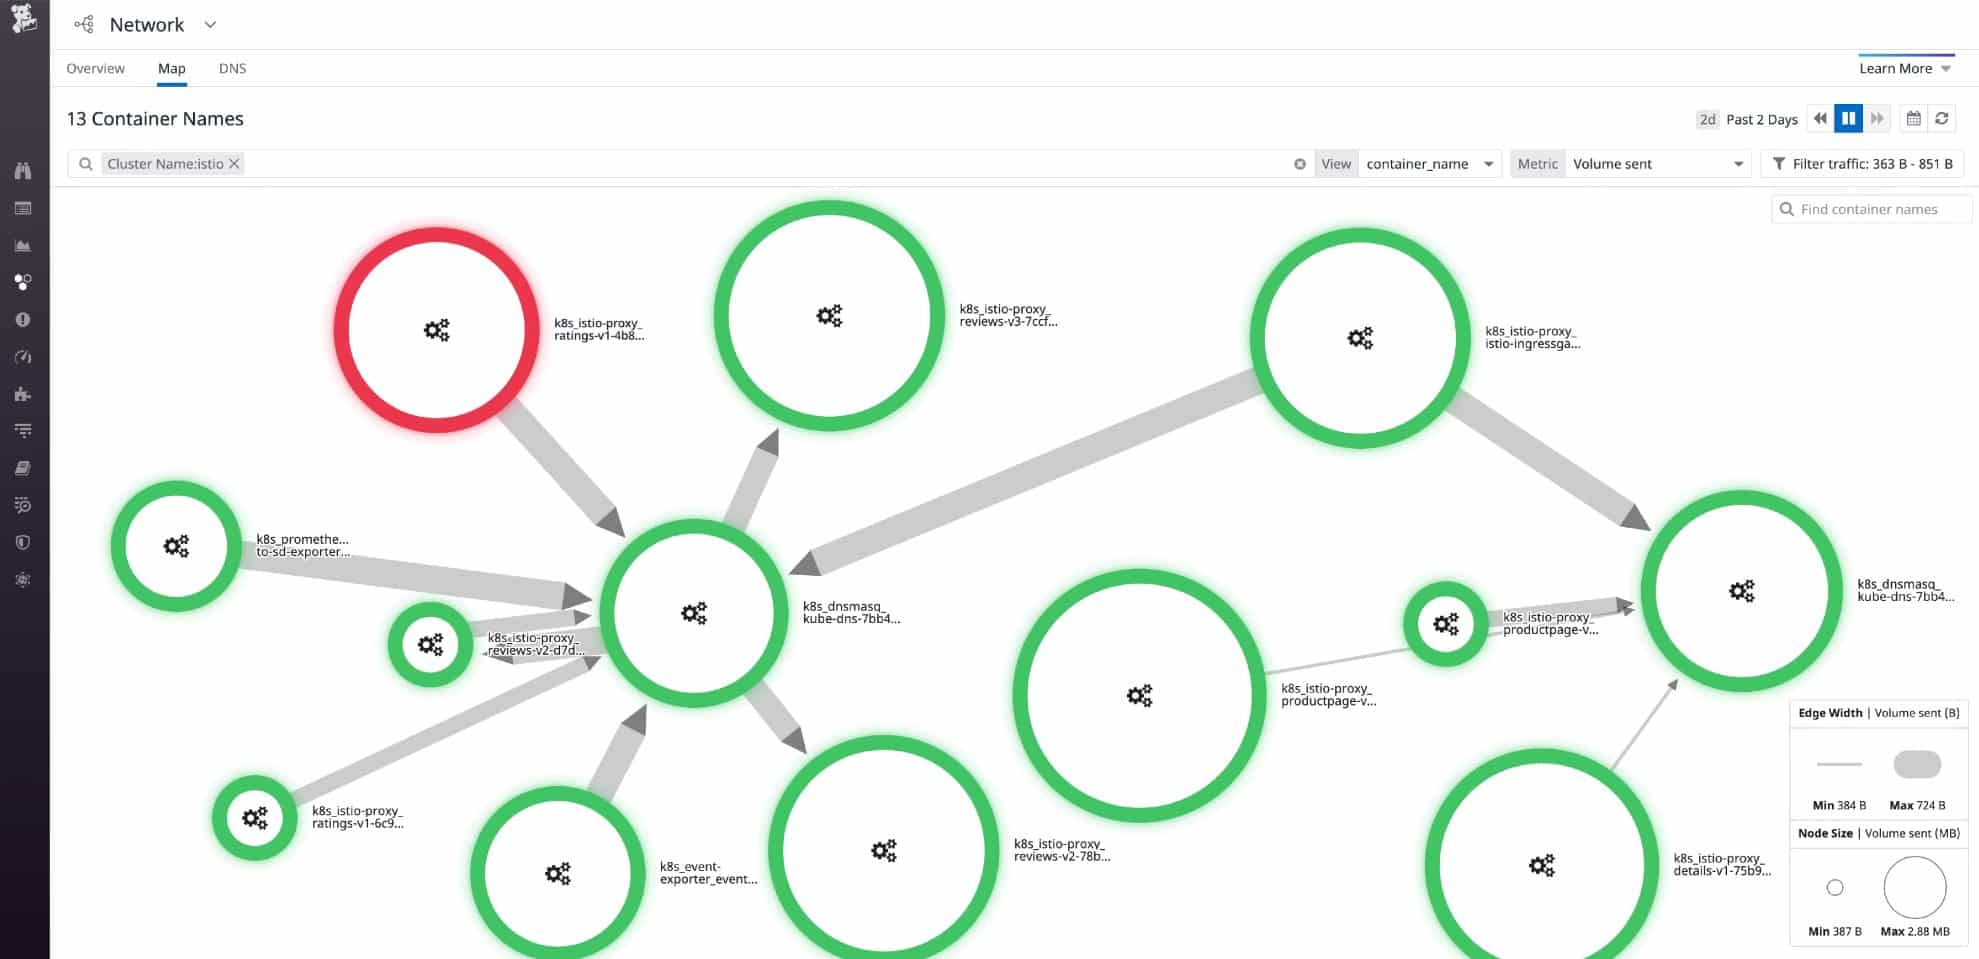
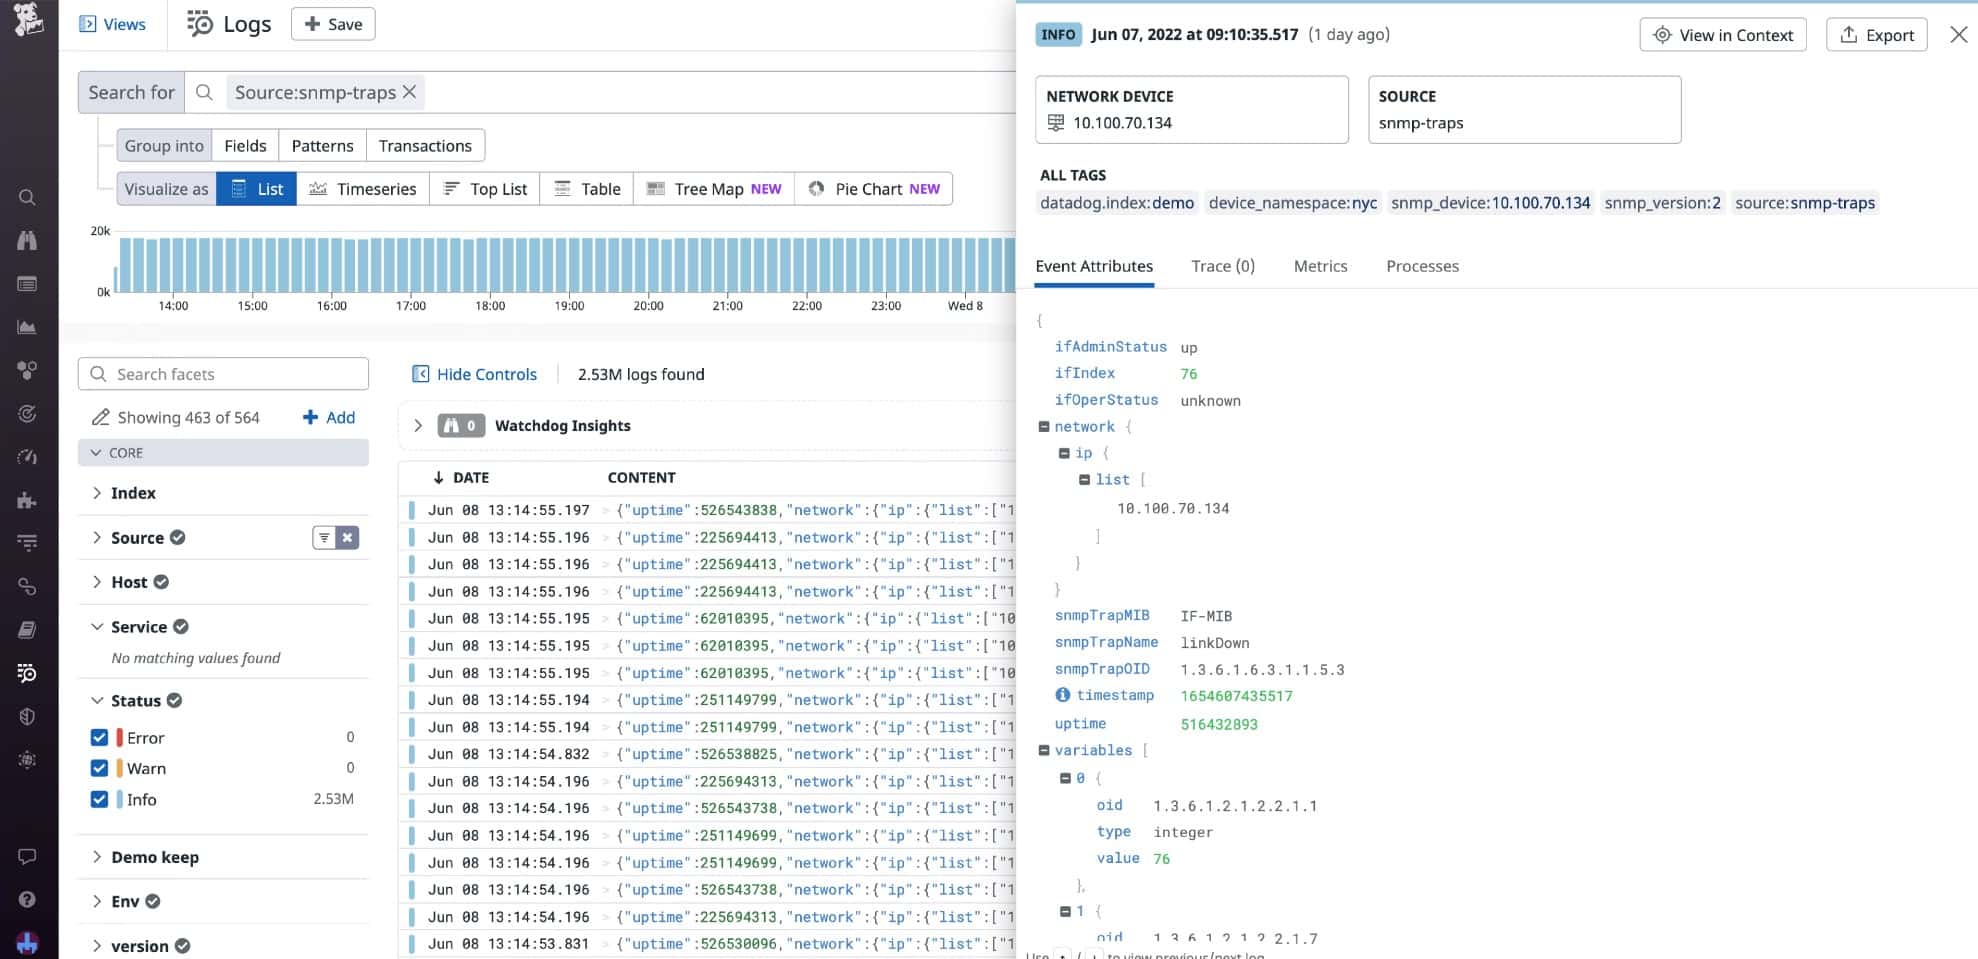
- Datadog Network Performance Monitoring A SaaS package that draws up a network map and gathers packet transmission statistics live around the network and also offers an end-to-end testing facility
- Obkio This cloud-based system reaches out to local networks through data collector agents that collect data on packet loss, among other statistics.
- Paessler Packet Loss Monitoring with PRTG A network, server, and application monitoring tool that includes a Ping sensor, a Quality of Service sensor, and a Cisco IP SLA sensor.
- Nagios XI An infrastructure and software monitoring tool that runs on Linux. A free version (Nagios Core) is also available.
- SolarWinds Network Performance Monitor Comprehensive network device health checker, running on Windows Server, that employs SNMP for live monitoring.
What is packet loss?
- Breaking Down Packet Loss: What it is and how it happens.
- Impact on Communication: How packet loss affects your online activities.
- Network Performance: The role of administrators in monitoring and mitigating packet loss.
- Intentional Packet Loss: The reason behind purposefully lost packets.
- Solutions and Optimization: Strategies to identify and fix packet loss issues.
Did you know, you can test for packet loss? For more information, check out our guide to packet loss testing on Windows.
Breaking Down Packet Loss
In simple terms, packet loss refers to the loss or disappearance of small units of data called packets while they are being sent over a network. Think of these packets as small envelopes containing information. When you send data over the internet or any network, it is divided into these packets to make it easier to transmit.
Now, imagine you’re sending a bunch of these envelopes from one place to another. Sometimes, due to various reasons like network congestion or errors, some of these envelopes don’t reach their destination—they get lost along the way. This loss of packets is what we call packet loss.
Impact on Communication
When packets are lost, it can cause problems in the communication process. For example, if you’re watching a video online and some packets are lost, you may experience pauses, glitches, or buffering as the missing parts of the video need to be retransmitted.
Network Performance
Network administrators monitor packet loss as an important metric to evaluate the performance and reliability of their networks. They employ various techniques and tools to identify and mitigate packet loss, such as optimizing network configurations, improving network infrastructure, or using error correction mechanisms.
Intentional Packet Loss
Lost packets can also be intentional, for instance when it is used to restrict throughput during VoIP calls or video streams so as to avoid time lags, particularly during times of high network congestion. This results in lower-quality data streams and calls which negatively affect user experience.
Solutions and Optimization
To fix packet loss and keep high latency, you need to determine which parts of your network are contributing to the problem.
What causes packet loss?
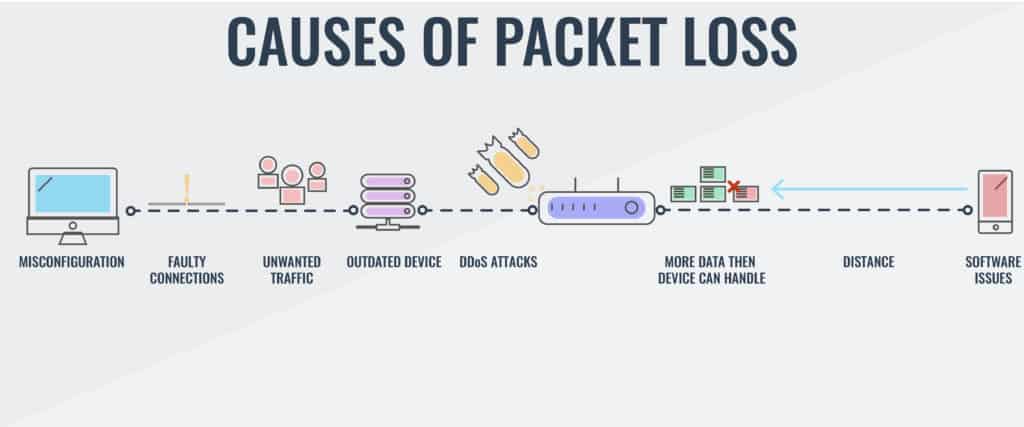
- Nature of IP Transfers: Data packets are passed across networks, with each router deciding the next step. The sender lacks control over the route or transfer speed.
Packet loss is less likely on private, wired networks, but highly probable on long-distance internet connections. The IP philosophy of passing data packets across networks gives each router the decision on where a packet should be passed to next. The sending computer has no control over the transfer speed or the route that the packet will take.
Router packet loss
- Routers make independent routing decisions based on their databases of preferable routes.
- Routers cannot instantly know if a subsequent router is overloaded or malfunctioning.
- Periodic status updates from routers help in recalculating routes, but these take time.
The reliance on individual routers to make routing decisions means each access point on the route must maintain a database of preferable directions for each ultimate destination. This disconnected strategy works most of the time. However, one router cannot know instantly if another router further down the line is overloaded or defective.
All routers periodically inform their neighboring devices of status conditions. A problem at one point ripples through to recalculations performed in neighboring routers. A traffic block in one router gets notified to all of the routers on the internet, causing all routers to recalibrate paths that would otherwise have passed through the troubled router. The chain of information takes time to propagate.
Rerouting overload
- Packets might be sent to blocked routes and then rerouted.
- Rerouting can cause congestion on alternative paths.
- If a router can’t notify others of its defect, packets continue to be directed to it.
Sometimes a router will calculate the best path and send a packet down a blocked route. By the time the packet approaches that block, the routers closer to the problem will already know about it and reroute the packet around the defective neighbor. That rerouting can overload alternative routers. If the defect on a router prevents status notifications from being sent out, then the packet will be sent to that router regardless.
Distance to lost packets
- Distance and Packet Loss: The longer the distance a packet travels, the more routers it interacts with, increasing the chances of packet loss.
In short, the further a packet has to travel, the more routers it will pass through. More routers mean more potential points of failure and a higher likelihood that dropped packets will occur.
When is packet loss too high?
You will never reach a point where your company’s network infrastructure achieves zero packet loss. You should expect this performance drag when making connections over the internet, in particular.
Once you understand the reasons for packet loss, keeping the network healthy, packet recovery becomes an easier task. Install a network monitor to prevent equipment failure, security risks, and system overloading that escalates packet loss to critical conditions.
Packet loss costs your business money because it causes extra traffic. If you don’t deal with packet loss, you’ll have to compensate by purchasing extra infrastructure and higher levels of internet bandwidth usage than you would need with a well-tuned system.
See also: Best VoIP Monitoring Tools
How to Fix Packet Loss: Step-by-Step Solution
Although it’s impossible to remedy packet loss in your network, there are some meaningful network checks you can complete to improve speed and reduce the number of packets lost.
- Check physical network connections – Check to ensure that all cables and ports are properly connected and installed.
- Restart your hardware – Restarting routers and hardware throughout your network can help to stop many technical faults or bugs.
- Use cable connections – Using cable connections rather than wireless connections can improve connection quality.
- Remove sources of interference – Remove anything that could be causing interference. Power lines, cameras, wireless speakers and wireless phones all cause interference in networks.
- If you are running WIFI – Try switching to a wired connection to help reduce packet loss on your network.
- Update device software – Keeping your devices updated will help to ensure that there are no bugs in the OS causing packet loss.
- Replace outdated or deficient hardware – Upgrading your network infrastructure allows you to get rid of deficient hardware altogether.
- Use QoS settings – Prioritize your network traffic based on the applications that are most important. For example, prioritize voice or video traffic.
The Best Tools to Fix Packet Loss
Tools that monitor your network endpoints can help you detect, troubleshoot, and fix packet loss.
Our methodology for selecting tools to fix packet loss
We reviewed the market for tools to fix packet loss and analyzed the options based on the following criteria:
- SNMP monitoring to check on network device statuses
- Ping sweeping to test for device availability and network connectivity
- Support for the implementation of queuing
- End-to-end path testing utilities
- Link testing facilities
- An assessment period either as a free trial or as a money-back guarantee
- A valuable collection of tools that will reduce packet loss and improve the business’s profitability
These tools both help you identify the equipment causing packet loss and provide continuous device monitoring to prevent packet loss whenever possible.
Features Comparison Table
| Product/Features | Site24x7 | ManageEngine OpManager | Datadog Network Performance Monitoring | Obkio | Paessler PRTG | Nagios XI | SolarWinds Network Performance Monitor |
|---|---|---|---|---|---|---|---|
| Packet Loss Detection | Yes | Yes | Yes | Yes | Yes | Yes | Yes |
| Real-Time Monitoring | Yes | Yes | Yes | Yes | Yes | Yes | Yes |
| Historical Data Analysis | Yes | Yes | Yes | Yes | Yes | Yes | Yes |
| Customizable Alerts | Yes | Yes | Yes | Yes | Yes | Yes | Yes |
| Packet Loss Cause Analysis | No | Yes | Yes | Yes | Yes | No | Yes |
| Interactive Visualizations | Yes | Yes | Yes | Yes | Yes | Yes | Yes |
| QoS Monitoring | Yes | No | Yes | Yes | Yes | Yes | Yes |
| Supports Multiple Network Protocols | Yes | Yes | Yes | Yes | Yes | Yes | Yes |
| Scalability | Yes | Yes | Yes | Yes | Yes | Yes | Yes |
| Free Trial Available | a 30-day free trial | Yes | Yes | 14-day free trial | Yes | No | Yes |
| OS Compatibility | Cloud-based | Windows Server, Linux, AWS, and Azure | Cloud-based | Cloud-based | Windows | Linux | Windows |
1. Site24x7 (FREE TRIAL)
There are two viewpoints that will spot packet loss and Site24x7 looks at networks from both of these angles. You can simultaneously watch over network devices and record traffic statistics with the packages offered on the Site24x7 cloud platform.
Key Features:
- Network Performance Monitoring: Monitors the performance of your network, including packet loss, latency, and jitter, to ensure reliable connectivity.
- Traffic Analysis: Analyzes network traffic to provide insights into bandwidth usage, application performance, and data flow patterns.
- Early Warnings: Offers early warning alerts for potential network issues, including packet loss, before they escalate into major problems.
- Root Cause Analysis: Utilizes advanced analytics to identify the root causes of packet loss, helping to pinpoint and resolve issues quickly.
- Comprehensive Dashboard: Offers a user-friendly dashboard that provides a holistic view of network performance metrics and trends over time.
- Historical Data Analysis: Stores historical performance data to help track recurring issues and analyze trends, aiding in long-term network performance improvements.
- Integration Capabilities: Integrates with various third-party tools and platforms, enhancing its utility in broader IT infrastructure and operations management.
Unique Feature
Site24x7 provides packages of monitoring tools that cover all layers of the stack for one subscription. That gives you the opportunity to immediately see the root cause of any problems that appear in your system and correct problems quickly.
Why do we recommend it?
Site24x7 gives technicians every form of early warning possible. By simultaneously monitoring applications, servers, and networks, this system will suddenly deliver a series of warnings when a traffic problem arises because problems on the network soon starve applications of data. By looking at all alerts, technicians immediately see the root cause of the problem.
The Site24x7 provides device discovery and the creation of a network inventory. This scanning ability extends to the identification of routers, switches, firewalls, printers, load balancers, and other network hardware. The database also supports the automatic creation of a network topology map. Once the system knows which devices are on the network and how they connect together, simultaneous device health monitoring and traffic tracking begin.
SNMP-based device status reports include interface throughput data that includes packet loss. One of the major causes of packet loss is excessive load on a switch or router. Site24x7 learns the full capacity of each device and identifies when traffic volumes approach that capability. The system will raise an alert when this situation arises, giving technicians time to make adjustments to the network to relieve bottlenecks and reduce packet loss.
The traffic monitoring services in Site24x7 use a combination of device statistics querying with protocols such as NetFlow and IPFIX and connection testing. The tests are performed with a system called MTR, which is a combination of TraceRoute and Ping. This traffic monitoring includes statistics on packet loss as well as the success and speed of a transmission to a specific node on the network.
The MTR system will generate a route map that provides details of the performance of each link, quickly identifying through color coding where problems lie. This information tells technicians where on the network overloading is causing packet loss.
Who is it recommended for?
The Site24x7 packages are very reasonably priced for basic capacity that is suitable for small networks. Larger businesses add on extra capacity for a fee. This makes the service suitable for businesses of all sizes. The SNMP monitoring and path analysis features of Site24x7 compete well with the services of SolarWinds Network Performance Monitor. It also competes well as a full-stack monitor with the PRTG package. Consider Site24x7 as a cloud-based alternative to the SolarWinds and PRTG options on this list.
Pros:
- User-Friendly Interface: The intuitive and comprehensive dashboard makes it easy to monitor and interpret network performance data.
- Real-Time Monitoring: Real-time alerts and monitoring capabilities ensure that issues are identified and addressed promptly, minimizing downtime and performance degradation.
- In-Depth Analytics: Advanced root cause analysis and historical data tracking provide valuable insights for troubleshooting and improving network performance.
- Global Reach: Monitoring from multiple global locations ensures a comprehensive view of network performance, including packet loss, across different regions.
- Scalability: Suitable for organizations of all sizes, from small businesses to large enterprises, due to its scalable monitoring capabilities and integration options.
- Customizable Reporting: The ability to generate detailed and customizable reports supports proactive network management and strategic planning.
Cons:
- Cost: Can be expensive, especially for smaller organizations or those with limited budgets, due to its extensive features and capabilities.
- Learning Curve: Users may experience a learning curve when first using the platform, particularly with advanced features and analytics.
All of the plans of Site24x7 include network monitoring, so you get packet loss detection measures in whichever package you choose. You can examine any of those packages with a 30-day free trial.
EDITOR'S CHOICE
Site24x7 is our top pick for a packet loss fixer because it provides two methods to examine networks: device statuses and traffic patterns. The biggest cause of packet loss comes from overloaded or faulty switches. The SNMP-based routines in the Site24x7 package would spot such an event right away and alert technicians to the problem. Looking at traffic patterns per protocol enables network administrators to work out which types of traffic need to be prioritized. For example, interactive systems need to get through quickly, while asynchronous services, such as email can be delivered a few seconds slower. The Site-24×7 platform includes many modules and the service is bundled in plans that include all of the modules. This gives extra perspectives to network and internet performance because it provides response time monitoring for websites and also measures the events experienced by website visitors through real user monitoring.
Download: Access the 30-day FREE Trial
Official Site: https://www.site24x7.com/signup.html?pack=44&l=en
OS: Cloud-based
2. ManageEngine OpManager

ManageEngine OpManager is a comprehensive network monitoring solution designed to assist IT teams in maintaining optimal network performance. With features focused on detecting and diagnosing packet loss, OpManager is particularly well-suited for identifying network issues, enhancing reliability, and reducing downtime.
Key Features:
- Real-Time Monitoring: Continuously tracks network performance metrics, including device health and bandwidth usage, to maintain optimal network operation.
- Packet Loss Detection: Identifies packet loss instances across network devices to help troubleshoot issues affecting connectivity.
- Device Status Monitoring: Provides in-depth monitoring of device metrics, such as CPU, memory, and interface health, to prevent overloads and failures.
- Customizable Alerts: Sends notifications via email, SMS, or push alerts when issues like packet loss or latency spikes are detected.
Unique feature:
OpManager’s real-time network visualization, which provides intuitive network topology maps and color-coded alerts, uniquely assists in pinpointing packet loss sources and tracking network health trends.
Why Do We Recommend It?
ManageEngine OpManager is an effective tool for comprehensive network monitoring and packet loss detection. This package will warn you if a network device is in trouble – that’s a major cause of packet loss. So, you can prevent packet loss from developing. The package also gives you troubleshooting tools to identify the source of problems.
OpManager continuously monitors device status metrics, such as CPU and memory usage, bandwidth, and interface health, to prevent packet loss caused by device overloads or faults. By identifying performance bottlenecks and hardware issues early, OpManager minimizes packet loss risks, helping teams maintain network stability and optimize resource utilization.
The package includes configurable alerts, sending real-time notifications via email, SMS, and push notifications when packet loss or other issues are detected. These alerts allow IT teams to respond promptly, addressing issues before they escalate. Additionally, OpManager integrates with third-party platforms like Slack and Microsoft Teams for seamless alert forwarding.
OpManager enables users to manually check for packet loss, test device reachability, and trace network paths with built-in troubleshooting tools like Ping and Traceroute. These utilities provide detailed latency metrics and route information, helping IT staff locate network problems and confirm connectivity to specific devices.
Who Is It Recommended For?
This system is recommended for small to large businesses, data centers, and IT service providers seeking a powerful, versatile tool to monitor network health, prevent packet loss, and reduce downtime with minimal complexity.
Pros:
- Network Topology Visualization: Offers dynamic, color-coded maps to visualize network architecture, making it easy to locate trouble spots.
- Built-In Troubleshooting Tools: Includes utilities like Ping and Traceroute for manual verification of network paths and packet loss sources.
- Protocol Support (SNMP, WMI, CLI): Allows seamless integration with various device types, enhancing versatility in monitoring.
- Multi-Platform Options: Available for Windows Server, Linux, AWS, and Azure.
Cons:
- No SaaS Option: You can host it on your own account on AWS or Azure but that is not SaaS.
OpManager offers multiple editions, including Standard, Professional, and Enterprise, catering to various needs and budgets. The Free Edition supports up to three devices, ideal for small networks or testing. OpManager can be installed on both Windows Server and Linux operating systems and it is available as a service on AWS and Azure. You can get a 30-day free trial to assess the package.
3. Datadog Network Performance Monitoring
If you prefer SaaS platforms to on-premises monitoring packages then Datadog Network Performance Monitoring is your best bet for a packet loss detection system. Datadog presents packet loss figures as retransmissions.
The monitor scours your network and generates a network map. Accessing that display, you can hover over any device on the network to see its current throughput statistics, which includes the number of re-transmitted packets.
The monitoring console also provides a path analysis function, which is like a visual Ping service. This will also give you a retransmission rate for the path under consideration.
Key Features:
- Live Network Traffic Statistics: Provides real-time statistics on network traffic, enabling continuous monitoring of data flow.
- Flow Data Analysis: Analyzes network traffic flows at the IP, port, and protocol level, providing detailed insights into packet movement.
- Application-Layer Dependency Mapping: Creates a visual representation of network dependencies between applications, servers, and cloud services. This helps identify potential bottlenecks or points of failure that might contribute to packet loss.
- Real-Time and Historical Data: Provides real-time monitoring of network performance alongside historical data for trend analysis. This allows you to identify recurring patterns or sudden changes that might indicate a packet loss issue.
- Alerting and Notification: Set up customizable alerts to be notified of spikes in packet loss or other network anomalies. You can receive alerts via various channels like email, Slack, or integrations with other monitoring tools.
- Integration with APM: Datadog integrates seamlessly with its Application Performance Monitoring (APM) tool. This allows you to correlate network issues like packet loss with application performance, helping identify application-specific causes.
Unique Feature
Datadog is an ever-expanding cloud platform with new units regularly appearing. The system includes the Network Traffic Monitoring unit that gathers packet statistics and will identify packet loss.
Why do we recommend it?
The Datadog Network Performance Monitoring service is your best option for network traffic monitoring if you want a cloud-based service. The Datadog system offers packet sampling and Ping tests. Subscribe to the Network Device Monitoring package as well to get SNMP performance alerts, device discovery, and network maps.
The console is more than just those visual displays. It also has screens that list details of all switches and routers in a table, so you can see traffic information at every point of the network simultaneously. Those screens also have some great graphs that show network activity.
All of the data can be searched and resorted and you can even generate your own custom graphs. Another point of customization in the package can be found in the alerting system. The Datadog monitor presents a list of available metrics and you can place a performance threshold on any one of them. For example, you could set an alert if a switch’s CPU is at 80 percent of full capacity.
Other traffic monitoring services in the Network Performance Monitor include a DNS request monitor and a load balancer tracker.
The Datadog system isn’t limited to networks because it will also watch the connections to and between cloud platforms. You need to set up the monitor with details of each of your cloud accounts and then it will include those systems as points in your network. They will appear on the network map as well as in the device performance table. The monitor can identify whether performance issues are caused by the cloud platform, the internet connection to it, or your home network.
Who is it recommended for?
Datadog is a good choice for those who prefer to use SaaS packages rather than getting software downloads to host and maintain.
Pros:
- Deep Visibility: Provides granular insights into network traffic, enabling precise troubleshooting of packet loss issues.
- Application-Centric View: Helps understand how packet loss impacts specific applications, allowing for targeted troubleshooting.
- Proactive Monitoring: Real-time monitoring and alerts facilitate early detection of packet loss before it affects users significantly.
- Scalability: Datadog can handle large networks and complex environments, making it suitable for businesses of all sizes.
- Integration with Datadog Ecosystem: Integration with other Datadog tools like APM creates a comprehensive monitoring platform.
Cons:
- Device Health Monitoring in a Separate Package: Device health monitoring is available but requires a separate package. May require additional investment and integration effort to fully utilize all monitoring capabilities, potentially complicating the setup process.
- Cost: Datadog NPM is a paid service, and pricing scales based on data volume and features.
- Learning Curve: Utilizing Datadog NPM effectively might require some technical expertise to understand its features and interpret data visualizations.
The Datadog platform includes many other system monitoring and management tools and you can get a look at all of them with a 14-day free trial.
4. Obkio

Obkio is a powerful, real-time network performance monitoring tool designed to help businesses monitor and optimize their network traffic. It offers detailed insights into network health by analyzing various performance metrics such as latency, jitter, bandwidth usage, and packet loss, which are critical for maintaining a high-performing infrastructure.
By using agents deployed across different network points, Obkio continuously tracks performance, ensuring any issues impacting network quality are detected and resolved before they escalate. It also deploys the Simple Network Management Protocol to identify the problems with network devices that are the probable causes of packet loss.
Key Features:
- Real-Time Network Performance Monitoring: Continuously monitors network traffic between different locations, devices, and services, offering real-time visibility.
- Packet Loss Detection: Identifies and measures packet loss between network points, helping to detect issues that can degrade performance and user experience.
- Latency and Jitter Monitoring: Tracks network delays and variability in packet arrival times to help pinpoint issues affecting application and service performance.
- Distributed Monitoring Agents: Deploys cloud and on-premise agents for continuous monitoring across local, remote, or hybrid networks.
- VoIP Connection Monitoring: Measures call quality using Mean Opinion Score (MOS).
Unique Feature
The Obkio system measures traffic between two agents, so a network administrator can choose whether to monitor network or internet activity or both just be deciding where to place the agents.
Why do we recommend it?
Obkio combines traffic scanning with network device performance monitoring, which is the ideal combination needed for packet loss detection. The platform’s combination of real-time monitoring, packet loss detection, and comprehensive historical reporting makes it an excellent choice for businesses looking to maintain optimal network performance and quickly troubleshoot issues.
Obkio runs on the cloud and installs agents on the network to collect data. This is how the remote, cloud-based data processor gets live activity data from your network. The system is able to monitor traffic between two agents, so you can examine the performance of internet links as well as your network. This is important for businesses with multiple sites and also those that use cloud services.

A key strength of Obkio is its packet loss detection capabilities, which allow users to detect, measure, and analyze packet loss in real-time. Packet loss, one of the most common causes of network degradation, can severely affect the performance of applications reliant on real-time data transmission (e.g., VoIP or video streaming). By identifying packet loss early, Obkio allows businesses to proactively resolve issues before they affect critical services.
The tool also tracks other network traffic conditions that can impact VoIP quality, such as latency and jitter – it calculates the Mean Opinion Score (MOS) for a link. These factors can damage the performance of all applications but they are particularly important for delivering interactive systems, such as video streaming or voice calls.
Network performance and internet delivery monitoring are important tools for ongoing monitoring, troubleshooting, historical analysis, and ISP service level agreement enforcement.
Who is it recommended for?
Obkio is recommended for small to medium-sized businesses that need to ensure optimal network performance across distributed environments, such as multi-office companies, remote teams, or businesses relying on cloud-based services. It is especially beneficial for IT teams managing VoIP, video conferencing, or SaaS applications, where low latency, low jitter, and minimal packet loss are critical.
Pros:
- Easy Deployment: Distributed agents make it simple to deploy across different network environments, including on-premise, cloud, and hybrid networks.
- User-Friendly Interface: Intuitive dashboards and reports make network data easily accessible for IT teams, even those with minimal experience.
- Proactive Alerts: Preset, customizable alerts appear in the dashboard when network performance metrics deviate from set thresholds.
- Problem Notifications: Alerts can be forwarded to technicians by email, Slack, Teams, or Pagerduty.
- Historical Analysis: Retains performance data to support trend analysis and capacity planning.
Cons:
- No Network Management Features: Doesn’t provide tools to correct detected problems.
Obkio is hosted in the cloud and administrators access the dashboard through any standard Web browser. You can experience the system by accessing a 14-day free trial.
5. Paessler Packet Loss Monitoring with PRTG
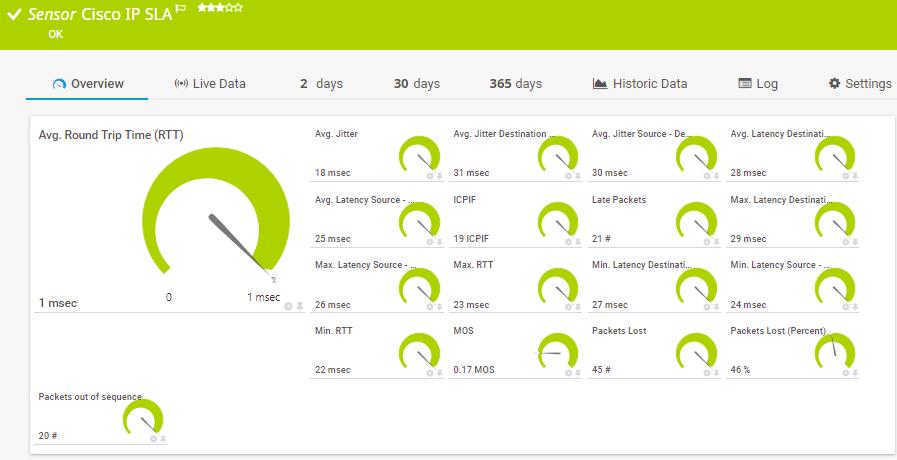
Paessler is a significant player in the network monitoring software sector and it puts all of its expertise into one killer product: PRTG Network Monitor. The company prices its product by a count of sensors.
Key Features:
- Flow Monitoring: Analyzes network traffic flow data, providing insights into traffic volume, types, and source/destination. This helps identify potential bottlenecks or congestion causing packet loss.
- Comprehensive Network Monitoring: Monitors network performance, including packet loss, bandwidth usage, and uptime, enabling proactive issue identification and resolution.
- Packet Sniffing: Uses packet sniffing technology to capture and analyze network traffic at a granular level. Offers deep insights into packet flow and potential loss points within the network, facilitating detailed troubleshooting.
- Customizable Alerts: Sends customizable alerts for packet loss and other network issues. This ensures that network administrators are promptly informed about problems, allowing for swift action to minimize downtime.
- Detailed Reporting: Generates comprehensive reports on network performance metrics, including packet loss rates. This helps track trends over time and supports data-driven decision-making for network optimization.
- Visual Network Maps: Provides visual network maps to display device connections and traffic paths. This enhances understanding of network structure and performance, making it easier to locate and address packet loss issues.
Unique Feature
PRTG is a flexible system that buyers tailor by deciding which of the modules in the bundle to activate. Options include server and application monitoring tools as well as network analysis utilities.
Why do we recommend it?
PRTG offers a number of traffic monitoring tools that include an SNMP monitor with alerts for device status checking, traffic sampling, a live network map, and Ping tests. You can assemble your own combination of these sensors to build yourself the perfect packet loss prevention service.
A “sensor” is a network or device condition or a hardware feature. You need to employ three sensors to prevent or resolve packet loss:
- The Ping test sensor calculates packet loss rate and trip time at each device.
- The Quality of Service sensor checks on packet loss over each link in the network.
- The third is the Cisco IP SLA sensor that only collects data from Cisco network equipment.
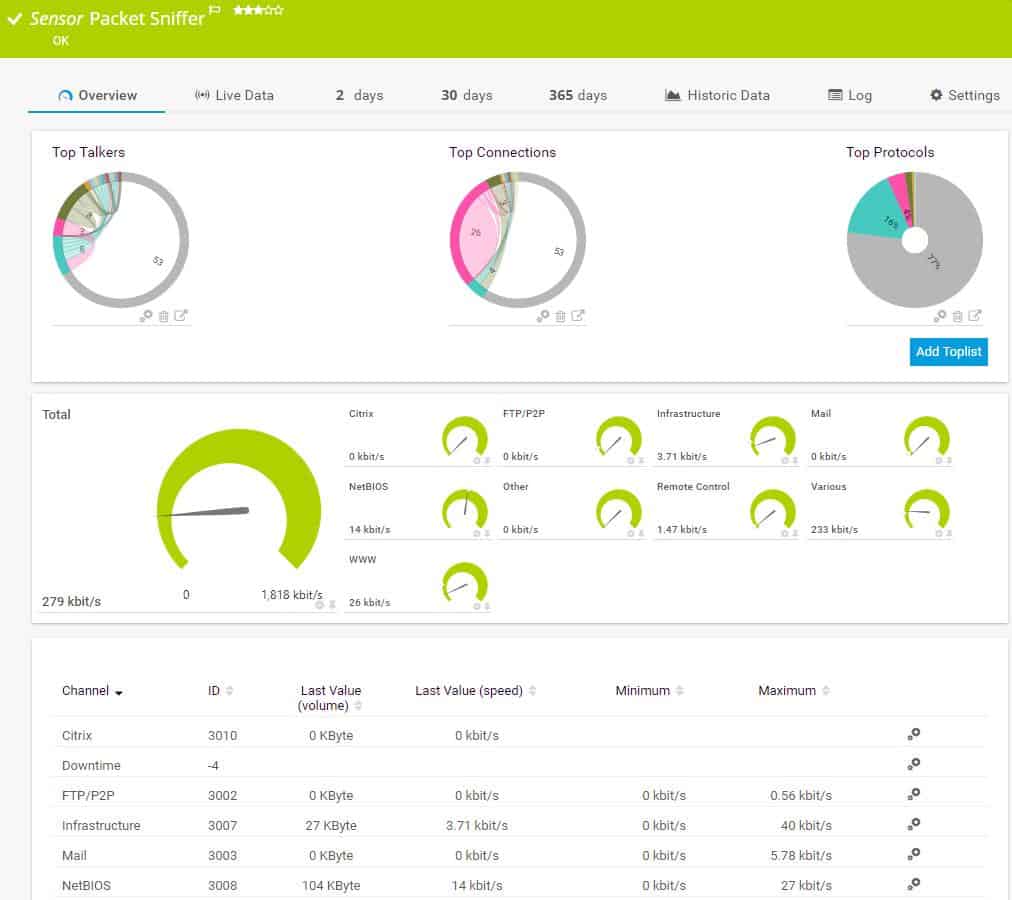
The ongoing system monitoring routines of PRTG head off conditions that cause packet loss.
First of all, you need to ensure that no software bugs or hardware failures will cripple the network. PRTG uses SNMP agents to constantly monitor for error conditions on each piece of hardware on the network.
Set alert levels at the processing capacity of each network device and marry that to a live monitor of the network’s throughput rate per link.
The build-up of traffic in one area of the network may cause overloading on the related switch or router and in turn cause it to drop data packets.
The PRTG system monitors application performance, too. You can prevent network overloads if you spot a sudden spike in the traffic generated by one application just by blocking it temporarily. You can also track the source of traffic back to a specific endpoint on the network and block that source to head off device overloading.
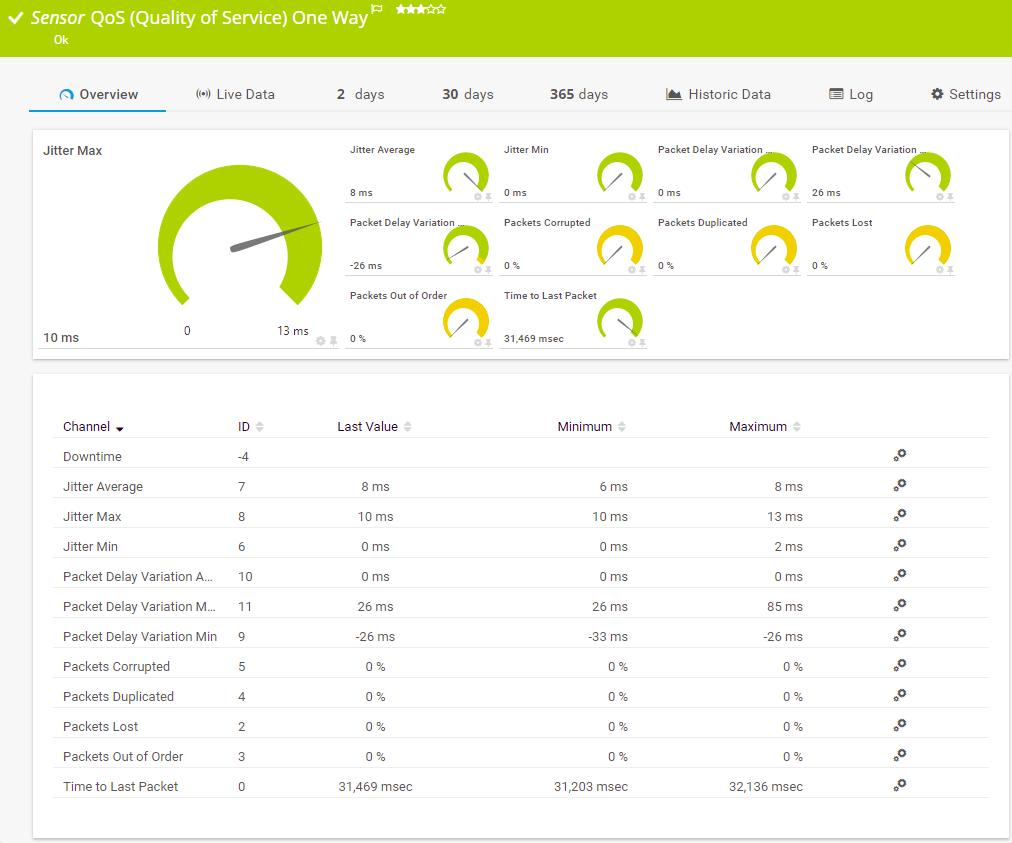
The dashboard of PRTG includes some great visualizations, which include color-coded dials, charts, graphs, and histograms. The mapping features of PRTG are impressive and offer physical layout views both on the LAN and across a real-world map for WANs. A Map Editor lets you build your own network representations by selecting which layer to display and whether to include the identification of protocols, applications, and endpoints.
Who is it recommended for?
The PRTG package is very scalable. You pay for the number of sensors that you turn on and traffic volumes have no influence on the price. So, this tool is suitable for networks of any size. A nice surprise for small businesses is that the PRTG package is free forever if you only turn on 100 sensors.
Pros:
- Simple and User-Friendly Interface: PRTG offers a user-friendly interface that simplifies setup and monitoring for administrators of varying technical skill levels.
- Freeware Edition Available: A free version of PRTG caters to smaller networks, offering basic monitoring capabilities and limited sensor usage, which can be helpful for initial troubleshooting.
- Strong Community and Support:: Supported by a strong community and extensive documentation. Provides valuable resources and assistance for troubleshooting and optimizing network performance.
- Customizable Dashboards and Reports: Tailor your monitoring experience with customizable dashboards and reports focusing on specific metrics like packet loss.
- Scalability: PRTG scales to accommodate growing networks and increasing monitoring needs.
Cons:
- Limited Application-Level Insights: PRTG primarily focuses on network infrastructure and doesn’t offer in-depth application-specific insights like some competitors.
- Resource Intensive:: Can be resource-intensive, potentially impacting system performance, adding to the overall cost and complexity.
- Alert Fatigue: The extensive alert system can lead to alert fatigue if not properly configured, necessitating careful alert management.
Paessler PRTG’s monitoring extends into the Cloud, will enable you to monitor remote sites, uncover network problems, while also covering wireless devices and virtual environments. You can install PRTG on the Windows operating system or opt to access the system over the internet as a Cloud-based service. Paessler offers a free trial of PRTG.
6. Nagios XI
Nagios Core is a free and open-source program. The only problem is that no user interface is included. To get full GUI controls, you must pay for the Nagios XI system.
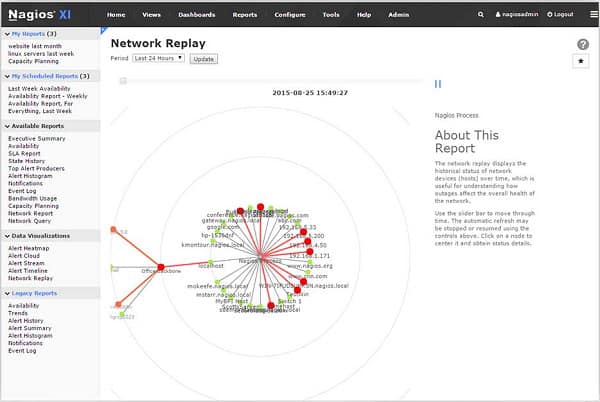
Like all of the other recommendations on this list, Nagios XI discovers all of the devices connected to your network and lists them on the dashboard. It will also generate a map of your network. Ongoing status check head off potential packet loss-provoking performance problems.
Key Features:
- Historical Data Analysis: Helps in identifying recurring packet loss patterns and making data-driven decisions for network optimization.
- Network Monitoring: Monitors a wide range of network parameters, including packet loss, latency, bandwidth, and uptime, helping to identify and troubleshoot packet loss issues effectively.
- Customization: Create custom monitoring checks tailored to specific needs. This allows for in-depth monitoring of specific network segments or applications potentially impacted by packet loss.
- Alerting and Notification: Set up alerts to be notified of spikes in packet loss or other network anomalies. Receive alerts via email, SMS, or integrations with other tools.
- Data Visualization and Reporting: Visualize network performance data through customizable dashboards and generate reports on packet loss trends and historical data.
- Community Support: Access a large and active community of Nagios users for troubleshooting assistance and plugin development.
Unique Feature
Nagios began as a free open source package and that version, called Nagios Core, is still available. Both editions of Nagios can be expanded by plug-ins, which add on extra functionality and are available for free at the Nagios Exchange.
Why do we recommend it?
Nagios XI gives you device monitoring to head off capacity exhaustion. Actual traffic analysis requires an add-on module. Although Nagios is well known for its free extensions, there are none for traffic analysis, so you are forced to buy the paid add-on.
Statuses are checked by the proprietary Nagios Core 4 monitoring system rather than SNMP. However, Nagios can be extended by free plug-ins, and an SNMP-driven monitoring system is available in the plug-in library. Traffic throughput rates, CPU activity, and memory utilization appear as statuses on the dashboard include. By setting alert levels on these attributes, you can get sufficient warning to prevent overloading of each of your network devices.
A Configuration Management module checks the setup of each device on the network and logs it. The log records changes made to those configurations. If a new setting impacts performance, such as increased packet loss, you can use the Configuration Manager to instantly roll back settings on a device to an earlier configuration.
The dashboard of Nagios XI includes some very attractive visualizations with color-coded graphs, charts, and dials. You can customize the dashboard and create versions for different team members as well as non-technical managers who need to stay informed.
The Nagios XI package includes all the widgets needed to assemble a custom dashboard through a drag-and-drop interface that makes it easy to stop packet loss. The system comes with standard reports and you can even build your own custom output.
Nagios records and stores performance data, so you can operate the interface’s analysis tools to replay traffic events under different scenarios. The capacity planning features of this system will help spot potential overloading that would cause packet loss.
Nagios XI will cover virtual systems, cloud services, remote sites, and wireless systems as well as traditional wired LANs. You can only install this monitor on CentOS and RHEL Linux. If you don’t have those but do have VMware or Hyper-V machines, you can install it there. Nagios XI is available for a 60-day free trial.
Who is it recommended for?
Nagios XI is a major rival to OpManager in the Linux market. The system doesn’t run directly on Windows, so you would have to float it over Docker or VMware.
Pros:
- Open-Source and Cost-Effective: Being open-source, Nagios XI offers a cost-effective solution for organizations with limited budgets.
- Extensive Plugin Library: The vast plugin library offers a wide range of monitoring capabilities beyond basic ping checks, allowing for comprehensive network analysis.
- Scalable: Nagios XI can be scaled to accommodate large and complex network infrastructures.
- Active Community: The active community provides valuable support resources and helps with troubleshooting challenges.
Cons:
- Steeper Learning Curve: Setting up and configuring Nagios XI effectively requires technical expertise and a good understanding of plugins and scripting languages.
- Maintenance Burden: As an open-source solution, ongoing maintenance and updates are the responsibility of the user or IT team.
- Limited Out-of-the-Box Reporting: Extensive customization might be needed to generate reports specifically tailored for packet loss troubleshooting.
7. SolarWinds Network Performance Monitor
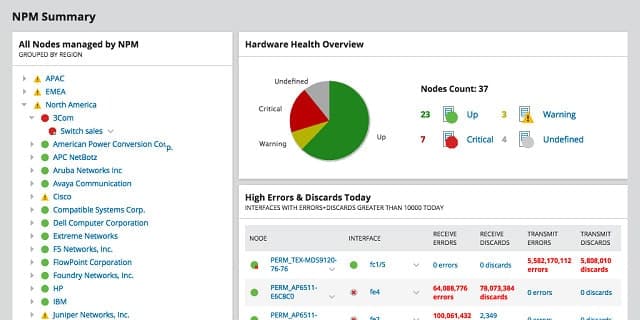
The SolarWinds Network Performance Monitor includes an autodiscovery function that maps your entire network. This discovery feature sets up automatically and then recurs permanently, so any changes in your network will be reflected in the tool. The autodiscovery populates a list of network devices and generates a network map.
Key Features:
- Packet Loss Monitoring: Specifically tracks packet loss across the network. This ensures precise detection and analysis of packet loss, facilitating targeted troubleshooting.
- Real-Time Ping Monitoring: Monitors network responsiveness with real-time ping sweeps, calculating packet loss percentages and identifying latency issues.
- Network Traffic Analysis: Analyzes network traffic flow data, providing insights into traffic volume, types, and source/destination. This helps identify potential bottlenecks or congestion causing packet loss.
- Path Tracing and Visualization: Tracks the path packets take through your network, helping pinpoint the specific location where packet loss might be occurring.
- Alerting and Reporting: Set up customizable alerts to be notified of spikes in packet loss or other network anomalies. Generate reports on historical data to track trends and identify recurring issues.
- Integration with Other SolarWinds Tools: Integrates with other SolarWinds products like Network Performance Monitor (NPM) and Server & Application Monitor (SAM) for a comprehensive view of network and application health.
Unique Feature
This package is an on-premises system, which is rare in this era of cloud SaaS platforms. The SolarWinds package is well bedded in, making it a reliable service for automated network monitoring.
Why do we recommend it?
SolarWinds Network Performance Monitor automates network device monitoring and raises an alert if a switch or other traffic processing device starts to approach its capacity limits. This feature is great for preventing packet loss because the overloading of network devices is the main cause of packet loss. Traffic analysis is available through a paid add-on module.
The monitor tracks the performance of wireless devices and VM systems.
The tool picks up SNMP messages that report on warning conditions in all network devices. You can set capacity warning levels when monitoring router traffic to spot routers and switches nearing capacity. Taking action in these situations helps you head off overcapacity which results in packet loss.
The management console includes a utility called NetPath that shows the links crossed by paths in your network.
The data used to create the graphic is continually updated and shows troubled links in red so that you can identify problems immediately.
Each router and switch in the route is displayed as a node in the path.
When you hover the cursor over a node, it shows the network latency and packet loss statistics for that node.
Network Performance Monitor extends its metrics out to nodes on the internet. It can even see inside the networks of service providers, such as Microsoft or Amazon, and report on the nodes within those systems.
NetPath gives great visibility to packet loss problems and lets you immediately identify the root cause of the problem. The SNMP controller module lets you adjust the settings on each device remotely, so you can quickly resolve packet loss problems on your network.
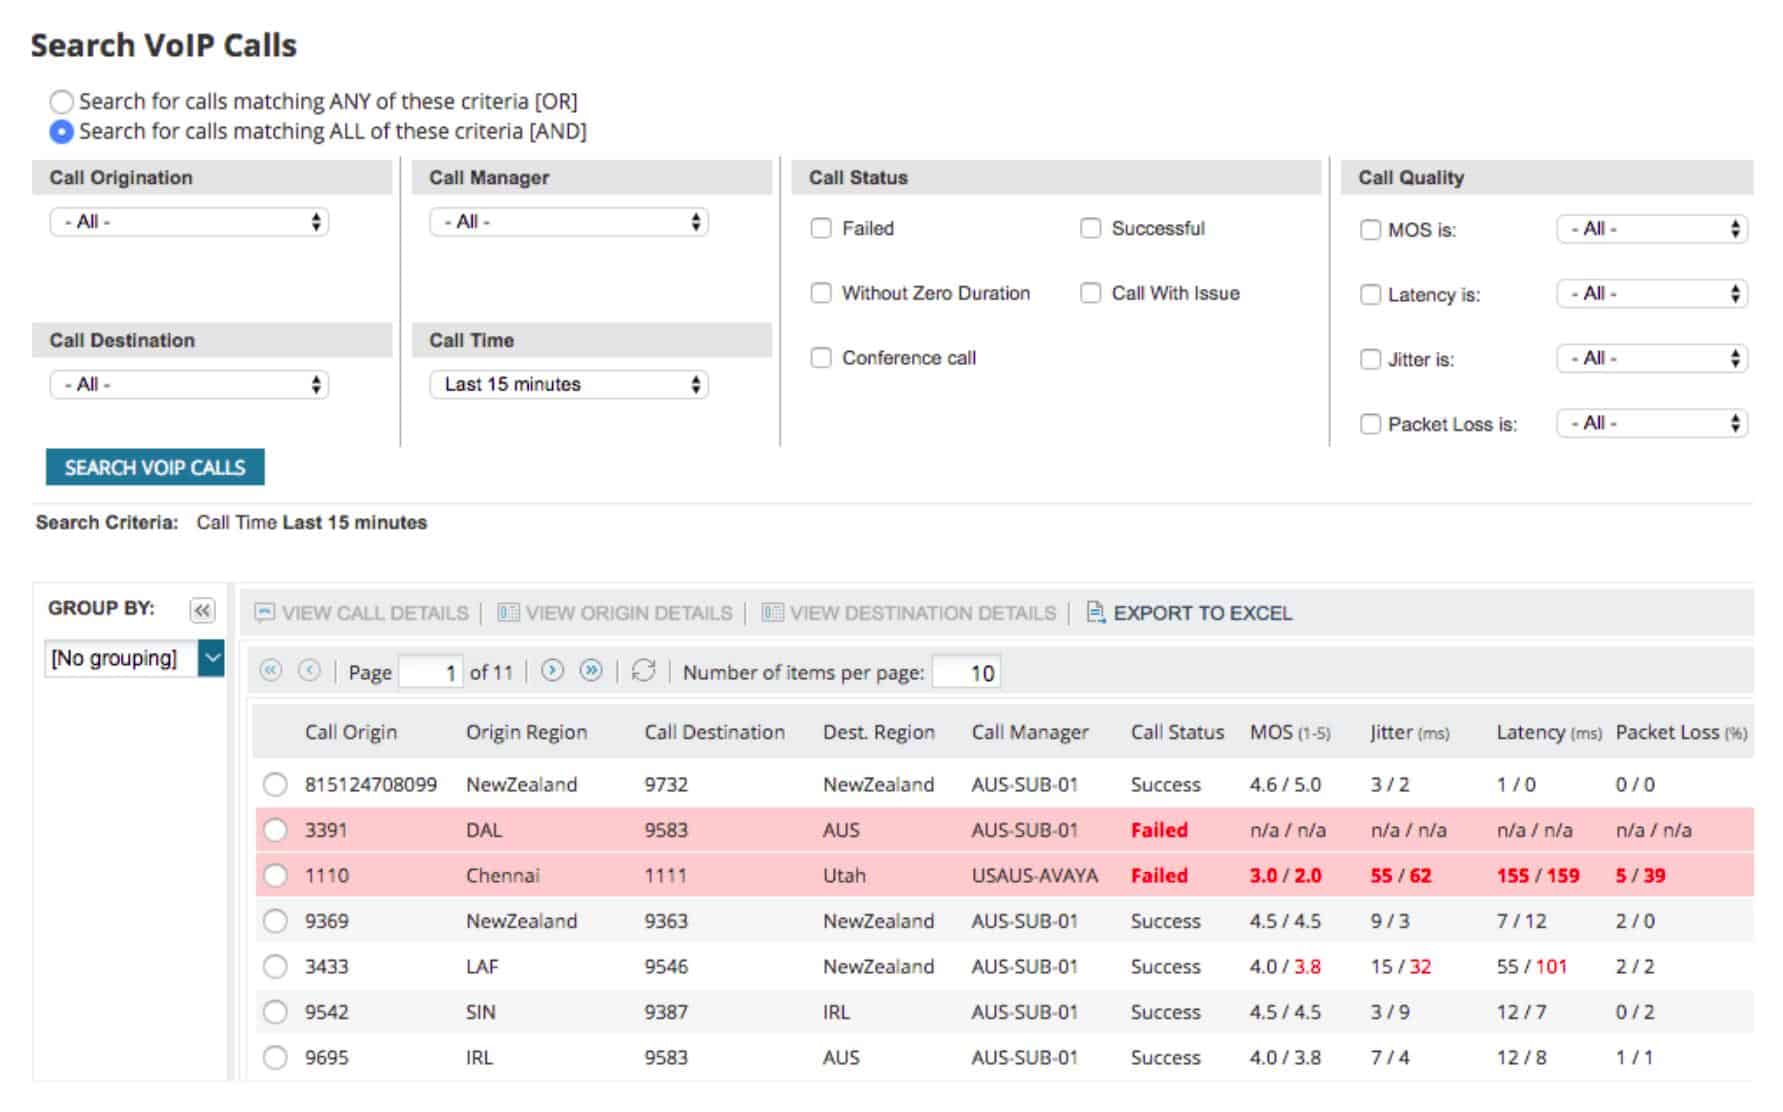
If you run your voice system over a data network, you should consider the SolarWinds VoIP and Network Quality Manager. This tool particularly focuses on network conditions important to successful VoIP traffic delivery. As packet loss is a major problem with Voice Over IP, this module hones in on that metric. The system includes a visualization module that shows the paths followed by VoIP, along with the health of each node in color-coded statuses. This tool extends VoIP quality monitoring across sites to cover your entire WAN.
Another good enhancement to the Network Performance Monitor is the NetFlow Traffic Analyzer. This extends observability to the gathering of traffic statistics that switches and routers accumulate during their operations. With this information, you can get extra insights into overloaded devices, which is the main cause of packet loss. You can buy the Network Performance Monitor and the NetFlow Traffic Analyzer together with the Network Bandwidth Analyzer Pack. You can assess that package with a 30-day free trial.
If you are going to need the VoIP and Network Quality Manager as well, consider the Network Automation Manager. This bundle gives you the Network Performance Monitor, the NetFlow Traffic Analyzer, the VoIP and Network Quality Manager, plus the User Device Tracker, the IP Address Manager, the Network Configuration Manager, and the SolarWinds High Availability service. In short, the package gives you all of the network monitoring and management tools that you could possibly need.
Who is it recommended for?
Any network manager would benefit from the service of SolarWinds Network Performance Monitor. However, all of the tools on this list offer exactly the same service, so potential buyers should try a few options before deciding.
Pros:
- Detailed Packet Loss Insights: Provides a comprehensive view of packet loss with features like path tracing, offering precise troubleshooting capabilities.
- Improved User Experience: Offers a user-friendly interface with drag-and-drop functionality and customizable dashboards for efficient monitoring.
- Scalability: NPM scales to accommodate growing networks and increasing monitoring needs.
- Extensive Support Resources: SolarWinds offers dedicated customer support and a large knowledge base for troubleshooting assistance.
Cons:
- Cost: NPM is a paid service, and pricing scales based on the number of monitored devices.
- Potential for Complexity: While user-friendly, advanced features like path tracing or integrating with other tools might require some technical expertise to leverage fully.
- Limited Out-of-the-Box Reporting for Packet Loss: While customizable reports are available, you might need to invest time in creating reports specifically focused on packet loss analysis.
Conclusion
Being able to easily remedy unforeseen buildup in packet loss will greatly assist you in performing your job well. Although the tools on this list are a little pricey, they pay for themselves in the long run through productivity increases and lower bandwidth requirements.
Fortunately, all of those tools we outlined above are available for free trials. Check out a few to see which gives you the best opportunity to prevent or reduce packet loss in your network.
Leave a message about your experience in the comments section below, and help others in the community learn from your experience.
Packet Loss FAQs
What causes packet loss on a network?
The most common cause of packet loss on a network is overloaded network devices. Switches and routers will drop data packets if they cannot process them in time. Other major packet loss causes include faulty equipment and cabling.
How do you calculate packet loss?
Take a count of the number of packets sent at one point on the network and the rate of packets received at another node. Subtract the number of packets received from the number of packets sent and divide the result by the number of packets sent to get the packet loss rate.
Why do I have packet loss with Ethernet?
Ethernet cables will lose packets if there is heavy electromagnetic interference nearby, if part of the cable is damaged or if the connectors at each end are loosely plugged into equipment.
Does packet loss affect ping?
Packet loss is one of the factors measured by the Ping utility. However, what is commonly referred to as “ping” is the round-trip time (RTT). This is not directly changed by packet loss – the two metrics are factors that influence response times over networks.
Is some packet loss normal?
Some packet loss is to be expected and isn’t usually a major problem. The rate of packet loss to be expected greatly depends on the size and reliability of the network. The greater the number of hops a transmission needs to take, the greater the risk of packet loss. There should be a lot less packet loss experienced on a private network than on the internet. Also, small networks should experience less packet loss than large networks in normal conditions. In general, a packet loss rate of 1 to 2.5 percent is seen as acceptable. Packet loss rates are generally higher with WiFi networks than with wired systems.
Is 2% packet loss bad?
Any packet loss will slow down response time but on a public medium like the internet, an expectation of 100% delivery success is unreasonable. Be prepared to encounter at least a little packet loss and anything below 5% is considered acceptable.
Can a VPN help with packet loss?
In truth, a VPN can’t do much about packet loss if the loss is caused by poor performance by the ISP’s equipment or an overloaded router. All a VPN does is encrypt packets and alter the path that a connection would normally take to reach a specific destination by diverting the connection through a mediating server. Those packets still have to pass through your gateway to the internet and the equipment of your ISP. If faults at those points are causing packet loss, they will drop packets regardless of where they are going or how they have been encrypted.



Correction on number 5: “If you’re” instead of “If your”
Thanks!