Most servers come with their own management and administration tools that do a perfect job. Sometimes, a little extra help from third-party tools can make for an even smoother UX (user experience) and better server performance.
Here’s our list of the best Microsoft Exchange Server monitoring tools:
- SolarWinds Server & Application Monitor EDITOR’S CHOICE This tool lets you deep-dive into Exchange Server’s metrics to help determine and monitor overall mailbox capacity management thanks to its easy-to-use dashboards for viewing critical information. Access a 30-day free trial.
- ManageEngine Exchange Reporter Plus (FREE TRIAL) This package monitors, audits, and reports on Microsoft Exchange Server and Skype for Business. Available in free and paid versions, you can run it on Windows Server or Azure. Start a 30-day free trial.
- ManageEngine OpManager (FREE TRIAL) A well-rounded tool that also covers the network and other servers that support it; it offers advanced technology but is easy to configure and use. Start a 30-day free trial.
- Paessler PRTG Network Monitor (FREE TRIAL) This is also a tool that can be used to monitor Exchange Server as well as any supporting servers including remote ones and regardless of the network configuration. Get a 30-day free trial.
- Site24x7 Microsoft Exchange Server Monitoring (FREE TRIAL) This service is delivered from the cloud and can scan both cloud-based and on-premises implementations of Exchange Server. Start a 30-day free trial.
- Nagios This on-premises system monitoring package is available in free and paid versions and both include Exchange Server performance tracking. Runs on Linux or a VM.
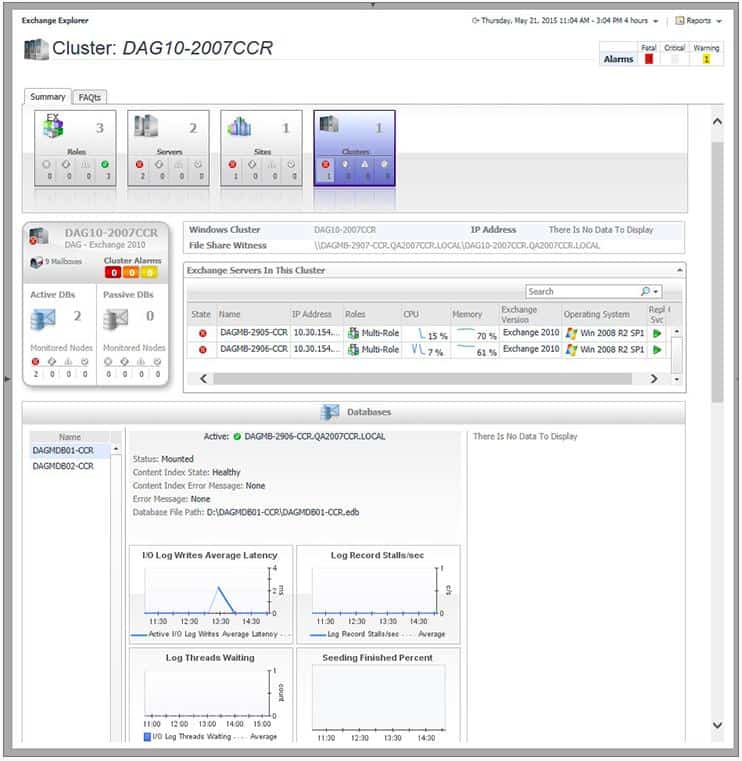
- Foglight for Exchange Dedicated Microsoft Exchange monitoring tool that is outstanding in reporting and alerting issues for easier troubleshooting and resolution.
What are Microsoft Exchange Server monitoring tools?
Microsoft Exchange Server is the most widely used email, calendaring, and communication server. Its popularity arises from its ease of use, powerful applications, and clear navigation controls – mainly because of its familiar GUI – and its proven performance, robustness, and reliability.
Like all servers, Exchange also needs to be monitored and tracked to make sure it is always at optimal performance levels.
Even though its own administration and configuration dashboard can do much of the monitoring well, it can still be further enhanced – or even out-performed – by some of the best Microsoft Exchange Monitoring tools.
The best Microsoft Exchange Server Monitoring Tools
Our methodology for selecting Exchange Server monitoring software
We reviewed the market for Exchange Server monitoring tools and analyzed the options based on the following criteria:
- A package that combines application and server monitoring
- A system that can predict capacity shortages
- A service that offers notifications by email or SMS
- A monitor that can spot network or internet connection problems
- Monitors for cloud services as well as on-premises implementations
- A cost-free assessment opportunity in the form of a demo system or a free trial
- A good mix of services offered at a reasonable price
Using this set of criteria, we looked for a range of systems that are scalable to be suitable for businesses of all sizes.
1. SolarWinds Server & Application Monitor (FREE TRIAL)
SolarWinds Server & Application Monitor (SAM) is an Exchange Server monitoring tool that has the ability to drill into any component for easier troubleshooting of server issues.
Key Features:
- Monitors Server Resources: In addition to Exchange Server software monitoring
- Includes OS Performance Tracking: Watches operating system activity
- Activity Correlation: Connects Exchange Server demands to underlying services
- Demand Forecasting: Predicts resource shortages
- Includes Performance Alerts: Warns of resource shortages or unexplained slow responses
Why do we recommend it?
SolarWinds Server & Application Monitor provides performance tracking for software, services, and servers. The tool includes the ability to monitor Microsoft Exchange Server along with many other applications. This system will identify chains of applications, services, and server resources and it is also able to trace down to cloud platforms.
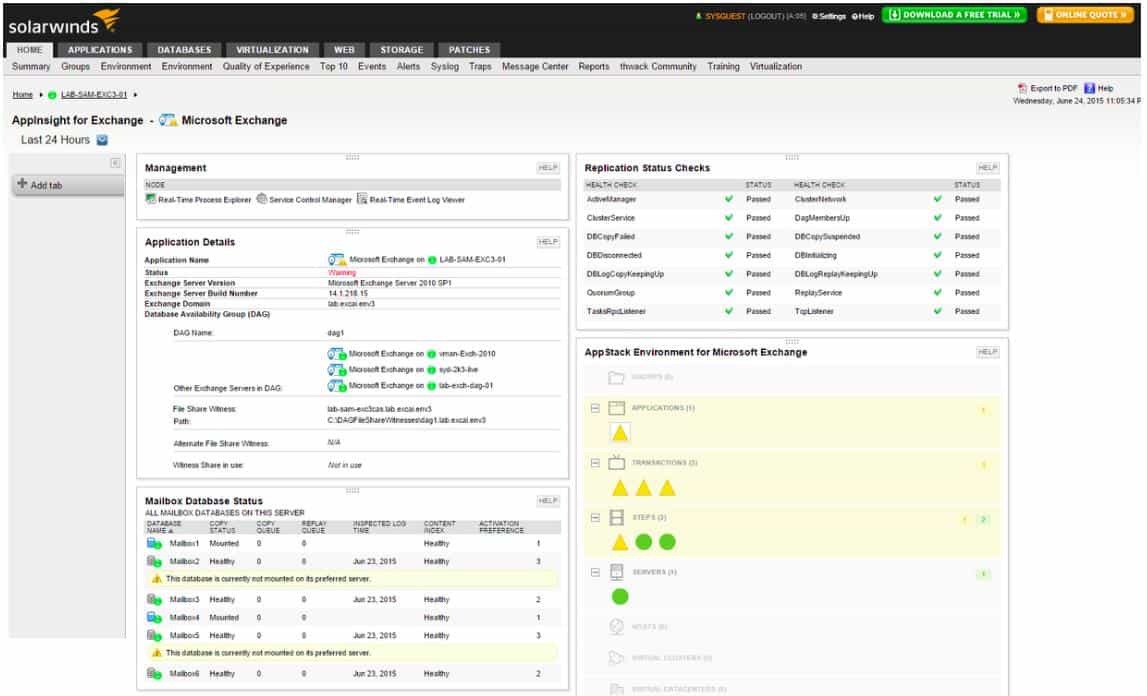
SolarWinds SAM was built to monitor Exchange Server for important metrics that could impact its performance: mailbox database size, mount status, replication status, information store, and much more; and when it detects an issue it triggers an alert.
It can drill right into an individual mailbox’s details and help with the decision on whether or not a large mailbox needs to be moved to another database in case there is a need to improve load distribution.
The tool also helps prevent email storms with the help of its Active Exchange Server Monitoring. With the help of SAM, admins can track critical aspects of Exchange like the Hub Transport Server, Mailbox Server, Edge Transport server, and the CAS – and a failure in any one of them will trigger alerts.
SAM has an added advantage as it allows the monitoring of servers other than Exchange Server itself – it can be used to monitor other supporting Microsoft servers, applications, and services that help keep Exchange Server up and running; examples are DNS, DHCP, IIS, and CRM servers.
It proactively alerts administrators to keep them informed while, at the same time, keeping an eye on forecasted storage metrics – using historical and real-time data – to keep Exchange operational into the future.
SAM automatically tracks and saves data about incidents, so it can be used in the future to easily troubleshoot issues; it also uses both real-time and historical Exchange Server performance data to allow admins to drill down into any older issues for more details – all thanks to SAM’s advanced reporting tools.
Who is it recommended for?
This tool has a great deal of capacity to cover multiple sites and platforms and many applications simultaneously. Companies that operate hybrid environments will particularly benefit from the system. It is designed for use by large businesses; SMBs won’t need the full capabilities of this tool.
Pros:
- Track Exchange-Specific Metrics: Records as mailbox sizes, backpressure, transport services, and server resource utilization
- Proactive Alerts: Warns when performance deviates from the baseline
- Network Statistics: Supports both SNMP monitoring as well as packet analysis
- Customizable Dashboard: Uses drag-and-drop widgets
- Robust Reporting System: Pre-configured compliance templates
Cons:
- Designed with Large and Enterprise Networks in Mind: Too big for small businesses
SolarWinds offers a 30-day free trial of its SolarWinds Server & Application Monitor – it would be a good place to start to discover the full potential of this tool.
EDITOR'S CHOICE
SolarWinds Server & Application Monitor is our first choice tool for monitoring Microsoft Exchange Server. It automatically discovers the Exchange Server environment and you can immediately begin monitoring with its default presets. Easy to install and a pleasure to use.
Start 30-day Free Trial: solarwinds.com/server-application-monitor
OS: Windows Server 2016 or later
2. ManageEngine Exchange Reporter Plus (FREE TRIAL)
ManageEngine Exchange Reporter Plus is a specialist reporting tool for Exchange Server and Exchange Online. The highest edition of this package also provides auditing and monitoring for the Exchange email server system.
Key Features:
- Pre-Designed Report Layouts: 450 report templates
- Not Just for Exchange Server: Reports on Skype for Business
- Main Purpose: Reports for Exchange Server and Exchange Online
- Deployment Options: Host on-premises or on Azure
Why do we recommend it?
ManageEngine Exchange Reporter Plus is an analyzer and auditor for Microsoft Exchange on the cloud and on-premises. It will also cover Skype for Business. This system provides assessment scans of your Exchange Server setup and email account configurations. It also logs activities, producing summaries.
Even if you host this package on your on-premises server, it presents a Web-based console. The system reports on mailbox issues such as size in bytes and number of messages, mailbox growth trends, and quota limits. You can also access server and mailbox traffic reports.
All of the reports can be run on demand with an interface that lets you select the required information source and a time period that should be covered by the examination delivered by the report. The interface for the report launcher is straightforward with a tabbed panel allowing the inspection of Exchange Server, Exchange Online, or Skype for Business as the subject of the report.
The tool can be set up to run reports on a schedule. This allows you to run data collection unattended overnight, choosing to specify the frequency of report cycles, such as daily or weekly. You can also specify the time that each report should run. Components that can be reported on include ActiveSync and Outlook Web Access (OWA).
You can see the status of these services over time on live screens in the console as well. The top edition, called Professional, also provides activity and performance monitoring for the three systems covered by the reporter. This plan also includes auditing tools for Exchange Server and Exchange Online. The lower-paid edition, called Standard, just provides the reporting tool. There is a Free edition available that is the same as the Standard plan but with a limit of 25 Exchange mailboxes.
Who is it recommended for?
This tool is useful for businesses that need to provide compliance reporting to meet the requirements of data protection standards. It is useful for compliance with SOX, HIPPA, PCI DSS, GDPR, and GLBA. The system also provides live monitoring of Exchange Server, including the tracking of database management activity.
Pros:
- Reporting Engine: Extensive reports on demand
- Multiple Focuses: Reporting for Exchange Server, Exchange Online, and Skype for Business
- Automated Data Processing: A report scheduler for unattended data gathering
- Compliance Auditing: Auditing and monitoring with the Professional edition
Cons:
- No SaaS Option: The cloud-hosted version is not a SaaS package
The Exchange Reporter Plus package installs on a Windows Server or on an Azure account. You can get the Professional Edition on a 30-day free trial. If you choose not to buy at the end of the trial, the software will continue to work as the Free edition.
3. ManageEngine OpManager (FREE TRIAL)
ManageEngine OpManager for Exchange Monitoring comes with added support for PowerShell which makes it an easy-to-use tool for direct hands-on management of an email server.
Key Features:
- Tracks the Performance of IT Hardware: Monitors network devices and servers
- Identifies Point-of-Failure: Notifies of hardware issues
- Also Tracks Microsoft Exchange: Specific routines for monitoring Exchange Server
Why do we recommend it?
ManageEngine OpManager is a monitoring package that covers networks and servers. The system will also monitor some applications and that includes Exchange Server. The multi-level simultaneous monitoring helps to identify all of the factors that could undermine the delivery of your email system. It provides root cause analysis if problems arise.
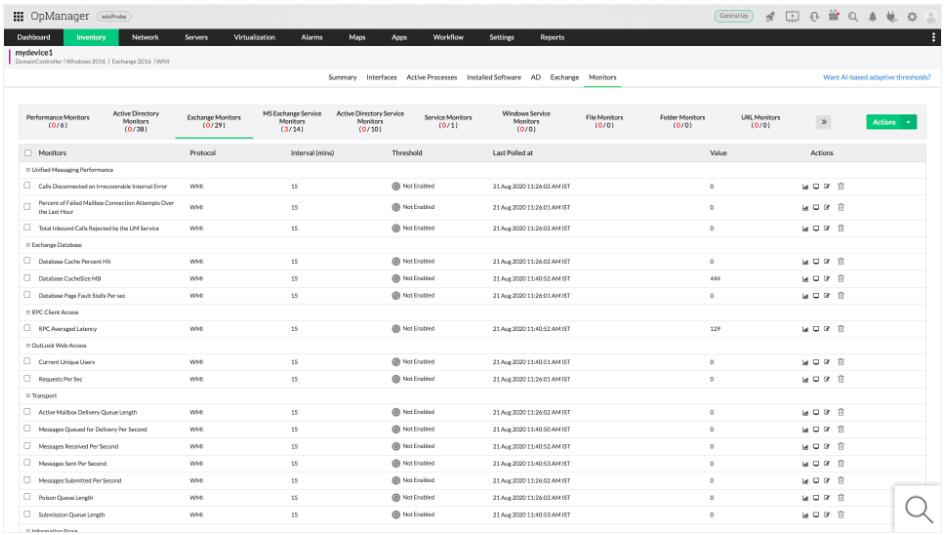
It offers deep insights into details about critical information regarding database size, space occupied; it detects the number of dormant or inactive mailboxes to delete to free up resources. Admins can check to see if a database is shared by too many users and, if needed, move a few of them to another database for optimal performance.
It can troubleshoot Outlook connectivity issues by measuring the number of requests per second or average response times, for example, using Web Access Counters. It tracks failures by identifying mailbox access failures, directory access failures, number of rejected inbound calls, and other details.
Admins can use various tools to ensure Exchange Server security – against spam and viruses, for example – by monitoring details like scan time, the number of rejected or timed-out scan requests, and blocked recipients; they can also keep an eye on the server burden using load assessment counters and queue length counters.
ManageEngine OpManager can track communication issues in integrated dial-in access performance and even monitor emails, voicemails, faxes, calendar information, and contacts to make sure that all voice and email messages reach their destinations.
It measures memory and disk utilization while also keeping an eye on the status of various services that are critical for the performance of an Exchange Server. It monitors mailbox database sizes, queues, mounted status, mailbox quotas (both used and remaining), the total number of mailboxes, and the average mailbox size.
Who is it recommended for?
ManageEngine OpManager is a well-establish, stable, and reliable monitoring package. There is a Free edition available but that won’t give you Exchange Server monitoring. The price of the lowest-paid version is accessible for small businesses. This package runs on Windows Server or Linux and it is also available on AWS and Zure Marketplaces.
Pros:
- Customizable: Over 200 widgets to build unique dashboards and reports
- Supports PowerShell Commands: Great for lightweight remote administration
- Monitors All Key Exchange Performance Metrics: Operates on the server and mailbox level
- Intelligent Alerting: Reduces false positives and eliminates alert fatigue across larger networks
Cons:
- Function Spread: The interface could be made easier to use by consolidating some tabs together
ManageEngine offers a free trial.
4. Paessler PRTG Network Monitor (FREE TRIAL)
Paessler PRTG can be used to monitor several types of servers including Exchange Server. Thanks to its superb remote monitoring capability it can even be deployed on a distributed network structure.
Key Features:
- Full-Stack Observability: Combines network, server, and application monitoring
- Activity Correlation: Links Exchange Server requirements to resource availability
- Automated Monitoring: Alerts for performance problems
Why do we recommend it?
Paessler PRTG Network Monitor also tracks the performance of servers and applications. Among its list of sensors are systems that are designed to report on the availability, capacity, and performance of Exchange Server. The tool can contact Exchange Server running on the cloud or on any site.
PRTG’s dashboard is detailed and easy to navigate and also shows all required Exchange Server information. PRTG monitors all email protocols: IMAP, POP3, and SMTP. It keeps track of the database information of an Exchange Server – including backups – using Remote PowerShell; it even performs tests using the SMTP & POP3 Round Trip Sensor to gauge the time it takes for an email to reach an IMAP or POP3 mailbox after being sent using SMTP protocol.
PRTG tracks usage of critical information regarding mailboxes, public folders, subfolders, and the number of items in the outgoing queue of the Exchange Server. It ensures the security of an Exchange Server by testing the SSL (Secure Sockets Layer) connectivity to the port of a device. It also keeps track of other peripheral servers like the number of sent/received emails in an IIS server using WMI (Windows Management Instrumentation) or Windows performance counters, for example.
It’s easy to install and use – PRTG comes with a set of pre-configured sensors for Exchange that are created automatically during the setup process. Its highly customizable alert system allows for alarms to be triggered – this, in turn, allows for issues to be resolved before they build up.
Who is it recommended for?
The PRTG package is suitable for use by any size and type of business. The system is available as a SaaS platform or you can download the monitoring software and run it on Windows Server. A Free edition provides you with an allowance of 100 sensors.
Pros:
- Multiple Methods: Packet sniffing, WMI, and SNMP
- Fully Customizable Dashboard: Drag and drop editor for screens and reports
- Alert Forwarding: Notifications by SMS, email, and Slack
Cons:
- Limits on Free Version: Only 100 sensors
Paessler offers a 30-day free trial of PRTG.
Related post: Testing Exchange Server Connectivity
5. Site24x7 Microsoft Exchange Server Monitoring (FREE TRIAL)
Site24x7 Microsoft Exchange Server Monitoring is part of the Website Monitoring package of tools on the Site24x7 cloud platform. The Website Monitoring service covers all manner of digital assets, not just websites. This tool is concerned with checking that all of the components of Exchange Server are contactable and performing correctly.
Key Features:
- Backwards Compatibility: Supports versions 2007, 2007, 2010, 2013, and 2016
- Availability Monitoring: Polls all host and client components
- Tracks Response Times: Alerts for performance problems
Why do we recommend it?
Site24x7 Microsoft Exchange Server is part of a platform of system monitoring and management tools, so you don’t just get Exchange monitoring for your money. You also get website, server, infrastructure, Web application, and network monitoring. This represents value for money. The tool will raise an alarm if Exchange Server stops responding or runs slowly.
Exchange Server is heavily dependent on Remote Procedure Call (RPC) over HTTP. This is the mechanism that enables Outlook clients to access the Exchange Server mailboxes. So, it is a vital element in the email system and the Site24x7 monitor pays close attention to it. Response time is important and that measurement takes in the efficiency of database transactions – Exchange Server mailboxes are all held in a database.
Small variations in response times don’t create problems. However, performance falls that continue to slide represent an issue that needs to be dealt with. You can also drill down to identify each stage in mail fetching, thus you will be able to see whether a slow response is due to RPC communications or database access. The monitoring service includes a series of performance expectation thresholds and a drop in RPC response will trigger one, raising an alert.
Alerts in the Site24x7 system all appear in the monitoring console. You can set up the platform so that it forwards alerts to technicians as notifications. These notifications can be sent as voice calls, SMS, emails, or Slack messages.
The package also tracks SMTP In/Out speeds. Your email system transports emails to and from your Exchange server with SMPT, which movement of mails between the server and the Outlook clients is managed by RPC. This is why those two components are the most important services to track in an Exchange Server-based system.
The simultaneous tracking of your entire IT system by all of the components in the Site24x7 platform provides instant root cause analysis when problems arise. All of those other monitoring modules include performance alerts, so if a problem in Exchange Server is really down to a network issue, you will already have received an alert about the network, saving you from wasting time looking into Exchange Server performance.
Who is it recommended for?
Any business that runs Exchange Server as its email system will benefit from this package. The Site24x7 platform provides much more than just email monitoring, so you get full-stack observability from the Site24x7 plans. You can’t take out a subscription to the Exchange Server Monitoring tool by itself, so make sure you can use all of the modules of Site24x7 before signing up.
Pros:
- Companion Modules Available: Exchange Server security vulnerabilities
- Full-Stack Observability: Monitors Exchange Server performance in context
- Performance Alerts: Notifications by email, SMS, voice call, or Slack message
Cons:
- Not a Standalone Subscription: It is bundled into system-wide monitoring plans
A number of the plans offered by Site24x7 include the Microsoft Exchange Server Monitoring unit. Take a look at the Website, Infrastructure, All-in-One, and MSP plans. The MSP edition is structured for use by managed service providers. You can get to know the entire Site24x7 platform by requesting a 30-day free trial.
6. Nagios
Nagios is a company that is known for its multitude of administration and monitoring solutions that track the health and performances of websites, web content, networks, and servers – including Microsoft Exchange – among a myriad of digital assets.
Key Features:
- IT Asset Monitoring: Monitors networks, servers, and applications
- Extensible with Thousands of Free Plug-Ins: From Nagios Exchange
- Exchange Server Monitoring: Delivered as a plug-in
Why do we recommend it?
Nagios is available in a free version, called Nagios Core, and a paid version, called Nagios XI. Both versions are able to monitor Microsoft Exchange Server along with many other applications. The package will simultaneously track server resource availability and network device statuses. The Nagios package can be expanded by free plug-ins.
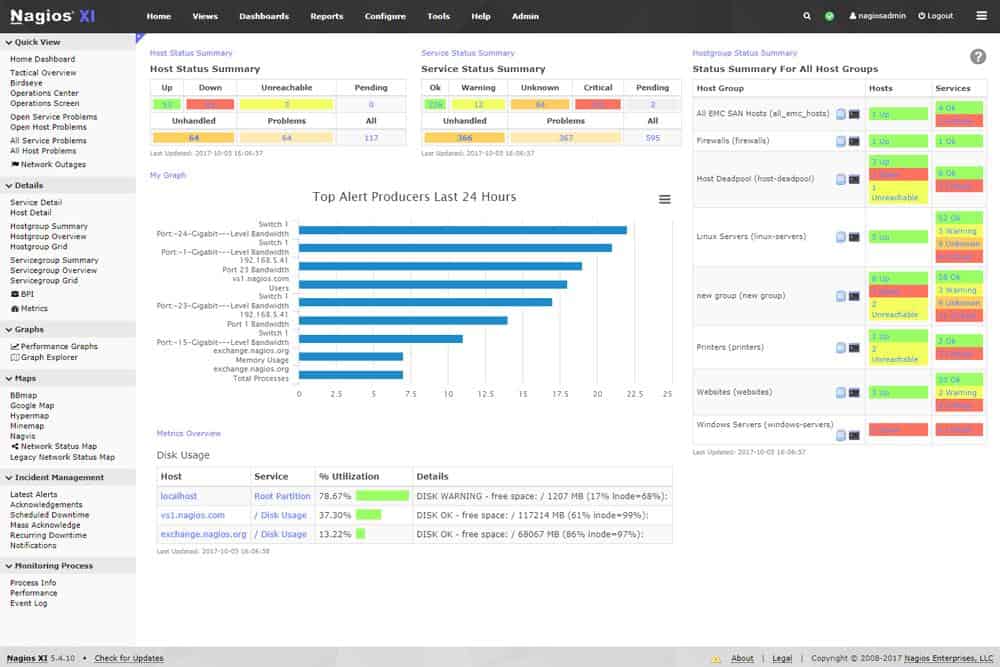
System administrators prefer Nagios because it does everything – and whatever it doesn’t have, can be built and integrated into it – thanks to the active community that continues to enhance it by inventing new plugins. But, most importantly, it offers complete monitoring of Microsoft Exchange mail servers – including the server’s availability, protocol availability, memory usage, network status, and other server statistics that can help an administrator’s effectiveness. What’s more, healthy figures and information cells are highlighted in green which means those in any other color can be easily spotted and looked into.
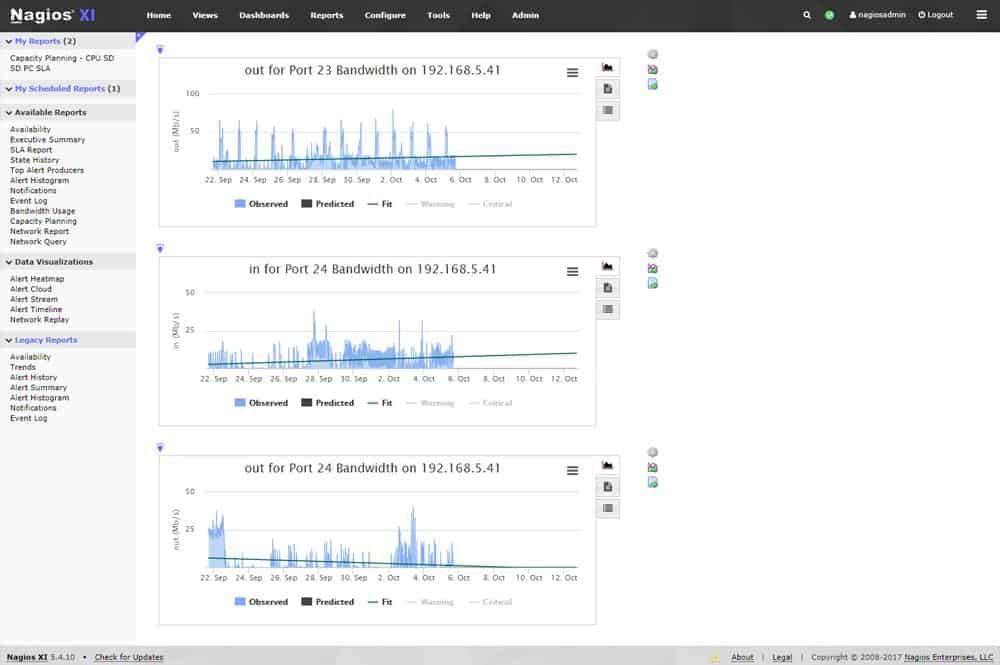
There many additional plugins that further enhance the capabilities of this tool as well as other wizards that help with features like email delivery monitoring. Meanwhile, the new easy-to-customize dashboard provides a high-level overview of hosts, services, and network devices – and yet, users can add third-party plugins to allow the tool to drill down and monitor business applications running on the devices.
Nagios comes with a customizable GUI which lets users tweak it until they feel comfortable with the layout and design. It can be installed on Windows or Linux operating systems; there is also a version for VMWare.
If there is a drawback to this monitoring tool it may be that it is a little bit daunting for first-time users – and may even require an IT professional to run it. But, then again, users can get help from the Nagios community or opt for a commercial support package from Nagios Enterprise.
Nagios Core is open-source and free, and Nagios XI is a commercial tool based on the Nagios Core but with additional features.
Who is it recommended for?
Nagios XI is designed for use by mid-sized and large businesses. The Nagios Core version is very comprehensive, but its interface is not so good. However, this free system will appeal to cost-conscious small businesses. The software package is written for Linux but you can also run it over VMware or Hyper-V on Windows.
Pros:
- Adaptations Available: Provided by the community as well as through Nagios releases
- Dependency Monitoring: Connects Exchange services to the physical server hosting it
- Color-Coded Statuses: Helps administrators identify problems quicker
Cons:
- Traffic Analysis Not Included: Bandwidth monitoring is a separate purchase
Nagios offers a free trial (monitor seven or fewer hosts and up to 100 total host and service checks) or a demo version of their Exchange Server monitor.
7. Foglight for Exchange
Quest Foglight for Exchange is perhaps one of the lesser-known Microsoft Exchange Server monitoring tools out there, but it is one that should certainly not be underestimated.
Key Features:
- Multi-Level Monitoring: Tracks physical and virtual infrastructure supporting Exchange Server
- Anomaly Detection: Spots unusual activity
- Round-the-Clock Activity Tracking: Continuous performance monitoring
Why do we recommend it?
Quest Foglight for Exchange will monitor Exchange instances that are hosted on premises or in the cloud. This system’s performance thresholds can be automatically adjusted to align with any service level agreements (SLA) that you need to comply with. The package will analyze the components of Exchange to predict evolving issues.
Unlike other tools in this list, Foglight for Exchange is a dedicated tool created to monitor Exchange Servers. It is quick to detect, diagnose, and resolve performance and availability issues that could impact the performance of Microsoft Exchange Servers in the physical, virtual, and cloud environments.
It has a dashboard that is sparsely populated – but, it has all the information any admin might need to be displayed clearly – and it is easy to navigate. Glancing at the dashboard, an admin would be able to see: critical load areas, any abnormal flows of data, as well as the top consumers of resources across Microsoft Exchange – it even provides them with insights into mailboxes that are running in the cloud.
It offers Office 365 monitoring which means it can monitor authentication of cloud as well as on-premises mailboxes. Foglight’s advanced permission controls make it easy to set specific, role-based user access; meanwhile, advanced permissions controls make it easy to work with user-based permissions.
It is easy to schedule and run diagnostic reports – in fact, a drag-and-drop tool allows users to produce ad hoc, scheduled, and fully automated reports for SLAs, diagnostics, and server availability.
These reports help with more detailed and effective troubleshooting capabilities and have built-in customizable alerts that can be configured to be triggered in case of issues with, or deviations from, performance and operational standards.
Who is it recommended for?
The Foglight system is an on-premises package that will run on Windows Server, Linux, or Solaris. It can also be run over a VM. The system is suitable for use by any business that relies on Exchange Server for its email system. You have to buy and install Foglight for Virtualization to use the Exchange monitor.
Pros:
- Specialized Monitoring Tool: Built specifically for monitoring only Exchange servers
- Instant Health Reports: For Exchange services, mailboxes, and resource consumption
- SLA Tracking: Proactive monitoring
Cons:
- Narrow Focus: Does not provide insights into other systems outside Exchange
You can download a free trial.
Choosing a Microsoft Exchange Server monitoring tool?
The email server is perhaps one of the most important servers on a corporate network. It is the communication server that everyone relies on to deliver messages, share ideas, and collaborate on. It, therefore, makes sense to have a dedicated Microsoft Exchange monitoring tool to keep an eye on this important asset.
Among the advantages of such tools we have:
- Ensuring the health of Exchange Servers to guarantee uninterrupted communication.
- Making sure an Exchange Server is up and running, relaying messages to destinations, and that it is in communication with other servers in the domain.
- Keeping on top of issues before they occur and troubleshooting them for quicker resolution.
- Keeping and updating audits to help with reporting, troubleshooting, and tracking.
- Informing administrators and users about stuff like policies or discrepancies in bandwidth or storage utilization to prevent bottlenecks or even total server crashes.
- Sending – and if necessary or unanswered, escalating of – smart alerts to administrators to improve tech-support response times.
- Checking configurations and monitoring packets and traffic to making sure an Exchange Server hasn’t been taken over by malicious code or entities for spamming and spoofing purposes, for example.
Exchange Server monitoring FAQs
How can I test my Exchange Server health?
If you have skills in PowerShell, you can use the PowerShell cmdlet Test-ServiceHealth to examine the availability of the services in Windows that are required by Exchange Server. The function will return an error status with an explanation if one of the needed services is not running.
How do I check my mailbox database status?
You can use a PowerShell cmdlet to examine the statuses of your Exchange mailbox database. This tool is called Get-MailboxDatabase and if you use it without parameters, it returns information about all databases for Exchange. You can limit that output by giving the server name as a parameter.
What is the Exchange database?
An Exchange database (EDB) is a list of the mailboxes that are available in Exchange. Each record in the database shows the user account from Active Directory that the mailbox is assigned to.


