Amazon Elastic Load Balancer (ELB) health checks are essential for maintaining the reliability and performance of applications deployed on AWS. These checks ensure that traffic is only directed to healthy instances, enhancing the overall availability and resilience of your infrastructure.
ELBs dynamically monitor the health of registered targets, including EC2 instances, using specified protocols and parameters. If an instance fails these health checks, the ELB routes traffic away from it until it recovers, thus minimizing downtime and user disruption.
Health checks provide key insights into the functioning of your environment by continuously evaluating the responsiveness of each instance. They help identify issues like application crashes, server overloads, or configuration errors that might compromise functionality. By proactively detecting and isolating underperforming instances, you can ensure your application remains accessible and performant, even under varying loads.
Configuring ELB health checks involves selecting the appropriate protocol (e.g., HTTP, HTTPS, TCP), defining the ping path, and setting thresholds for response times and retries. Properly tuned health checks contribute to efficient load balancing, ensuring optimal resource utilization while reducing the risk of bottlenecks or failures.
For organizations leveraging microservices or containerized architectures, ELB health checks are indispensable for managing complex, distributed systems. They enable seamless scaling and support high availability by automatically adapting to changes in the underlying infrastructure.
This article offers a comprehensive guide to setting up and optimizing ELB health checks, covering practical configurations and troubleshooting tips to ensure your applications consistently deliver high-quality performance.
Here is our list of the best ELB monitoring tools:
- Paessler PRTG EDITOR’S CHOICE An infrastructure monitoring package that includes AWS monitoring for factors that include ELB and health check information. Start a 30-day free trial.
- Datadog A cloud-based system monitoring tool that includes an AWS integration that has specialist ELB screens with health check status reporting and performance alerts. Use the APM service to identify service dependencies and perform root cause analysis for performance issues.
- Dynatrace An application performance monitor that includes AWS status monitoring and covers ELB health check reporting.
- ManageEngine Applications Manager A monitor for applications that is able to track the performance of cloud services as well as applications operating on-premises. It includes an extension for monitoring AWS applications, such as ELB.
- SolarWinds Server & Application Monitor This monitoring system can supervise both on-premises and cloud-based servers and the applications that run on them – including AWS ELB.
All about ELB
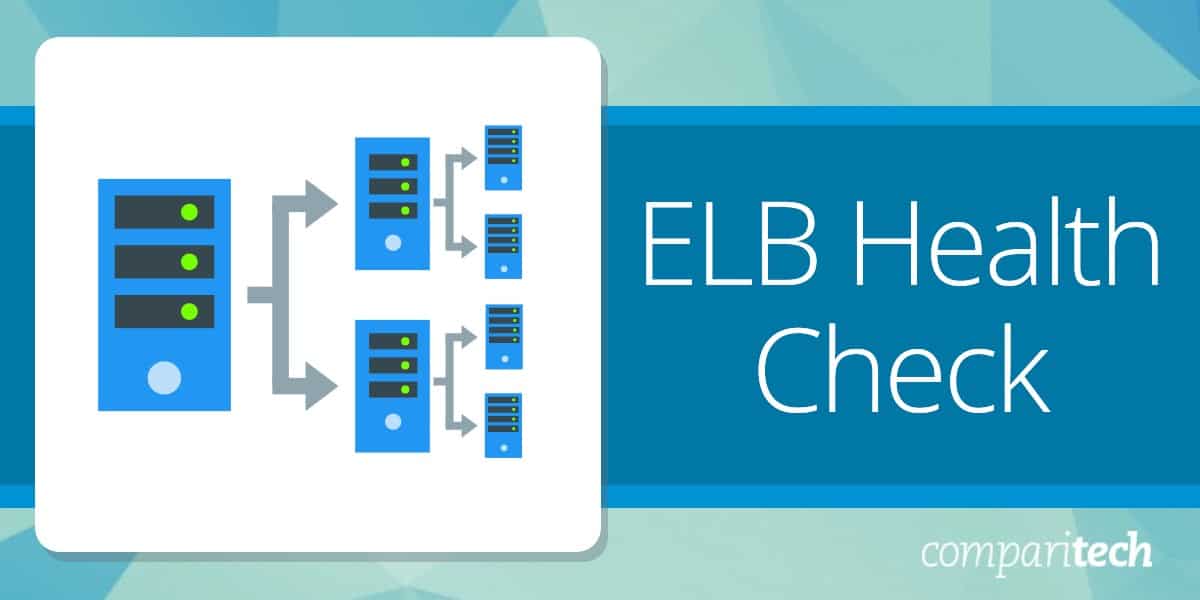
The concept of a load balancer distributes traffic across resources. This is particularly widely used to share out work between a group of servers or to channel traffic down parallel links on a network. As a cloud-based service, Elastic Load Balancing is suited to distributing incoming traffic from the internet across EC2 instances. As it is based in a remote location, the ELB service can even divert traffic to resources that are located in many different locations.
The ELB service is available in four flavors:
- Classic Load Balancer This is suitable for service on EC2-classic networks. It was the original Elastic Load Balancer at the network level offered by AWS.
- Network Load Balancer The newer version of the EC2 network-level traffic load balancer. This will handle TCP and UDP traffic on the way to Amazon Virtual Private Cloud (VPC) instances.
- Application Load Balancer This is good for distributing application requests, such as HTTP and HTTPS traffic across Amazon VPC instances.
- Gateway Load Balancer This type of traffic management is suitable for directing traffic to virtual appliances, such as firewalls.
The load balancing system that is now called the Classic Load Balancer was one of the earliest services added to Amazon’s EC2 platform. This is now called Elastic Load Balancer Version 1. The other three ELB types are grouped together as Elastic Load Balancer Version 2.
Assessing server availability
The concept of a “health check” for ELB is a test for availability. However, it isn’t a test of the ELB system, it is a test that is issued from the ELB to the EC2 instances that it protects.
The purpose of the ELB health check is to let the load balancer know which instances are able to accept incoming requests. The health check is a little like a ping. The load balancer’s job is to send traffic to each virtual server and so it is a very straightforward task for it also opens up a separate connection for status tests.
Each instance responds to the status message unless there is a very serious status problem that means it is unable to communicate. The protocol expects each response to be made within 30 seconds. The load balancer does not record the server as being unavailable if the process times out before a response arrives. The ELB sends a series of tests and if none of them receive a response the load balancer then records the VPS as unavailable with the status OutOfService.
All types of ELB load balancers include the health check system.
Setting up ELB health checks
In all types of Elastic load balancers, you need to create target groups that instruct each load balancer instance which resources it is managing. The specifications for the health check process are built into the settings of each target group.
Each target group can be specified to direct different types of traffic to different sets of virtual servers or appliances. The health check specifications are bundled into the target group settings. When you create a target group, you also create health check rules. The settings for the health check have a default configuration, so you will get health checks performed automatically on your virtual resources whether you know about them or not.
Here are the parameters that you can alter from the default in order to tweak the health checks that the ELB will perform.
HealthCheckProtocol
The method that the load balancer should use in order to perform health checks. The options are HTTP and HTTPS – HTTP is the default.
HealthCheckPort
The port the load balancer uses when performing health checks on targets. The default is to use the port on which each target receives traffic from the load balancer. It is recommended to leave this parameter at its default setting.
HealthCheckPath
The destination for health checks on the targets. The format for this field depends on the protocol version that is available for the HealthCheckProtocol.
- If the protocol version is HTTP/1.1 or HTTP/2, specify a valid URI (/path?query). The default is /.
- If the protocol version is gRPC, specify the path of a custom health check method with the format /Package.Class/method. The default is /AWS.ALB/healthcheck.
HealthCheckTimeoutSeconds
The number of seconds that the load balancer should wait before classifying the health check as failed. This needs to be a whole number from 2 to 120. The default is five seconds if the target type is instance or ip and 30 seconds if the target type is lambda.
HealthCheckIntervalSeconds
The number of seconds that the load balancer should wait before issuing another health check query for each target. This needs to be a whole number from 5 to 300. The default is 30 seconds if the target type is instance or ip and 35 seconds if the target type is lambda.
HealthyThresholdCount
The number of consecutive successful health checks required before an unhealthy target has its status switched to healthy. This is a whole number from 2 to 10. The default value is 5.
UnhealthyThresholdCount
The number of consecutive health checks that fail before a target is marked as being unhealthy. This is a whole number from 2 to 10. The default is 2.
Matcher
The codes to use when checking for a successful response from a target. These are all whole numbers and they are called Success Codes in the console.
- If the protocol version is HTTP/1.1 or HTTP/2, the possible values are from 200 to 499. You can specify multiple values (for example, “200,202“) or a range of values (for example, “200-260“). The default value is 200.
- If the protocol version is gRPC, the possible values are from 0 to 99. You can specify multiple values (for example, “0,1“) or a range of values (for example, “0-7“). The default value is 12.
As the settings of the health checker are defined per target group, it is possible to have different rules operating on the same load balancer and also different rules for each load balancer instance. This could end up getting complicated. It is much simpler to have the same strategy for all load balancers.
The ability to define your own codes for success messages opens up the possibility of creating your own convention that indicates a different notification number to identify each target group. However, dereferencing those codes would require you to compile a reference table and examine it every time you read off the status codes, which could prove time-consuming.
Checking virtual instance statuses
The load balancer will perform one initial health check after you save the settings of a target group. After that point, the health check will repeat, according to the instructions laid out in the parameters to the target group.
It is possible to see the health of each instance through the EC2 console. Perform the following actions:
- Open the Amazon EC2 console.
- Look in the navigation pane for LOAD BALANCING and choose Target Groups.
- Choose the name of the target group and open its details page.
- On the Targets tab, read the Status column for the status of each target.
- If the status is any value other than Healthy, look at the Status details column for more information.
It is also possible to get health check information through the CloudWatch monitor.
ELB monitoring tools
As health checks occur all of the time and with rapid frequency, you can’t be expected to sit and watch the EC2 console in order to spot a problem with a virtual resource as soon as it arises. It is more efficient to get an automated monitoring tool that will raise an alert if the status of an instance changes.
ELB health check status is just one of the categories of metrics that you can get an ELB monitor to watch on your behalf, free up time to solve other problems, and work on tasks, such as system capacity planning. ELB monitors deploy an alerting system for all of the statuses that they monitor, thus, you can assume that everything is working well with your load balancers unless you receive a notification to the contrary.
Our methodology for selecting ELB monitoring tools
We reviewed the market for monitoring systems to look after AWS Elastic Load Balancers and assessed the options based on the following criteria:
- A cloud monitoring system that can track the activity on all of the AWS load balancing tools
- Tracking of protected server load
- Tracking of protected network activity
- Periodic load balancer availability tests
- The ability to extract platform reporting data
- A free trial or a demo that creates an assessment opportunity before buying
- Value for money from an ELB monitor that is also able to monitor servers and cloud platforms plus other applications
You can read more about these ELB monitoring tools in the following sections.
1. Paessler PRTG (FREE TRIAL)
Paessler PRTG is a collection of monitoring tools that cover networks, servers, and applications through one interface. The monitors of this service are able to supervise both on-premises and off-site systems, including AWS resources.
Key Features:
- Flexible package
- Connects to AWS CloudWatch
- Health checks
- Alerts for performance problems
Why do we recommend it?
Paessler PRTG is a flexible package of many monitoring tools and it includes a series of AWS CloudWatch sensors. Each of these sensors will extract data from CloudWatch about a specific AWS tool, such as ELB. You can activate other sensors to get data on your other AWS services as well.
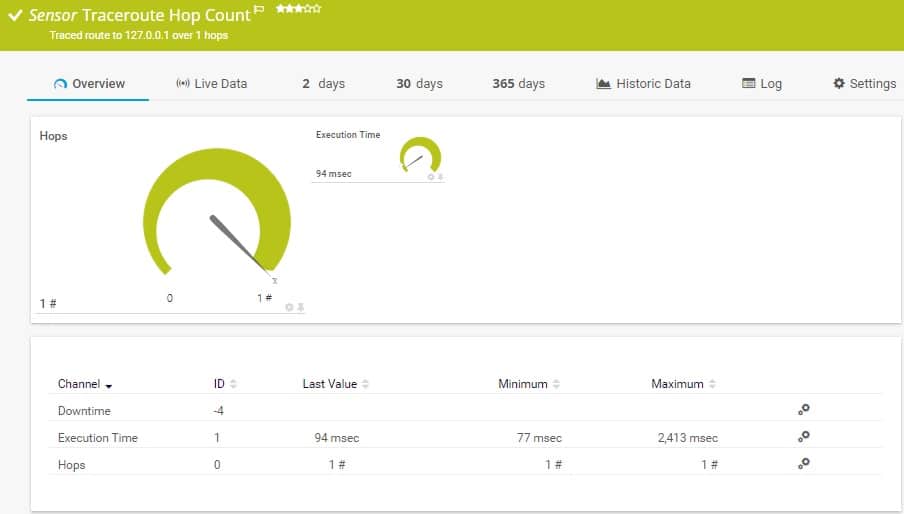
You can set up a specialized AWS monitoring service through the Amazon CloudWatch ELB sensor. This includes reports on the results of the ELB health checks. You can specify alert conditions for any of the statuses that PRTG monitors and these can be forwarded to team members by SMS or email.
Who is it recommended for?
PRTG is suitable for all sizes of businesses because the package is customizable and you pay for an allowance of sensors. You decide which sensors to turn on, so you don’t end up paying for features that you don’t really need. The tool is free to use for only 100 sensors.
Pros:
- Autodiscovery reflects the latest AWS ELB changes in real-time
- Drag and drop editor makes it easy to build custom views and reports
- Offers a range of templated sensors for AWS and other similar products
- Supports a powerful freeware version – great for small businesses
Cons:
- Is a very comprehensive platform with many features and moving parts that require time to learn
Paessler PRTG is delivered as on-premises software that installs on Windows Server. The price you pay for the system depends on how many of the sensors within the package that you intend to activate. You can get a 30-day free trial of PRTG with all sensors activated.
EDITOR'S CHOICE
Paessler PRTG is our top pick for an ELB health check tool because it offers comprehensive monitoring capabilities, ensuring the performance and reliability of Elastic Load Balancers (ELB). Paessler PRTG’s versatile monitoring system tracks ELB status, checks response times, and provides real-time insights into load-balancing health, making it ideal for both AWS and on-premises infrastructures. An important element of the Paessler PRTG package is its intuitive and user-friendly interface, allowing network administrators to set up and configure monitoring tasks easily. The platform supports the automatic discovery of devices, including ELBs, which minimizes setup time and simplifies the monitoring process. PRTG’s customizable sensors allow for granular tracking of ELB performance metrics, including request counts, latency, and error rates, ensuring that network administrators have complete visibility into their load-balancing infrastructure. Paessler PRTG provides a powerful alerting system. Real-time notifications can be set up on any performance issue or anomaly. It will alert to high latency or server downtimes, ensuring that issues can be addressed immediately, preventing disruptions to services and end-user experience.
Download: Get a 30-day FREE Trial
Official Site: https://www.paessler.com/download/prtg-download?download=1
OS: Windows Server or SaaS
2. Datadog
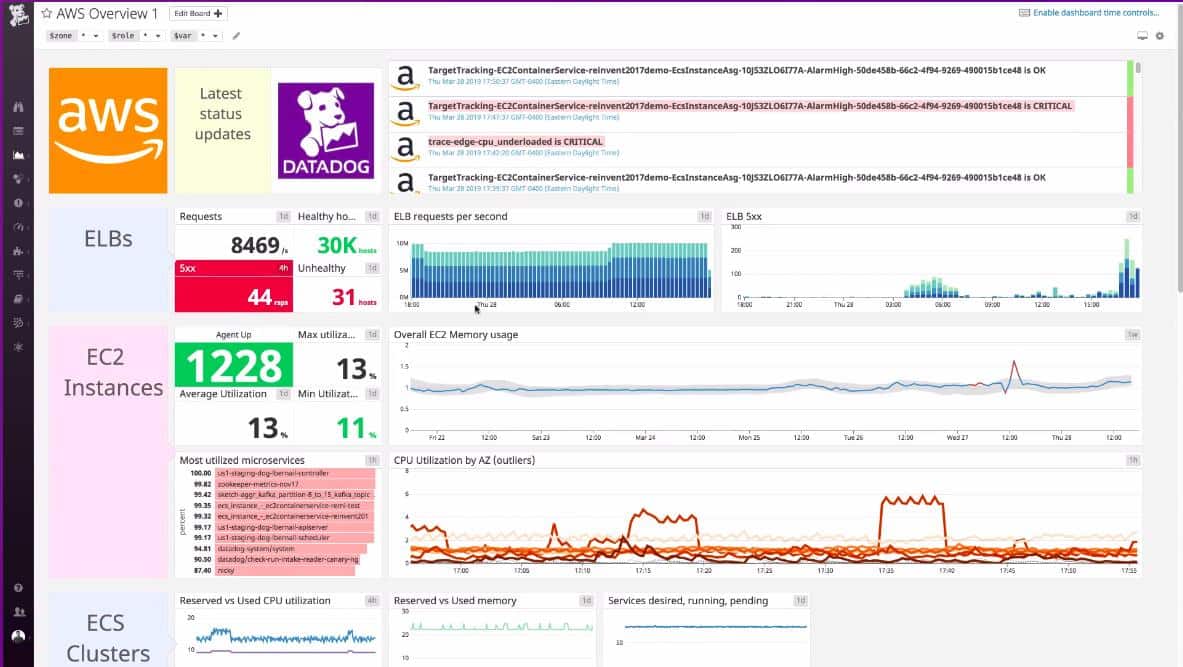
Datadog is a cloud-based monitoring system that is offered in packages that specialize in different aspects of IT systems, such as networks, servers, and applications. It can monitor on-premises systems and also cloud-based services. It has the ability to include the monitoring of AWS load balancer health checks through an AWS extension. Extensions are packages of extra monitors and screens that cater to a specific provider’s products. The AWS integration includes ELB monitoring and will show the latest ELB health check information.
Key Features:
- Summary page for AWS services
- ELB health checks
- Alerts for status issues
Why do we recommend it?
Datadog is a cloud platform with many monitoring modules to choose from. You get ELB monitoring in the Infrastructure Monitoring package. This module can be expanded by integrations, which are free. There is an integration for ELB monitoring and other AWS tools. Monitor many services simultaneously with this package.
Each metric displayed live in the dashboard can have a performance threshold set on it. Many of these thresholds are already set by default. These can be adjusted by the user. An example of an alert is the ability to ask the system to notify you if a virtual server or appliance provided by AWS fails an ELB health check. You can specify that alerts get forwarded to team members through email, SMS, or chat/collaboration system. This enables you to carry on with other tasks, knowing that you will be brought back to the system if things go wrong.
Datadog is able to monitor a range of AWS systems, not just load balancer health checks. The alerting mechanism in the Datadog system enables you to confidently let the monitor take care of all of your system supervision automatically.
Who is it recommended for?
Datadog is suitable for monitoring hybrid systems. It is based in the cloud and can monitor the performance of cloud platforms, SaaS systems, and on-premises resources. There is a Free edition available for small businesses that covers five hosts and this will monitor AWS ELB.
Pros:
- Easy-to-use customizable dashboards
- Offers dashboards, reports, and monitors specifically for AWS ELB and other AWS services
- Supports auto-discovery that builds network topology maps on the fly
- Changes made to the network are reflected in near real-time
- Allows businesses to scale their monitoring efforts reliably through flexible pricing options
Cons:
- Would like to see a longer trial period for testing
The AWS integration of Datadog can be added to the Datadog Infrastructure package or the Datadog APM. You can get a 14-day free trial of either of these two monitoring systems.
3. Dynatrace
Dynatrace is a cloud-based application monitor that has special routines for monitoring AWS systems. It includes ELB monitoring and encompasses live statuses drawn from the load balancer health checks.
Key Features:
- Application monitoring
- Gets data from AWS CloudWatch
- Server activity monitoring
Why do we recommend it?
Dynatrace provides application discovery and an infrastructure mapping system. The service is hosted in the cloud and is particularly strong at tracking other cloud systems. The top plan of Dyntrace will create an application dependency map and include the discovery of microservices. ELB monitoring is covered by the Infrastructure Monitoring plan.
The Dynatrace system interfaces with Amazon CloudWatch, so any data that you can see in that monitoring system will appear in your Dynatrace interface. You might wonder why you should bother to get Dynatrace rather than just using AWS CloudWatch. Well, one reason is that Dynatrace is able to monitor all of your applications anywhere – not just those provided by AWS. Centralizing all of your applications monitoring in one dashboard saves you time switching between consoles,
The alerting system that is built into Dynatrace will alert you if things go wrong. You can also create custom alerts in Dynatrace and build up scenarios that bundle warnings together to produce single alerts out of combined status problems.
Who is it recommended for?
Dynatrace is a good choice for businesses that want to monitor cloud systems and don’t have much of a home network to look after. The ELB system can be monitored by the Infrastructure Monitoring plan. If you don’t have any Web applications to monitor, Infrastructure Monitoring will give you everything that you need.
Pros:
- Highly visual and customizable dashboards, excellent for enterprise NOCs
- Operates in the cloud, allowing it to be platform-independent
- Leverages AI to provide baseline analysis and assist technicians in troubleshooting
Cons:
- Designed specifically for large networks, smaller organizations may find the product overwhelming
Dynatrace is available for a 15-day free trial.
4. ManageEngine Applications Manager
The ManageEngine Applications Manager covers on-premises and remote resources, including services provided by AWS. The AWS monitoring features of the Applications Monitor are provided by a special extension, which is free and adds extra screens and probes to the package to keep track of AWS resources.
Key Features:
- Load balancer availability tests
- Application dependency mapping
- Performance alerts
Why do we recommend it?
ManageEngine Applications Manager is a similar package to the SolarWinds AServer and Application Monitor. This system provides ELB monitoring as an extension, which is a free add-on. The monitoring service includes a discovery system that generates an application dependency map. This map provides predictive alerts for resource shortages.
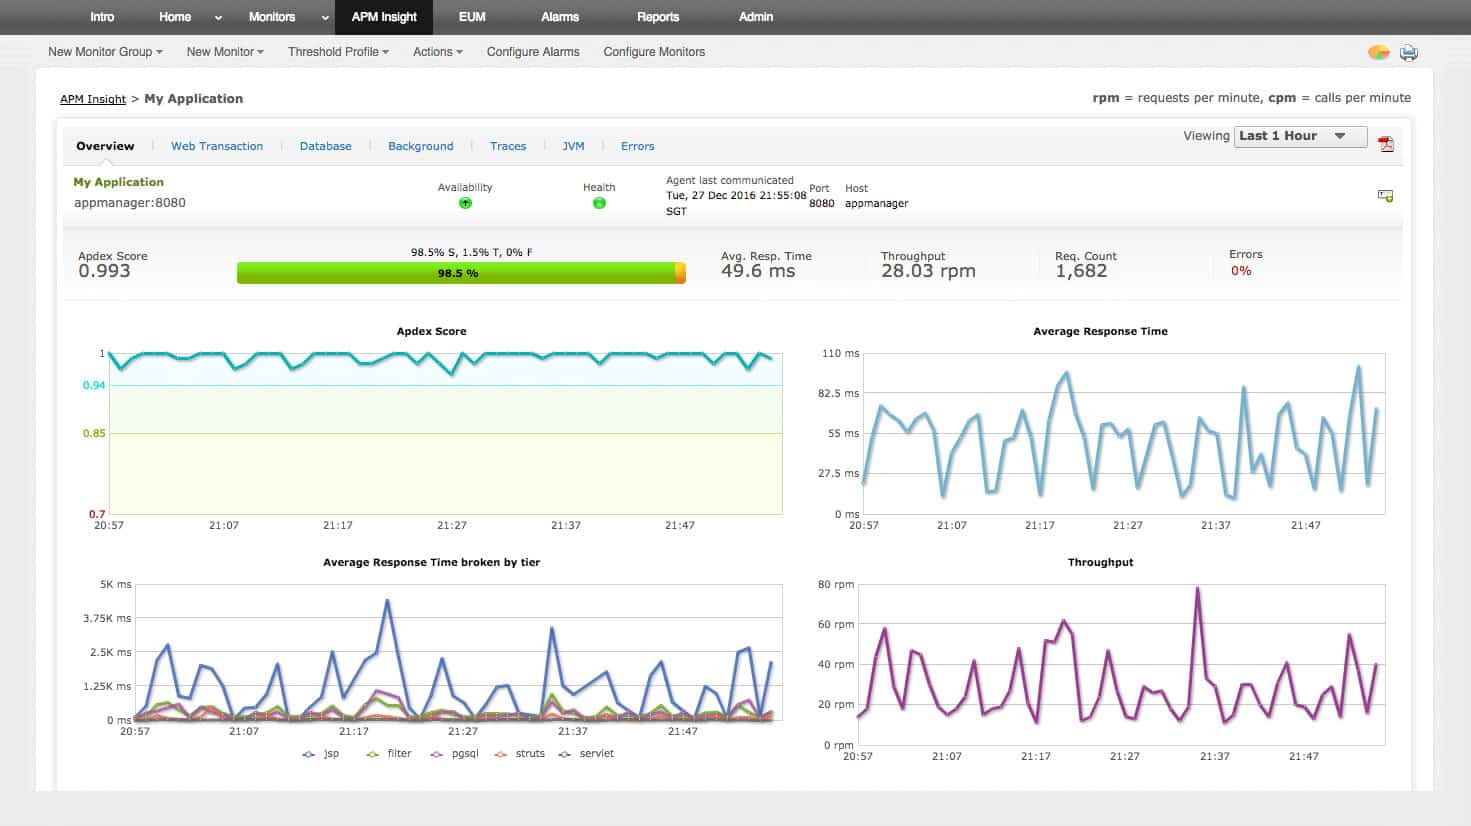
The AWS monitoring services of the Applications Manager include a section for supervising ELB performance and that will show you the like status results of ongoing load balancer health checks. The AWS monitoring services, like the other application monitoring screens in the Applications Manager, include an alerting mechanism. If the performance of your applications deteriorates, the Applications Manager will raise an alert and send notifications to the accounts that you nominate by email or SMS.
Who is it recommended for?
This system is a software package for installation on Windows Server or Linux. It is also available as a service on AWS Marketplace and Azure Marketplace. You can monitor ELB with this system no matter where you host the monitoring software. A free edition will monitor five assets.
Pros:
- Offers on-premise and cloud deployment options, giving companies more choices for install
- Can highlight inter-dependencies between applications to map out how performance issues can impact businesses operations
- Offers log monitoring to track metrics like memory usage, disk IO, and cache status, providing a holistic view into your database health
- Offers quick ELB health checks via a simple extension
Cons:
- Can take time to fully explore all features and options available
ManageEngine Applications Manager is implemented as on-premises software that is available for Windows Server and Linux. You can access a 30-day free trial of the system.
5. SolarWinds Server & Application Monitor
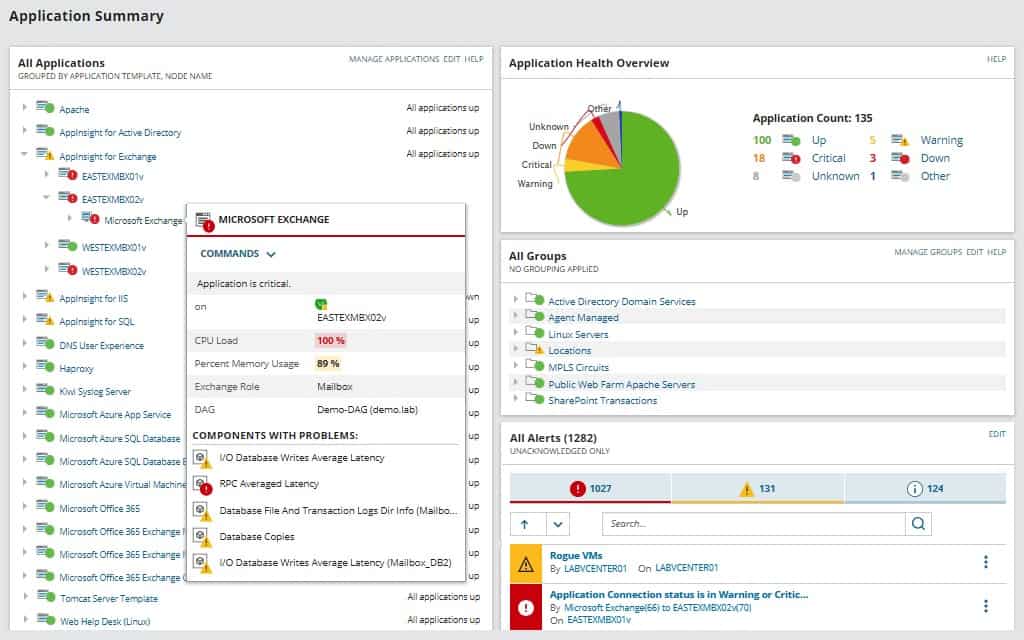
The SolarWinds Server & Application Monitor (SAM) is a downloadable software package that installs on Windows Server. It is able to monitor servers and applications on-premises and off-site and that includes virtual servers and appliances, such as those provided by AWS.
Key Features:
- Extension for AWS ELB
- Covers many applications
- Hybrid system monitoring
- Application dependency mapping
- Server and application performance correlation
Why do we recommend it?
SolarWinds Server & Application Monitor is ideal for monitoring ELB because it will extract statistics from the AWS platform and give you external factors, such as processor activity as well as data on the ELB service. The tool will scan through your AWS account and identify all of the services that you have on it.
The great feature of SAM is that it is able to keep track of both physical and virtual servers and group together their performance metrics giving you an overview of all of the resources that you need to monitor on one screen, no matter where they are located. The dashboard offers drill-down paths to get you detailed information on each server or instance and then look at the services and applications that you have subscribed to or installed.
The information contained in the screens, such as ELB health check statuses can all trigger alerts if performance thresholds are crossed. These can be forwarded as notifications by SMS or email.
Who is it recommended for?
This is a good tool for businesses that have many services on the AWS platform plus systems on other platforms, including on-site servers. The package has a lot of capacity for monitoring multiple servers, cloud platforms, and services simultaneously. Large businesses would get the most value from this package.
Pros:
- Designed with large and enterprise networks in mind
- Offers numerous plug-and-play features specifically for AWS ELB
- Uses drag and drop widgets to customize the look and feel of the dashboard
- Robust reporting system with pre-configured compliance templates
Cons:
- Designed for IT professionals – the platform takes time to fully explore all features
You can get a 30-day free trial of SolarWinds Server & Application Monitor.
ELB FAQs
What will ELB do if one of the instances fails a health check?
If an instance fails a health check, ELB marks it for attention and will not route traffic to it. The ELB keeps checking that instance, waiting for it to be restarted or replaced, then it will begin including the instance in load balancing again.
How do you write health check instance for ELB?
Getting an EC2 instance included in an ELB health check is very easy. You need to allocate the instance to a target group and then set up health check rules for the group. There are default rules and they are applied to each group by default. So, once you add an instance to a group, it will be included in the ELB health check automatically.
How often does ELB do a health check?
The default setting for ELB instructs it to perform a health check every 30 seconds. You can change that to any period between 5 seconds and 5 minutes.

