Docker introduces a revolutionary approach to application virtualization, enhancing the efficiency and simplicity of software delivery. Instead of traditional installation methods, Docker encapsulates the application into a compact, portable “image”. This image is then transferred over the network to the user’s endpoint, streamlining deployment and reducing complexity.
This method is particularly advantageous for delivering software to mobile devices owned by users. Unlike conventional software installation, Docker eliminates the need for direct installation on the device. Moreover, it avoids monopolizing the entire device for corporate use, allowing users to maintain their personal settings and applications alongside work-related functionalities.
At the core of Docker’s methodology is the concept of “containerization“. A container serves as the fundamental unit of operation, encapsulating the application along with its dependencies, libraries, and runtime environment. This self-contained structure ensures consistent behavior across diverse environments, whether on a local machine, in a data center, or within a cloud infrastructure.
Containerization also addresses challenges such as compatibility and dependency conflicts. By isolating applications from the host system and other applications, containers provide a secure and reliable runtime environment. This approach significantly reduces overhead compared to traditional virtual machines, as containers share the host system’s operating system kernel rather than requiring dedicated instances.
Docker’s system is widely embraced for its agility in software development and deployment, particularly in DevOps workflows. It enables rapid, iterative development, simplifies testing, and accelerates deployment cycles.
As businesses increasingly adopt hybrid and remote work environments, Docker’s ability to deliver software efficiently and securely to user endpoints ensures its continued relevance and utility. By leveraging containerization, Docker redefines how applications are packaged, delivered, and managed in modern IT environments.
We get into a lot of detail below on each of the Docker network tools we feature, but if you’re short of time, here is our list of the best Docker network monitoring tools:
- Datadog Docker Monitoring EDITOR’S CHOICE Online network monitoring platform, which can be enhanced by a plug-in to monitor Docker activity.
- Paessler Docker Monitoring with PRTG (FREE TRIAL) A three-in-one network, server, and application monitoring package that includes special modules for Docker tracking.
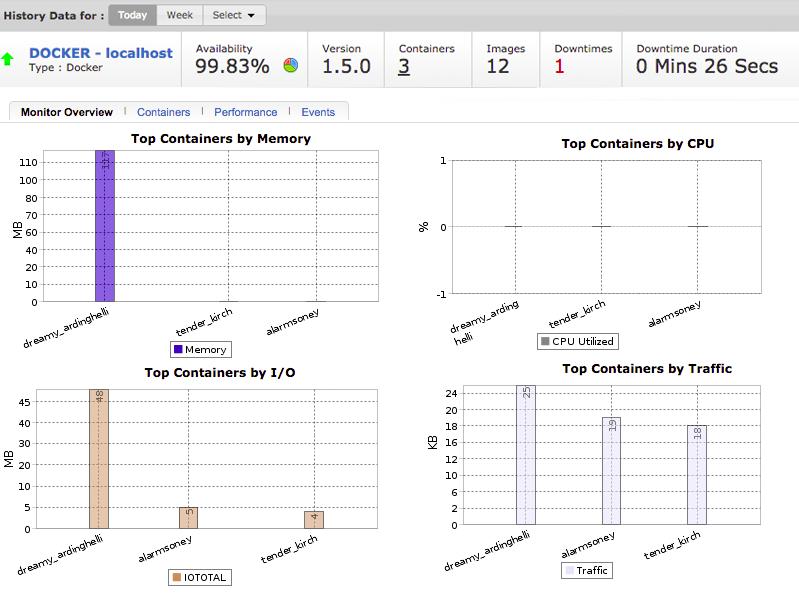
- Site24x7 (FREE TRIAL) This cloud-hosted platform provides Docker monitoring that offers real-time insights into container performance, including CPU, memory, and network metrics.
- SolarWinds Docker Monitoring with AppOptics This package runs in the cloud and can track all network elements and applications on-site and in the cloud.
- Portainer Especially designed to add management functions to Docker, this tool is free to use and runs on any operating system.
- cAdvisor Free tool provided by Google to monitor Docker activity. It is browser-based, and so operating system-neutral.
The container-based solution of Docker has many advantages over standard virtualization. The container supports a neutral operating system, which is provided by Docker. This means that the delivery of software to remote devices is operating system-neutral.
Docker is an open-source project, which means that it is free to use. Other software producers are able to integrate Docker capabilities at no cost. For example, Docker capabilities have been integrated into Windows Server since Windows Server 2016.
Implementing Docker is relatively simple. However, the types of applications that you want to deliver with the system will greatly influence the architecture that you employ for containerization. In this guide, you will learn about your options and how to exploit the Docker system to connect your end-user devices to application servers.
Installing Docker
The software for Docker is available for free on the GitHub website. This is called the Community Edition because the people who created Docker also run a business for a paid version of the system. Docker software installs on Linux, Mac OS, and Windows. Docker Inc also offers a Software-as-a-Service (SaaS) version of the system, which you can access online.
The base application is called Docker Engine and you can download it for CentOS, Fedora, Ubuntu, and Debian Linux, and it is also available in versions for Mac OS and Windows. You can also get Docker Engine to run on the AWS and Azure Cloud platforms.
Docker implementation has two parts. These are a daemon that runs on the software server called dockerd and a client program called Docker.
You need to have Microsoft Hyper-V in order to run Docker on Windows. If you have Windows 10, Windows Server 2016, or Windows Server 2019, you already have Windows Containers on your computer. This includes a Hyper-V Isolation option, which is required for Docker.
The installation process for Docker on Windows will turn on the Hyper-V utilities resident in the operating system.
If you want to install Docker for Mac for free, your computer must have been manufactured in 2010 or later and needs to be running macOS El Capitan 10.11 or higher.
If you have Windows 7, Windows 8, or an older Mac, you need to install Docker Toolbox instead of Docker for Windows or Docker for Mac. This download will install the required Hyper-V elements for you.
Docker options
Docker was written for Linux. So, the standard operating system built into a Docker container is based on Linux. If you run Docker on Windows, you have the choice of building containers with Linux inside or Windows. When you choose one or the other operating systems, you can still switch to the other operating system and leave existing containers running.
You can only issue management commands for containers created with the operating system that you currently have active. It IS possible to have both Windows and Linux containers running simultaneously. However, you will have to keep switching from one system to the other in order to monitor each type.
Related post: Docker vs Virtual Machines
Running Docker
Docker doesn’t have a GUI interface. It is a command-line system. So, if you are in a GUI environment, such as Ubuntu, Mac, or Windows Desktop, you will have to open a terminal session in order to access the system. You can operate Docker commands on a remote computer through an SSH session.
The format for running Docker is:
Docker [OPTIONS] COMMANDYou can get a list of the options and commands for Docker by just typing in Docker.
Docker includes a help system, and you can access it by typing:
Docker --help Docker network details
Docker uses five network drivers. These are bridge, host, overlay, macvlan, and none. The meanings of the five driver types are:
Bridge network
Bridge is the default network driver. Use this network type to enable applications in standalone containers to communicate. The containers would be limited to communicating through the same host.
Host network
Host networks operate on the Docker host’s network. This scenario is possible if the client is able to connect to the same LAN as the host. This network type is suitable for swarm services. A swarm connection involves several Docker daemons communicating with each other.
Overlay network
The overlay network caters to swarm services. This configuration connects together several Docker daemons to enable the exchange of containers. The overlay can also facilitate standalone container communication. The main difference between overlay and bridge is that the daemon on each side of the connection is active.
Macvlan network
The Macvlan network gets its name from the MSAC address, not the Apple computer. With this type of network, you can give containers MAC addresses so that they appear on your network as though they were physical devices. Communication across the internet is still conducted by IP address. However, once the containers arrive on the local network, the Docker daemon routes them through switches. This option is suitable for applications that don’t allow you to route through the Docker server. The originator of the container is a network endpoint.
None
The none driver disables Docker networking functions but requires a specialized substitute network interface to route containers.
Docker network implementation
When you install the Docker system it will automatically create a bridge, a host, and a none network. As soon as you start up Docker, you can query the system to see those three new networks. Use the command docker network ls:
The network option of Docker includes the following options:
- Connect – Connect a container to a network
- create – Create a network
- inspect – Display detailed information on one or more networks
- ls – List networks
- prune – Remove all unused networks
- rm – Remove one or more networks
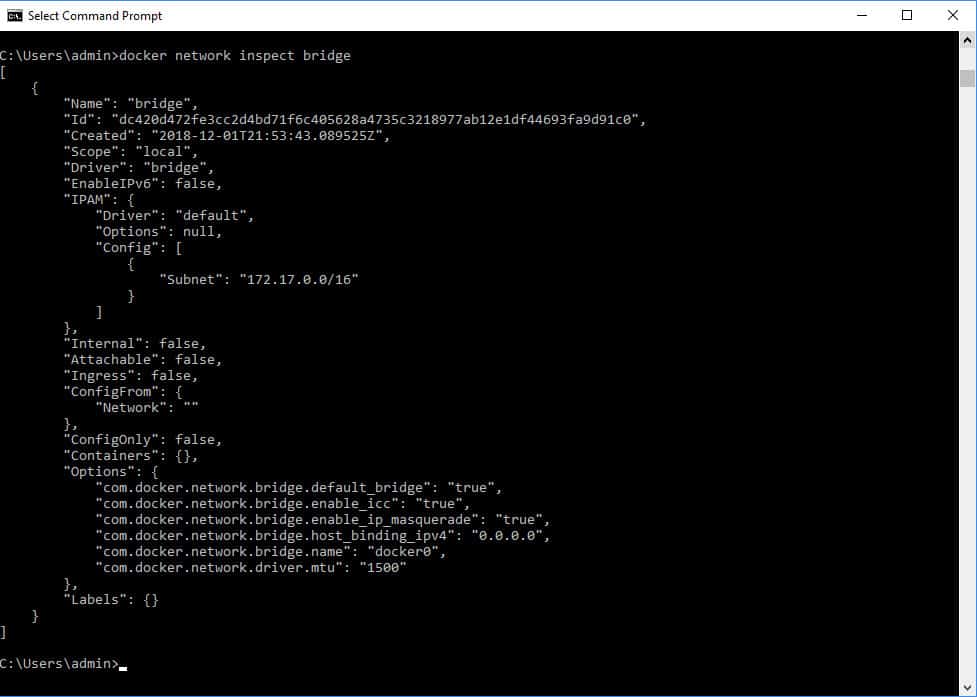
The output of the inspect option is formatted like a ‘C’ program and is difficult to read. Rather than using the ID of the network, you ask for details of the driver type. So, in order to see information about the bridge network, you would enter docker inspect bridge.
The output from this command is not very well presented and is not easy to understand. You can get better manageability for Docker if you use a third-party front end for the system.
How to create a Docker network
The Docker network create command will set up a new network. This command has a number of options:
| --attachable | Enable manual container attachment |
| --aux-address map | Auxiliary IPv4 or IPv6 addresses used by Network driver (default map[]) |
| --config-from string | The network from which copying the configuration |
| --config-only | Create a configuration only network |
| -d | Driver to manage the Network (default "bridge") |
| --driver string | As above |
| --gateway strings | IPv4 or IPv6 Gateway for the master subnet |
| --ingress | Create swarm routing-mesh network |
| --internal | Restrict external access to the network |
| --ip-range strings | Allocate container ip from a sub-range |
| --ipam-driver string | IP Address Management Driver (default "default") |
| --ipam-opt map | Set IPAM driver specific options (default map[]) |
| --ipv6 | Enable IPv6 networking |
| --label list | Set metadata on a network |
| -o | Set driver specific options (default map[]) |
| --opt map | As above |
| --scope string | Control the network's scope |
| --subnet strings | Subnet in CIDR format that represents a network segment |
The most common type of network that you will create uses the bridge driver.
Create a bridge network
As you can see from the options for the create command, it is relatively straightforward to set up a bridge:
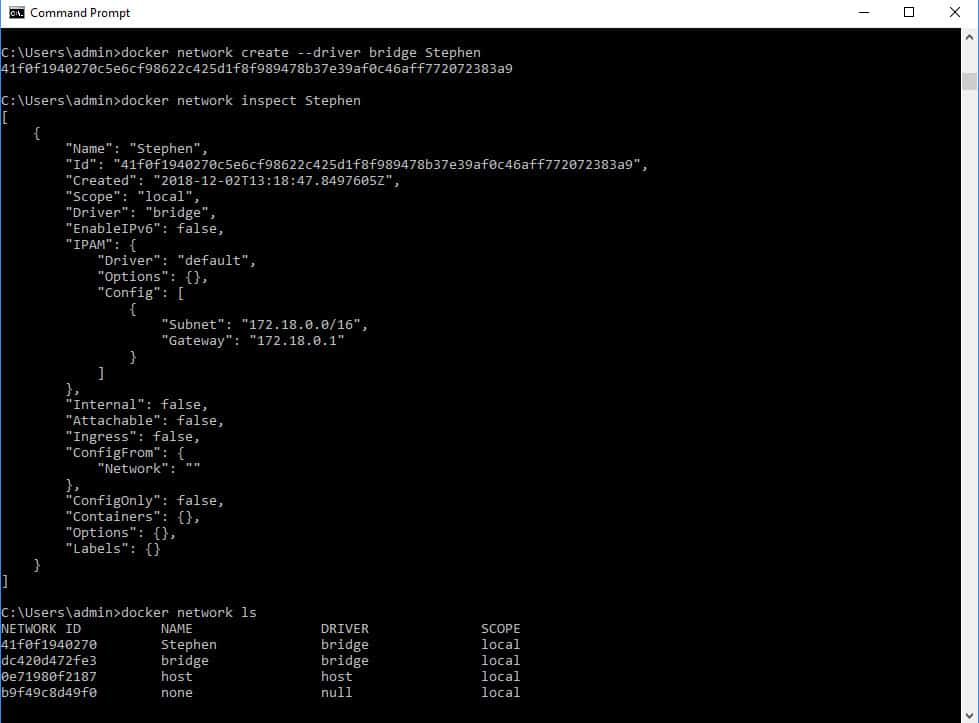
docker network create --driver bridge StephenThe last string in the command is the name of the network. I named my network after myself. You could choose your own business-related name. After creating the network, you will see a string of characters shown on the screen. This is the new network’s ID. However, you don’t need to remember that ID because you can refer to the network by its name, as shown in the inspect command output below.
The list of current networks shows that the new network did not replace the original default bridge network.
Unfortunately, it isn’t possible to change the attributes of a network once it has been created. If you want to update features, you will have to delete the network and then remake it with the desired attributes.
Use the rm option on the network command to delete a network:
docker network rm StephenDon’t forget to include the network name in the remove command. Check the list of networks to confirm that the network has been deleted.
Once a network no longer exists, you can create it again with new attributes.
Create an overlay network
The overlay network is more complicated to set up than the other network types. In this scenario, you need to get the Docker daemon on your computer communicating with Docker daemons on other computers – one or more other computers.
The connection between daemons is called a swarm. These are created and managed by the docker swarm command. The swarm commands are:
- ca – Display and rotate the root CA
- init – Initialize a swarm
- join – Join a swarm as a node and/or manager
- join-token – Manage join tokens
- leave – Leave the swarm
- unlock – Unlock swarm
- unlock-key – Manage the unlock key
- update – Update the swarm
One of the computers in the group needs to be designated as a swarm manager. The command to create this status is slightly different on Docker for Windows and Docker for Mac as it is for the Linux and Docker Toolbox implementations.
On Docker for Windows and Docker for Mac, enter this command:
docker swarm initOn all other Docker types you need to get the host computer’s IP address and add this to the command:
docker swarm init --advertise-addr That sets up a swarm. Read the feedback message that comes back from the successful execution of the command. This gives you the swarm ID and the IP address of the manager.
You can then add other nodes to the swarm, which can either be managers or a worker. You don’t need to issue any more swarm commands on the computer that you ran the init command on.
To join the swarm on the computer where you ran the init command, just enter:
docker swarm join --token The token needed to add another manager to this swarm is different than the token given for workers. To get the manager token, run the following command on the computer that you ran the init command on:
docker swarm join-token managerIf you lose the worker token, you can get it revealed to you again with the command:
docker swarm join-token workerYou can see details of the swarm and its manager by issuing the command:
docker node lsCreating the swarm adds two new networks to your host. These are called docker_gwbridge, which is a bridge network and ingress, which is an overlay network. To create your own overlay network, issue the network create command, giving it a name for the new network:
docker network create --driver overlay StephenThe results of this command can be seen below:
Note that the scope of the new overlay network and the ingress network is swarm.
Create a macvlan network
The procedure for creating a macvlan network is the same as that for a bridge network. You just need to specify overlay as the driver:
docker network create --driver macvlan StephenCreate a host or a null network
Both the host and null networks get set up when you start Docker. These two networks cannot be removed. You can only have one instance of each of these network types. Therefore, it isn’t possible to create your own host or null networks.
Attach a container to a network
Now you have your network set up, you can use it to carry containers.
Once you have created an image for your application, you can put that in a container and send it on a chosen network. In the following command, appim is the image that you want to send and docker-appim is the name that you are giving to the container that this command will create. In the example below, Stephen is the name of the pre-existing network.
docker run --network=Stephen -itd --name=docker-appim appimManaging a Docker network
There are a lot of Docker commands, all of which need to be issued at the command line. The lack of ongoing reporting is a big weakness of Docker. In order to monitor the performance and throughput of a Docker network, you have to constantly issue commands to provoke feedback.
The best monitoring utility you get with Docker is the docker stats command. This shows a live list of Docker container activity. Unfortunately, this utility ties up the terminal. You have to press Control-C to get out of the tool.
As a systems administrator, you will probably feel uncomfortable about the lack of visibility that Docker gives you.
Tools to manage Docker
You don’t want to have to go back to the days when the only way you knew that something was going wrong with the network was when users rang up to complain. Fortunately, there are third-party tools that will monitor activity on your Docker networks and keep an eye on system health so you can head off failure. There are many tools available on the market for network monitoring, but not all of them cover Docker networks effectively. This guide includes recommendations on the software that you could install in order to monitor Docker activity.
Our methodology for selecting Docker network monitoring and management tools
We reviewed the market for Docker monitoring and management systems and analyzed the options based on the following criteria:
- A system that can follow Docker container instance creation
- A method to track Docker memory management
- A system that can note Docker activity and intersections with other packages and users
- Monitoring of Docker container resource usage
- A method to identify the activities of the different components within the container
- A free trial or a demo package for a no-cost assessment opportunity
- Value for money from a monitoring tool that can also monitor servers and networks to provide systemwide supervision
You can read more about each of these options in the following sections.
1. Datadog Docker Monitoring (FREE TRIAL)
Datadog is delivered through a Software-as-a-Service format. This is a general network and server monitoring tool that can be enhanced by adding on an agent for Docker, which is available for free from the Docker Hub.
Key Features:
- Container discovery
- Simultaneously monitors all containers
- Scans every 15 seconds
- Stores metrics for analysis
Why do we recommend it?
Datadog Docker Monitoring is part of the Infrastructure Monitoring module on the Datadog cloud platform. This package also monitors servers, cloud platforms, virtualizations, and other services, such as databases. The system can be expanded by integrations, which plug directly into applications, such as Docker, to extract activity metrics.
Datadog is primarily an application performance monitor. It also examines log files to identify system problems that could impact software delivery. The tool is able to monitor the performance of Cloud-based services as well as on-premises servers and applications.
The dashboard includes a group chat function that enables a team to communicate and share tasks to resolve performance issues. Team members can share snapshot views of dashboard performance graphs and schedule tasks.
Datadog also includes analysis functions that work on stored data. This source data usually comes from system logs, but you can also save your own data selections for historical analysis.
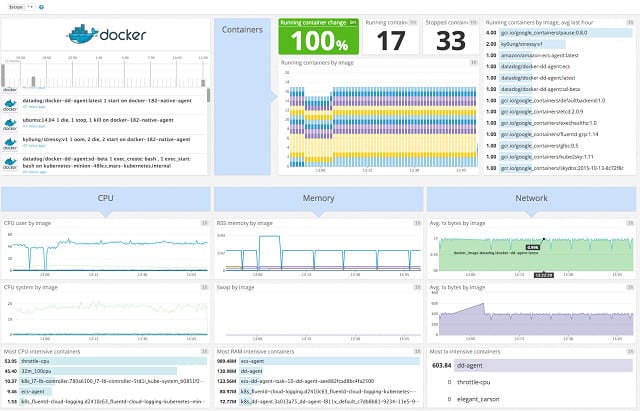
The Docker monitor in the Datadog system tracks container traffic events and shows a live event message board on the dashboard. The tool also presents live data on transfer events, application performance, and server load. The dashboard screen for Docker monitoring includes some great graphical representations to make performance data easy to interpret.
Who is it recommended for?
The Infrastructure Monitoring package has four plan levels and the first of three is free. This is a good option for small businesses because it is limited to monitoring five hosts and provides data retention for one day. The paid plans are priced per host and so are suitable for businesses of all sizes.
Pros:
- Easy-to-use customizable dashboards
- Cloud-based SaaS product allows monitoring with no server deployments or onboarding costs
- Can monitor both internally and externally giving network admins a holistic view of network performance and accessibility
- Supports auto-discovery that builds network topology maps on the fly
- Offers flexible docker environment monitoring through plug-and-play add-ons
- Great pricing options, accessible for both small and large businesses
Cons:
- Would like to see a longer 30-day trial
This is a paid tool, but you can get a 14-day free trial to put it through its paces.
EDITOR'S CHOICE
Datadog Docker Monitoring is our top pick for a Docker management system because it offers seamless integration, providing real-time visibility and in-depth performance insights across Docker containers. Its user-friendly interface and powerful analytics make managing containerized environments easier and more efficient, ensuring better performance and quicker issue resolution. An important feature of Datadog is its ability to monitor containerized applications at scale. The system automatically discovers and tracks all containers, providing detailed metrics on container performance, resource usage, and health status. Datadog also integrates with various orchestration platforms, including Kubernetes and Docker Swarm, making it versatile for different environments. Datadog’s extensive visualization and reporting capabilities allow users to create customizable dashboards for an intuitive overview of their Docker infrastructure, helping them easily spot potential performance issues, bottlenecks, or anomalies. The tool provides container-specific metrics such as CPU and memory usage, disk I/O, and network activity, enabling precise performance tuning. This service’s competent alerting system ensures that any performance deviation, container failure, or threshold breach triggers immediate notifications, helping administrators take prompt action. Its integration with other Datadog solutions like APM and logs provides an all-encompassing solution for monitoring Docker containers and applications.
Download: Get a 14-day FREE Trial
Official Site: https://www.datadoghq.com/free-datadog-trial/
OS: Cloud based
2. Paessler Docker Monitoring with PRTG (FREE TRIAL)
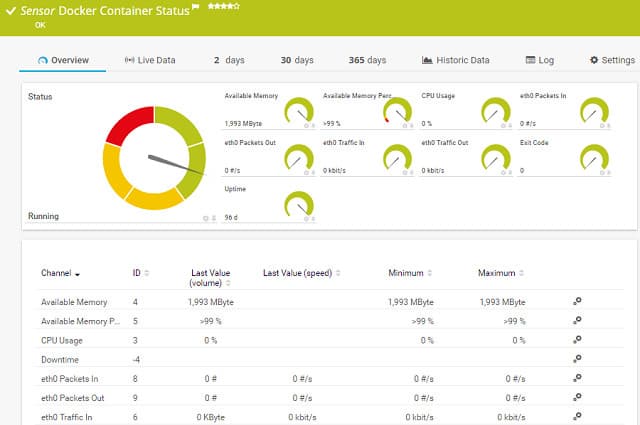
Paessler PRTG is a unified infrastructure monitoring system. It covers networks, servers, and applications. It will also monitor your Docker container traffic. PRTG is composed of services that are called sensors. A sensor monitors one type of activity, such as CPU usage on a server, or data throughput on a network. The package includes sensors that are specifically aimed at monitoring containers.
Key Features:
- Watches Docker network activity
- Track creation and destruction
- Root cause analysis
Why do we recommend it?
Paessler PRTG is a bundle of monitoring tools and that set includes sensors for Docker monitoring. The Docker monitoring screens provide an overview of all Docker activity with totals for specific activity metrics. You can then drill down to see data for a particular container. This package provides constant Docker tracking.
The Docker Container Status Sensor will add visibility to your Docker network activity. The live monitoring data given by this sensor can be added to the other network traffic sensors in PRTG to give you a full network status report. Containers might be experiencing delivery problems that are caused by overloading on the network, or under-performing, or damaged network equipment. PRTG lets you see exactly what part of your system is causing problems.
Who is it recommended for?
This package is available for installation on Windows Server and it is also offered as a SaaS package. The Docker monitor will raise an alert if performance problems arise. So, you don’t have to sit and watch the screen because you will receive a notification by email or SMS if you are needed.
Pros:
- Uses flexible sensors to monitor different aspects of your webpage and webserver resources
- You can use up to 100 sensors free
- Great option for businesses looking to monitor docker as well as other environments and infrastructure
- Pricing is based per sensor and allows both large and small businesses to scale within the PRTG ecosystem
Cons:
- Feature-rich, and takes time to learn all of the features and functionality the platform offers
Paessler charges for its service in bands of sensor quantities. Every customer receives the full package of PRTG and tailors the pack by only activating specific sensors. If you only activate up to 100 sensors, you can use the system permanently for free. So, if you only take on PRTG for its container sensor, you won’t have to pay anything. You can download a 30-day free trial of PRTG with unlimited sensors. The software installs on Windows Server.
See also: Docker Container Monitoring Tools
3. Site24x7 (FREE TRIAL)
Site24x7 is a system monitoring and management package that is delivered from the cloud. The package includes a Docker monitoring unit. This tool offers real-time visibility into container performance, ensuring that applications running in Docker environments perform optimally.
Key Features:
- Application monitoring
- Infrastructure monitoring
- Tracks the performance of Kubernetes and OpenShift as well as Docker
- Resource availability and usage tracking
Why do we recommend it?
By monitoring key metrics such as CPU usage, memory consumption, disk I/O, and network traffic, Site24x7 provides in-depth insights into how Docker containers are utilizing system resources. These insights help administrators identify resource bottlenecks or inefficient configurations, enabling them to optimize the performance of their Docker containers. With Site24x7, users can easily track the health of individual containers, as well as the overall status of the Docker host.
The platform offers comprehensive container-centered monitoring, providing metrics at both the container and host levels. Site24x7’s well-planned dashboard display real-time data, allowing users to quickly assess the health of containers and hosts. This visual representation makes it easy to track resource utilization trends over time, helping to detect performance degradation early.
Site24x7 integrates directly with Docker APIs, automatically discovering containers and pulling performance metrics from each containerized application. That simplifies the monitoring setup process for Docker users.
With Site24x7, Docker users can also benefit from alerting features that notify administrators when predefined thresholds are exceeded. Alerts can be set up for resource usage spikes, container restarts, or other important events, helping teams take swift action to prevent downtime or performance issues. This proactive monitoring capability ensures that organizations can maintain high availability and performance for their Dockerized applications, even under changing workloads.
Beyond its core monitoring features, Site24x7 offers integrations with other tools in the DevOps toolchain, making it an ideal solution for teams managing microservices and containerized applications.
This service supports multi-cloud and hybrid environments, allowing users to monitor Docker containers running across multiple platforms like AWS, Azure, and on-premises infrastructures.
Who is it recommended for?
This monitoring package will appeal to for organizations running microservices, hybrid cloud infrastructures, or large-scale containerized applications, as it provides deep visibility into container performance and helps ensure system reliability. Site24x7 is well-suited for businesses that rely on multi-cloud environments or need a scalable monitoring solution to manage Docker containers across various platforms like AWS, Azure, or on-premises networks.
Pros:
- Insights into Docker container performance, including CPU, memory, disk I/O, and network usage
- Customizable alerting based on thresholds
- Automatically detects and monitors newly deployed containers
- Integrates seamlessly with multiple cloud platforms, such as AWS and Azure
Cons:
- No on-premises hosting option
Site24x7 isn’t just a Docker monitoring tool; it also monitors other applications plus networks, servers, cloud platforms, and Web assets. You can access the entire platform on a 30-day free trial.
4. SolarWinds Docker Monitoring with AppOptics
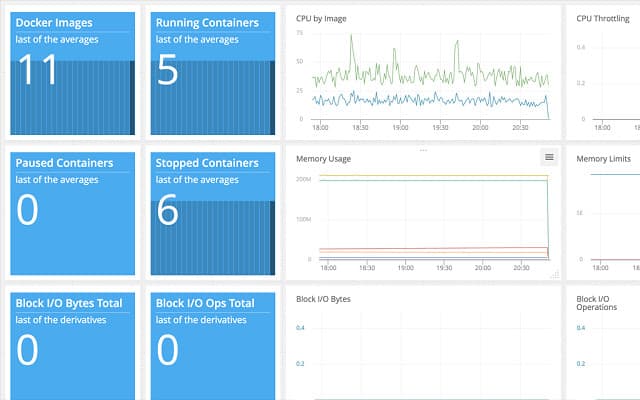
AppOptics is a Cloud-based system monitoring tool from SolarWinds. This utility will monitor servers and networks that are both on-premises and in the Cloud. The tool requires data collectors to be active on a host on the network. These collectors can run on Windows and Linux, as well as Cloud platforms, such as AWS.
Key Features:
- Easy to set up
- Application dependency mapping
- Server resource monitoring
- Docker activity monitoring
- Network monitoring
Why do we recommend it?
SolarWinds AppOptics provides an APM and also an Infrastructure Monitoring module. Docker Monitoring is part of the Infrastructure Monitoring plan. You can add on the APM to see how applications are performing within the Docker containers. This higher plan provides a service dependency map. You will also get server performance feedback.
The price model of AppOptics works well for Docker implementations. The system is charged per host, so if you have one application server and want to deliver all of your containerized software from that, you only need to watch the traffic from one source. The number of Docker virtual networks doesn’t influence the price of AppOptics.
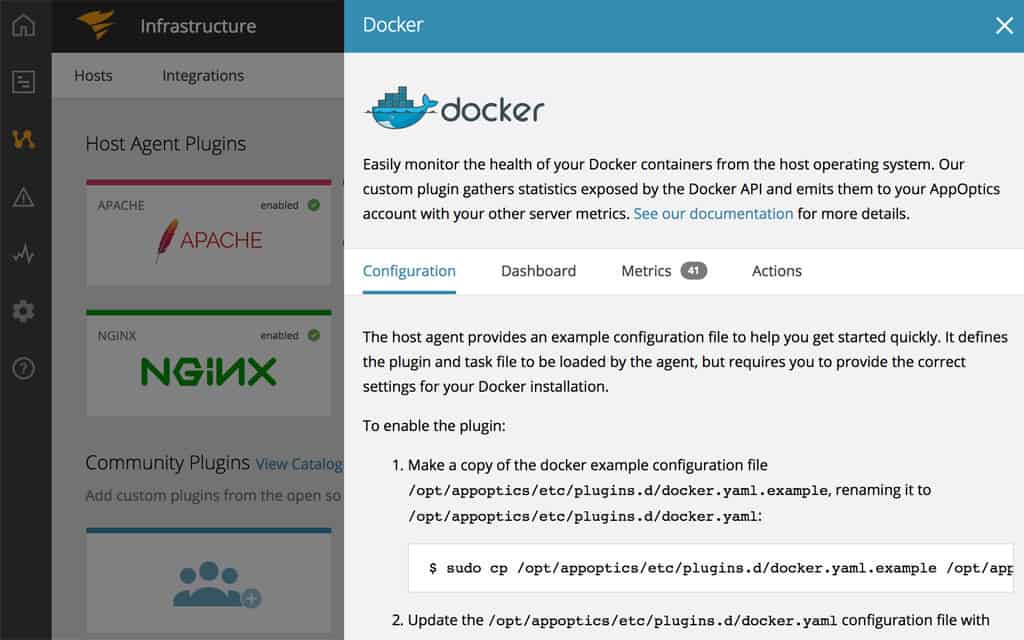
AppOptics has two price levels. The cheaper plan just monitors infrastructure, which means the server and network delivery systems. This plan also includes container monitoring, so if you just want to check on the performance of Docker, then this option will be good enough. The higher plan also includes container monitoring and adds on application performance monitoring.
Who is it recommended for?
This package is hosted in the cloud, so it is easy to manage. The platform also provides storage space for metrics and allows you to perform historical analysis on Docker container performance. The monitoring of server resources helps you with root cause analysis if problems arise.
Pros:
- Offers great visualizations reflecting live and historical health metrics and resource consumption
- Is easily scalable, built as a cloud service
- Tracks all major resources metrics (great for beginners and veterans)
- Can monitor Docker, Azure, and Hyper-V platforms, offering more flexibility than competing options
Cons:
- Would like to see a longer trial period
AppOptics gives you a web-based dashboard, so you can access it from anywhere, even when you are out of the office. The charging rate for the service is billed on a subscription basis. You can pay for it per month, but you get a better rate if you sign up for an annual subscription. You can sign up for a 14-day free trial to evaluate the tool.
5. Portainer
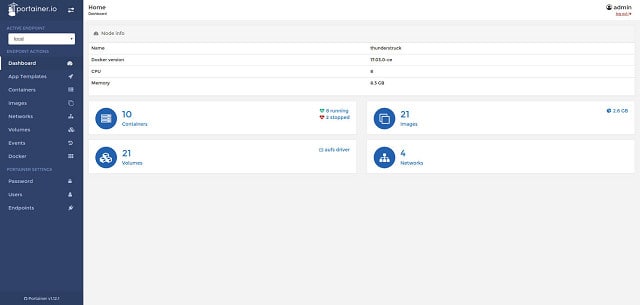
Portainer was specifically designed as a user interface for Docker. As such, it is the most perfect match that you can find to make up for the fact that Docker doesn’t have a GUI front end. This is a pure Docker management interface and it is open source and free to use. The tool covers all Docker container activity and is a great way to set up and monitor swarms, which can be difficult to keep track of.
Key Features:
- Specializes in Docker and Kubernetes
- Governance and activity logging
- Manage and monitor containers
Why do we recommend it?
Portainer is a cloud-based monitoring system that is specifically designed to track the performance of containers and related technologies. It will monitor Docker, Kubernetes, and Swarm. It is designed for use with on-premises, cloud, and industrial applications of Docker. The tool provides a searchable overview screen and details for each container.
Although it is free to use, you will have to pay for support. The company that developed this tool is called Portiner.io and it offers two levels of support in paid packages. Without that service, you will have to rely on the user community for support, which is available through a Slack channel.
Portainer runs as a Docker container, so it installs on any operating system that Docker runs on. The dashboard lets you look at every element of a Docker implementation from images through to endpoint activity.
Who is it recommended for?
The layout of the Portainer dashboard makes this tool very useful for businesses that have a large number of containers in operation. The ability to search through the list of active containers means that you wouldn’t need to scroll through a long list of instances.
Pros:
- Specifically designed to make Docker management easier and more scalable
- Completely free
- Offers a more visual way to manage your environment beyond the CLI
Cons:
- Unlike other tools, Portainer only monitors Docker containers
6. cAdvisor
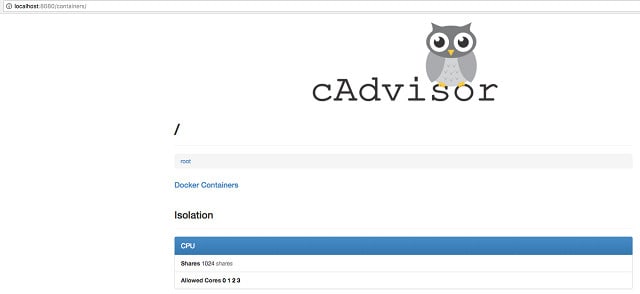
Google produces cAdvisor specifically to monitor containers. This is an open-source project with its code available on GitHub. This tool was written on Linux, but it was then exported to an image, so it will run in a container. Thankfully, this monitor has a graphical user interface, which is accessed through your browser.
Key Features:
- Provided by Google
- Tracks resource usage
- Only monitors one host
Why do we recommend it?
cAdvisor is a free tool for monitoring Docker container activity and resource utilization. The service is written for Linux but you can run it within a Docker container, which means that it will work on any platform that supports Docker. The dashboard gives live time-series graphs of resource activity.
The information shown in the screen is taken directly from the output of the docker stats command. However, being browser-based, you aren’t stuck in a terminal session and the font is easier on the eye than the presentation of the docker stats output.
The live data that you will see in the monitoring screen are the CPU, disk, and memory utilization on your Docker host, network interface activity on the host, and traffic volumes per network.
As a free tool, this is a great opportunity for small businesses that run Docker. However, cAdvisor is limited to monitoring just one host. So, if you have a multi-host/swarm-based implementation, you will have to look elsewhere for a Docker monitoring tool. Other problems with cAdvisor are that it isn’t able to analyze or display historical data and it doesn’t have any alerting features.
Who is it recommended for?
This is a great tool for any system administrator running Docker containers. It costs nothing, so you don’t have to find the budget for it and you can run it in containers, so doesn’t present a security threat. The service can be set up to implement remediation actions in specific circumstances.
Pros:
- Free tool for monitoring Docker services and environments
- Uses a web-based dashboard for simple and easy access
- Developed and updated by Google
Cons:
- Only monitors Docker environments
- Requires more technical knowledge to set up and use
Managing Docker containers
The absence of a graphical interface for Docker makes the system harder to manage than regular virtualization systems. Adding a front end to your Docker implementation will expand your usage of this interesting method for software delivery.
Getting into Docker is becoming increasingly easier, thanks to the adoption and integration of containerization by Microsoft. The inclusion of container methods in Windows 10 and recent versions of Windows Server will make the usage of Docker much more widespread over the coming years.
The inclusion of Docker on Cloud servers also will increase the system’s proliferation. You can even get Docker itself on the Cloud, so if you want to push as much of your IT infrastructure requirements offsite, Docker has already got a solution for you.
Considering the suitability of Docker to delivering corporate apps to remote user-owned mobile devices makes this virtualization method an ideal solution for businesses that have no premises and use independent contractors instead of staff.
Remote, home-based contributors will use their own equipment and their geographical spread removes the need to rent office space, thus also removing the requirement for onsite infrastructure. Docker enables the delivery of corporate software to remote devices without the need to install the software on the worker’s own equipment. This makes the onboarding and termination of contractors a risk-free proposal.
So, Docker is the delivery system of the future. The macvlan network type is a good channel for switching over from a traditional virtualization system to Docker. The addition of a GUI front end, thanks to tool providers, such as Datadog Docker Monitoring, Paessler, and Site24x7 makes the move to Docker even more tempting.
Do you use Docker to deliver software and services to your network users? Did you find any problems setting up the networks? Which network driver do you use the most? Do you use a monitoring tool or do you rely on the command line system native to Docker? Leave a message in the Comments section below and share your expertise with the community.

