As data flows across increasingly complex infrastructures, having the right tools to ensure real-time visibility and actionable insights is essential for maintaining performance, compliance, and security.
Two of the most popular solutions in the monitoring and log management space are Datadog and Sumo Logic, both of which provide robust platforms to collect, analyze, and visualize data from multiple sources.
Each of these tools has earned a reputation for offering comprehensive monitoring solutions, but their approaches, features, and target audiences differ in several key ways.
Datadog is renowned for its cloud-based, highly scalable monitoring and analytics platform designed to provide full-stack visibility into the performance of applications, infrastructure, and logs. It integrates seamlessly with various cloud services, containers, and microservices, making it a popular choice for modern, cloud-native organizations. Its real-time dashboards, powerful alerting system, and machine learning-driven anomaly detection make Datadog a go-to solution for businesses looking to optimize system performance and reduce downtime.
Sumo Logic offers a cloud-native machine data analytics platform that focuses heavily on log management, security information, and event management (SIEM). It provides advanced features for detecting and investigating security threats, compliance monitoring, and performance optimization. With its real-time insights and highly customizable dashboards, Sumo Logic is well-suited for organizations that prioritize security operations and risk management, especially in industries that require stringent compliance standards.
In this article, we’ll compare Datadog and Sumo Logic, examining their features, benefits, and use cases to help you determine which platform is best suited for your organization’s monitoring needs.
Overview of Datadog

Datadog is agent-based observability, security, and performance monitoring service for cloud-scale applications. It provides real-time monitoring services for cloud applications, servers, databases, tools, and other services, through a SaaS-based data analytics platform. Datadog brings together end-to-end traces, metrics, and logs to make your applications, infrastructure, and third-party services entirely observable. These capabilities help businesses secure their systems, avoid downtime, and ensure customers are getting the best user experience.
Datadog was named Leader in the 2022 Gartner Magic Quadrant for Application Performance Monitoring (APM) and Observability. Some of the key observability and security products and services offered on the Datadog SaaS-based platform include
- Application Performance Monitoring (APM) Provides end-to-end distributed tracing from browser and mobile apps to databases and individual lines of code.
- Infrastructure Monitoring Provides metrics, visualizations, and alerting to ensure your engineering teams can maintain and optimize your cloud or hybrid environments.
- Network Performance Monitoring Provides full visibility into every network component that makes up your on-prem, cloud, and hybrid environments, with little to no overhead.
- Real User Monitoring (RUM) Provides insight into your application’s frontend performance from the perspective of real users.
- Synthetic Monitoring Allows you to create code-free tests that proactively simulate user transactions on your applications and monitor key network endpoints across various layers of your systems.
- Log Management & Analytics Unifies logs, metrics, and traces in a single view, giving you rich context for analyzing log data.
- Security Monitoring Provides full-stack security across your entire production environment, including real-time threat detection and continuous configuration audits
With more than 600 built-in integrations, Datadog allows you to see across all your systems, apps, and services while aggregating metrics and events across the full DevOps stack. A free 14-day trial with full access to all the features is available for download. After that, the software is generally sold through monthly subscription plans based on hosts, events, or logs.
Overview of Sumo Logic

Sumo Logic is an agent-based, cloud-native, multi-tenant observability and security monitoring platform that leverages machine-generated big data to provide analytics services that deliver real-time IT insights. The Sumo Logic multi-tenant platform enables organizations to aggregate data across their technology stack, receive real-time analytics and visualization metrics that help to identify potential issues, and generate alerts and notifications which help to diagnose problems and provide insights required to make data-driven business decisions. Sumo Logic was named Challenger in the 2022 Gartner Magic Quadrant for APM and Observability.
Sumo Logic is built around a globally distributed data retention architecture that employs elastic processing to collect, manage, and analyze log data, regardless of type, volume, or location. This cloud-based approach eliminates the need for organizations to manage the cost and complexity of data archiving, backups, and restoration, including limits on scalability and poor analysis. Sumo Logic collects data from monitored systems using a java agent called Collector that receives logs and metrics from its sources and sends them to the Sumo cloud servers. The Sumo Logic observability and security monitoring portfolio include
- Infrastructure Monitoring An integrated observability platform that helps to reduce downtime and solve customer-impacting issues.
- Cloud Log Management A modern log management solution to improve monitoring and troubleshooting, and overall security posture.
- Application Observability Helps to enrich and analyze traces, logs, and metrics in real-time with automatically generated application topology.
- Software Development Optimization Provides software delivery insights to increase velocity, improve reliability and remove blockers.
- Cloud Security Monitoring & Analytics Stay ahead of changing attack surfaces. Generate deep security insights via use-case-driven queries, dashboards, and alerts.
- Cloud SIEM Speed up incident investigations by automatically triaging alerts and correlating threats across your on-prem, cloud, multi-cloud, and hybrid cloud sources.
Sumo Logic supports integration with over 250 technologies. This allows you to get data from your on-premise and cloud infrastructure, applications, and services into your Sumo Logic platform. A 30-minute demo and a 30-day free trial with full access to all the features are available on request with no credit card required. After the 30-day trial, it will revert to the Free account, and you will be required to purchase a valid license to continue using the service.
Datadog vs Sumo Logic: How They Compare
Installation and Set Up
Datadog is a SaaS-based application, there are no on-premise system requirements and no installation hassles. However, you’ll be required to install local agents specific to the device or service you wish to monitor for the most part. An agent-based mode means no auto-discovery feature, so you have to deploy an agent for all your devices individually. Datadog supports integration with VMware vSphere, but the setup process is a bit complicated. That said, Datagod provides enough documentation and setup instructions to guide you through the installation and configuration process.
Just like Datadog, Sumo Logic is also a SaaS-based application. This means that there are no on-premise system requirements and no installation hassles other than the usual sign-up process and account activation using a modern web browser with JavaScript enabled. However, since Sumo Logic is an agent-based application, you will also be required to individually install and configure the Sumo Logic collector on the device you wish to monitor. Once data collection is running, the Setup Wizard installs a Sumo Logic App with pre-configured Dashboards that allow you to analyze your data. The Setup Wizard provides detailed instructions to help you with each step of the configuration, which makes the process pretty straightforward.
Dashboards and Visualizations
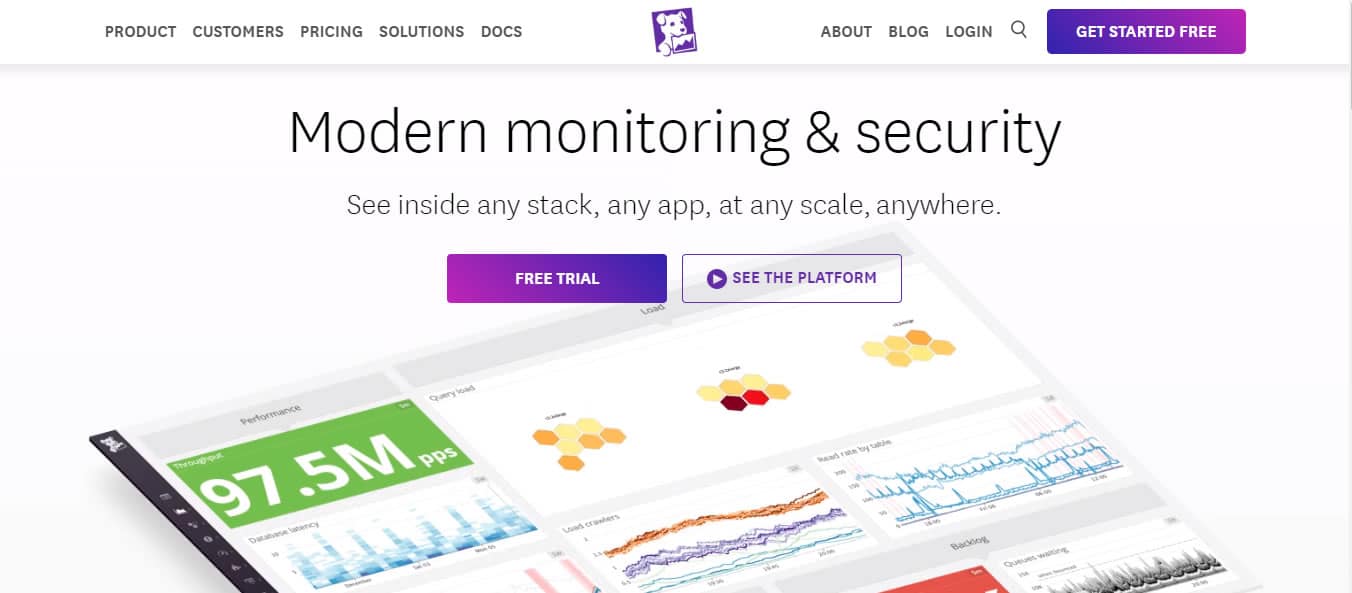
Datadog dashboards are generally more user-friendly and aesthetically pleasing from a visual perspective with their clean and modern dashboard design. In addition, Datadog allows you to customize your dashboards with a vast library of visualization tools and drag-and-drop widgets. But it requires a lot of setup work to get things working. Once set up, there are two primary ways of visualizing your data:
- Screenboards These are grid-based dashboards with free-form layouts that include images, tables, host maps, graphs, and logs. They are commonly used as status boards or storytelling views that update in real-time or represent fixed points in the past.
- Timeboards This represents a single point in time—fixed or real-time—across the entire dashboard. They are commonly used for troubleshooting, correlation, and general data exploration. In addition, you also get a time series that can plot any metric being captured from your hosts, such as CPU usage, uptime, or memory usage.
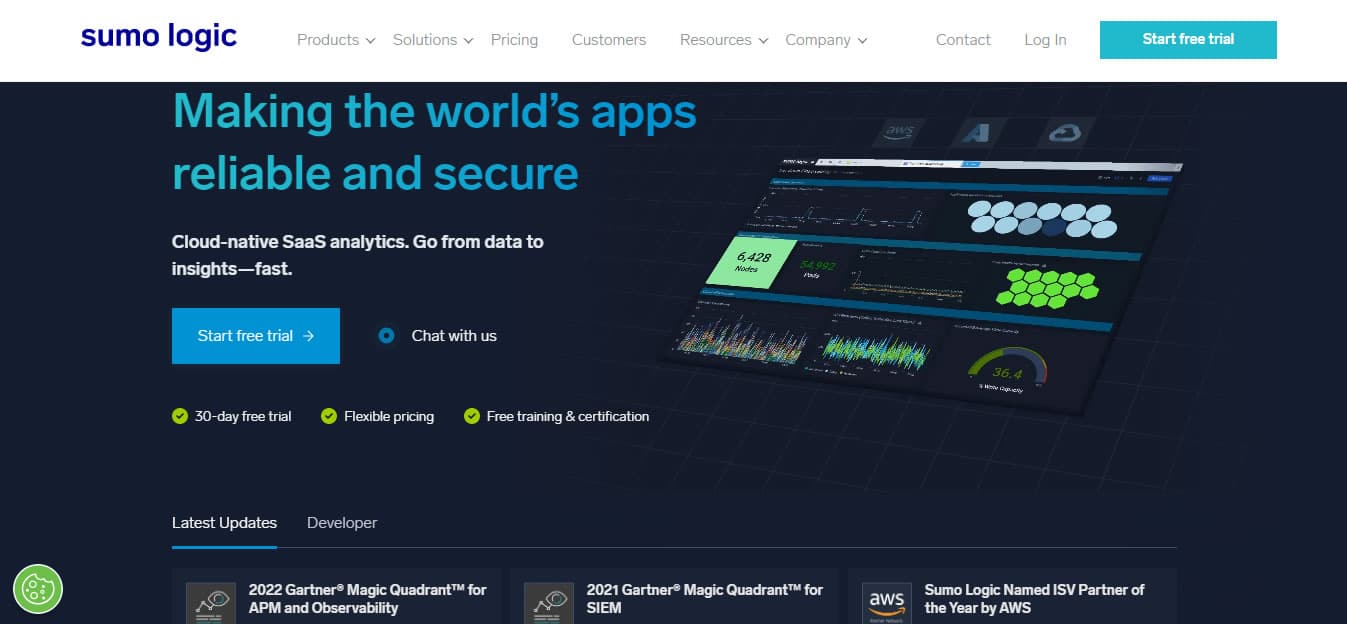
Sumo Logic is equipped with next-generation dashboarding visualization for faster data insights. Next-gen dashboard visualizations enable customers to have rich unified analytics across their metrics and log data with detailed visual control for optimal monitoring and troubleshooting. Customers can now templatize their dashboards to rescope data on the fly, get interactive and data-dense visuals that help them isolate patterns quickly, and export dashboards to PDF or PNG for easy sharing via email or Slack. If the pre-built dashboards do not meet your needs, Sumo Logic allows you to build custom dashboards to suit your needs.
Alerts and Notifications
Datadog’s approach to alerts and notifications is based on machine learning (ML), which it calls Watchdog. Watchdog uses ML techniques to identify problems in your infrastructure, applications efficiency, and services, and flag anomalies. Alerts in Datadog are called Monitors. Users can receive alerts using Pagerduty, Slack, and email. These can be based on nearly any metric that Datadog can capture. As a result, every alert is specific, actionable, and contextual—even in large and temporary environments. This unique approach to alerts and notifications makes Datadog stand out and helps to minimize downtime and prevent alert fatigue.
Sumo Logic uses monitors and scheduled searches to notify users of changing conditions. Monitors continuously query your logs or metrics and send notifications when specific events occur. Scheduled searches are standard saved searches that are executed on a schedule you set. Once configured, scheduled searches run continuously, making them a great tool for continuously monitoring your stack. Sumo Logic allows you to customize notifications with the information you need. The Sumo Logic alerting system is designed to elicit a response in a timely fashion and accelerate issue resolution. When an alert condition is satisfied Sumo Logic triggers the selected alert type to inform network admins about faults or anomalies. Alert types include real-time alerts, email alerts, and webhook connections, among others.
Reporting and Integration
Instead of generating the usual out-of-the-box reports that most network admins expect, Datadog’s approach to reporting aims to make metrics easily searchable, and it does excellently. Although some network managers prefer reports to be generated in good old PDF format, not everybody needs it in that format these days. Therefore, Datadog also comes equipped with an easy-to-use API that can significantly extend the range of what Datadog can track. The Datadog API is an HTTP REST API that can access the Datadog platform programmatically and returns JSON from all requests. Similarly, Datadog’s ability to support and integrate with more than 600 technologies makes it more versatile and adapted to many different functions than Sumo Logic.
Like Datadog, Sumo Logic does not follow the usual out-of-the-box reports that most network admins expect. However, administrators can access and organize data related to a particular area such as incidents for example, and produce reports. Sumo Logic provides an API connection that allows you to interact with the platform and pull/push data. It also supports integration with over 250 technologies. This allows you to get data from your on-premise and cloud infrastructure, applications and services into your Sumo Logic platform. Although this is half the number that Datadog supports; nonetheless it doesn’t matter as long as it covers your integration requirements. For most third-party integrations you need to be an existing customer of both Sumo Logic and the outside solution.
Licensing and Price Plans
Datadog pricing model is based on per server, per month, and it’s free for up to 5 hosts (with 1-day data retention). But some customers complain that it becomes costly at scale. As a result, Datadog is available in several different pricing tiers:
- The Network Performance tier Suitable for monitoring networks and systems for most small to midsize businesses.
- The Infrastructure tier Ideal for organizations that want to use the software as a centralized monitoring service for systems and services.
- The APM tier Designed for larger organizations looking to fix service and device-layer problems.
- Serverless tier Aimed at those looking to monitor network and application issues.
- Log Management tier Meant for companies with large amounts of log data to parse for context and retention.
- There are also other security, synthetic, and accurate user monitoring, each appropriate pricing for the core task.
All Datadog prices are billed annually, making it one of the most price-customizable management apps.
Sumo Logic offers a flexible and predictable pricing model and data tiering to capture all relevant application telemetry cost-effectively. Price plans include Free, Essentials, and Enterprise (operations, security, and suite). With an innovative cloud-based licensing model, customers pre-purchase credit capacity that can be flexibly applied to pay for data and capabilities within your platform. A credit is a unit of measure that is used to flexibly pay against the use of any Sumo Logic products within a service agreement plan. Credits reflect the platform utilization by product variable on a daily, weekly, or monthly basis, and are updated in the system in real-time. Credits are licensed as part of the agreement in annual buckets, and you can choose how best to configure the platform to maximize your ROI by optimizing ingest and use case patterns. Priority support is included in all the Enterprise price plans.
| Features | Sumo Logic | Datadog |
|---|---|---|
| Target market | Ideal for IT, Security, and Development teams across all customer sizes. | Ideal for developers, freelancers, IT operations teams, security engineers, and business users from SMBs to large organizations in the cloud age. |
| Security capabilities | Cloud Security Monitoring & Analytics, Audit & Compliance, Cloud SIEM Cloud SOAR | Cloud SIEM, workload security, application security monitoring, and more |
| Deployment model | SaaS-based | SaaS-based |
| Integration | 250+ | 500+ |
| REST API | Yes | Yes |
| Support methods | Email/phone/chat Online case submission Training & Certifications Documentation Community Knowledge Base | Email/phone/chat Online case submission Knowledge base Documentation Video tutorials |
| Licensing and pricing model | Subscription-based Free trial available Free account Billing is based on Data Points per Minute (DPM)—the average number of metric data points ingested per minute in one thousand increments. | Subscription-based Free trial available Billing is based per server, per month |
Table 1.0 | Comparison of Sumo Logic and Datadog key features
Choosing Between Datadog and Sumo Logic
Datadog and Sumo Logic have both distinguished themselves in the observability and security monitoring space. Deciding between the duo shouldn’t be about which is better but the one that best meets your performance and security monitoring needs.
Datadog’s SaaS-based model makes it ideal for organizations that don’t want to burden themselves with any resource-intensive on-premise monitoring solution. Service-oriented companies, SMBs, or smaller networks that don’t have dedicated IT personnel to keep tabs on the infrastructure at a granular level will find this feature-rich tool suitable. More extensive networks with multiple remote locations may find Datadog’s agent-based model inconvenient since agents need to be individually installed. But if you can successfully get past the agent installation and configuration process, Datadog is a mature and excellent network observability platform.
Sumo Logic excels at unifying all application telemetry and applying analytics for faster troubleshooting across your entire application stack. Its advanced machine-learning algorithms simplify the process for administrators to synthesize and analyze their data. It offers flexible and predictable pricing and data tiering to capture all relevant application telemetry cost-effectively. This makes it ideal for organizations of all sizes. Organizations seeking all-encompassing observability and security monitoring capabilities including end-to-end Kubernetes monitoring and rich analytics will find their needs met in Sumo Logic. Sumo Logic makes it easy for your team to navigate from customer issues at the service level to platform problems at the container level.


