Citrix is a cornerstone technology for organizations that rely on virtual desktops, applications, and remote work solutions to enhance productivity and flexibility. However, managing and optimizing Citrix environments can be complex, as performance issues, latency, and resource bottlenecks can directly impact end-user experience. That’s where Citrix monitoring tools come in, offering invaluable insights into the health and performance of your Citrix infrastructure to ensure seamless operations.
Effective Citrix monitoring tools help administrators identify and resolve issues before they escalate, enabling a proactive approach to managing virtual environments. From tracking user sessions and resource usage to diagnosing network latency and application slowdowns, these tools provide detailed analytics and real-time alerts to maintain optimal performance. By leveraging these insights, IT teams can ensure that employees and customers enjoy a smooth, uninterrupted experience.
The best Citrix monitoring solutions go beyond basic metrics, offering advanced features like root cause analysis, automated reporting, and integration with broader IT monitoring systems. These tools cater to a range of use cases, whether you’re managing a small Citrix deployment or a large-scale enterprise environment with thousands of users. They are essential for optimizing resource allocation, maintaining compliance, and aligning IT operations with business objectives.
In this guide, we explore the best Citrix monitoring tools available today, highlighting their key features, benefits, and use cases. Whether you’re looking to enhance visibility into your Citrix environment, improve troubleshooting efficiency, or gain detailed performance analytics, this guide will help you find the tools best suited to your needs. With the right monitoring solution, you can unlock the full potential of your Citrix infrastructure while delivering exceptional user experiences.
Here is our list of the best Citrix Monitoring tools:
- ManageEngine OpManager EDITOR’S CHOICE This network performance monitor also monitors server and virtualizations, with specialist routines for the discovery and tracking of Citrix Xen implementations. Available for Windows Server, Linux, AWS, and Azure. Access a 30-day free trial.
- Paessler PRTG Network Monitor (FREE TRIAL) An all-in-one server, applications, and network monitor that provides the ideal combination of services to monitor Citrix Hypervisor implementations. Download 30-day free trial.
- eG Enterprise (FREE TRIAL) An infrastructure monitor that has great drill-down capabilities that help root cause analysis with Citrix Hypervisor problems. Access a 30-day free trial.
- Dynatrace A cloud-based infrastructure monitor that has Xen, Amazon EC2, Hyper-V, KVM, and VMWare specializations.
- SolarWinds Server & Application Monitor A comprehensive monitor for servers and everything that runs on them. The long list of services that this tool supports includes Virtual Apps and Virtual Desktops.
- SysKit Monitor Real-time monitoring and historical data performance analysis from this agentless network monitor.
- ControlUp This impressive infrastructure monitor includes a virtualization mapper.
- ExtraHop Watch ICA and CGP transactions in real-time with this monitor and track bandwidth usage at the same time.
- Goliath Performance Monitor A network monitor that includes Citrix performance tracking.
The best Citrix monitoring tools
Our methodology for selecting a Citrix monitoring system
We reviewed the market for monitors that track hypervisors, such as Citrix systems, and analyzed the options based on the following criteria:
- Automatic virtualization structure discovery and mapping
- Simultaneous monitoring of supporting physical resources
- The ability to spot the automatic movement of VMs between hosts
- Warnings for resource capacity limits
- Demand analysis
- A free trial or a demo for a cost-free assessment opportunity
- Value for money, represented by a Citrix monitor that can also be used to monitor other IT assets
Using this set of criteria, we looked for virtualization monitors that can also watch over the networks and servers that support the activity of the hypervisor. Tools that are also able to monitor Hyper-V and VMWare were prioritized.
All the products on this list are ideal for monitoring the performance of Citrix infrastructure and keeping key services available.
1. ManageEngine OpManager (FREE TRIAL)
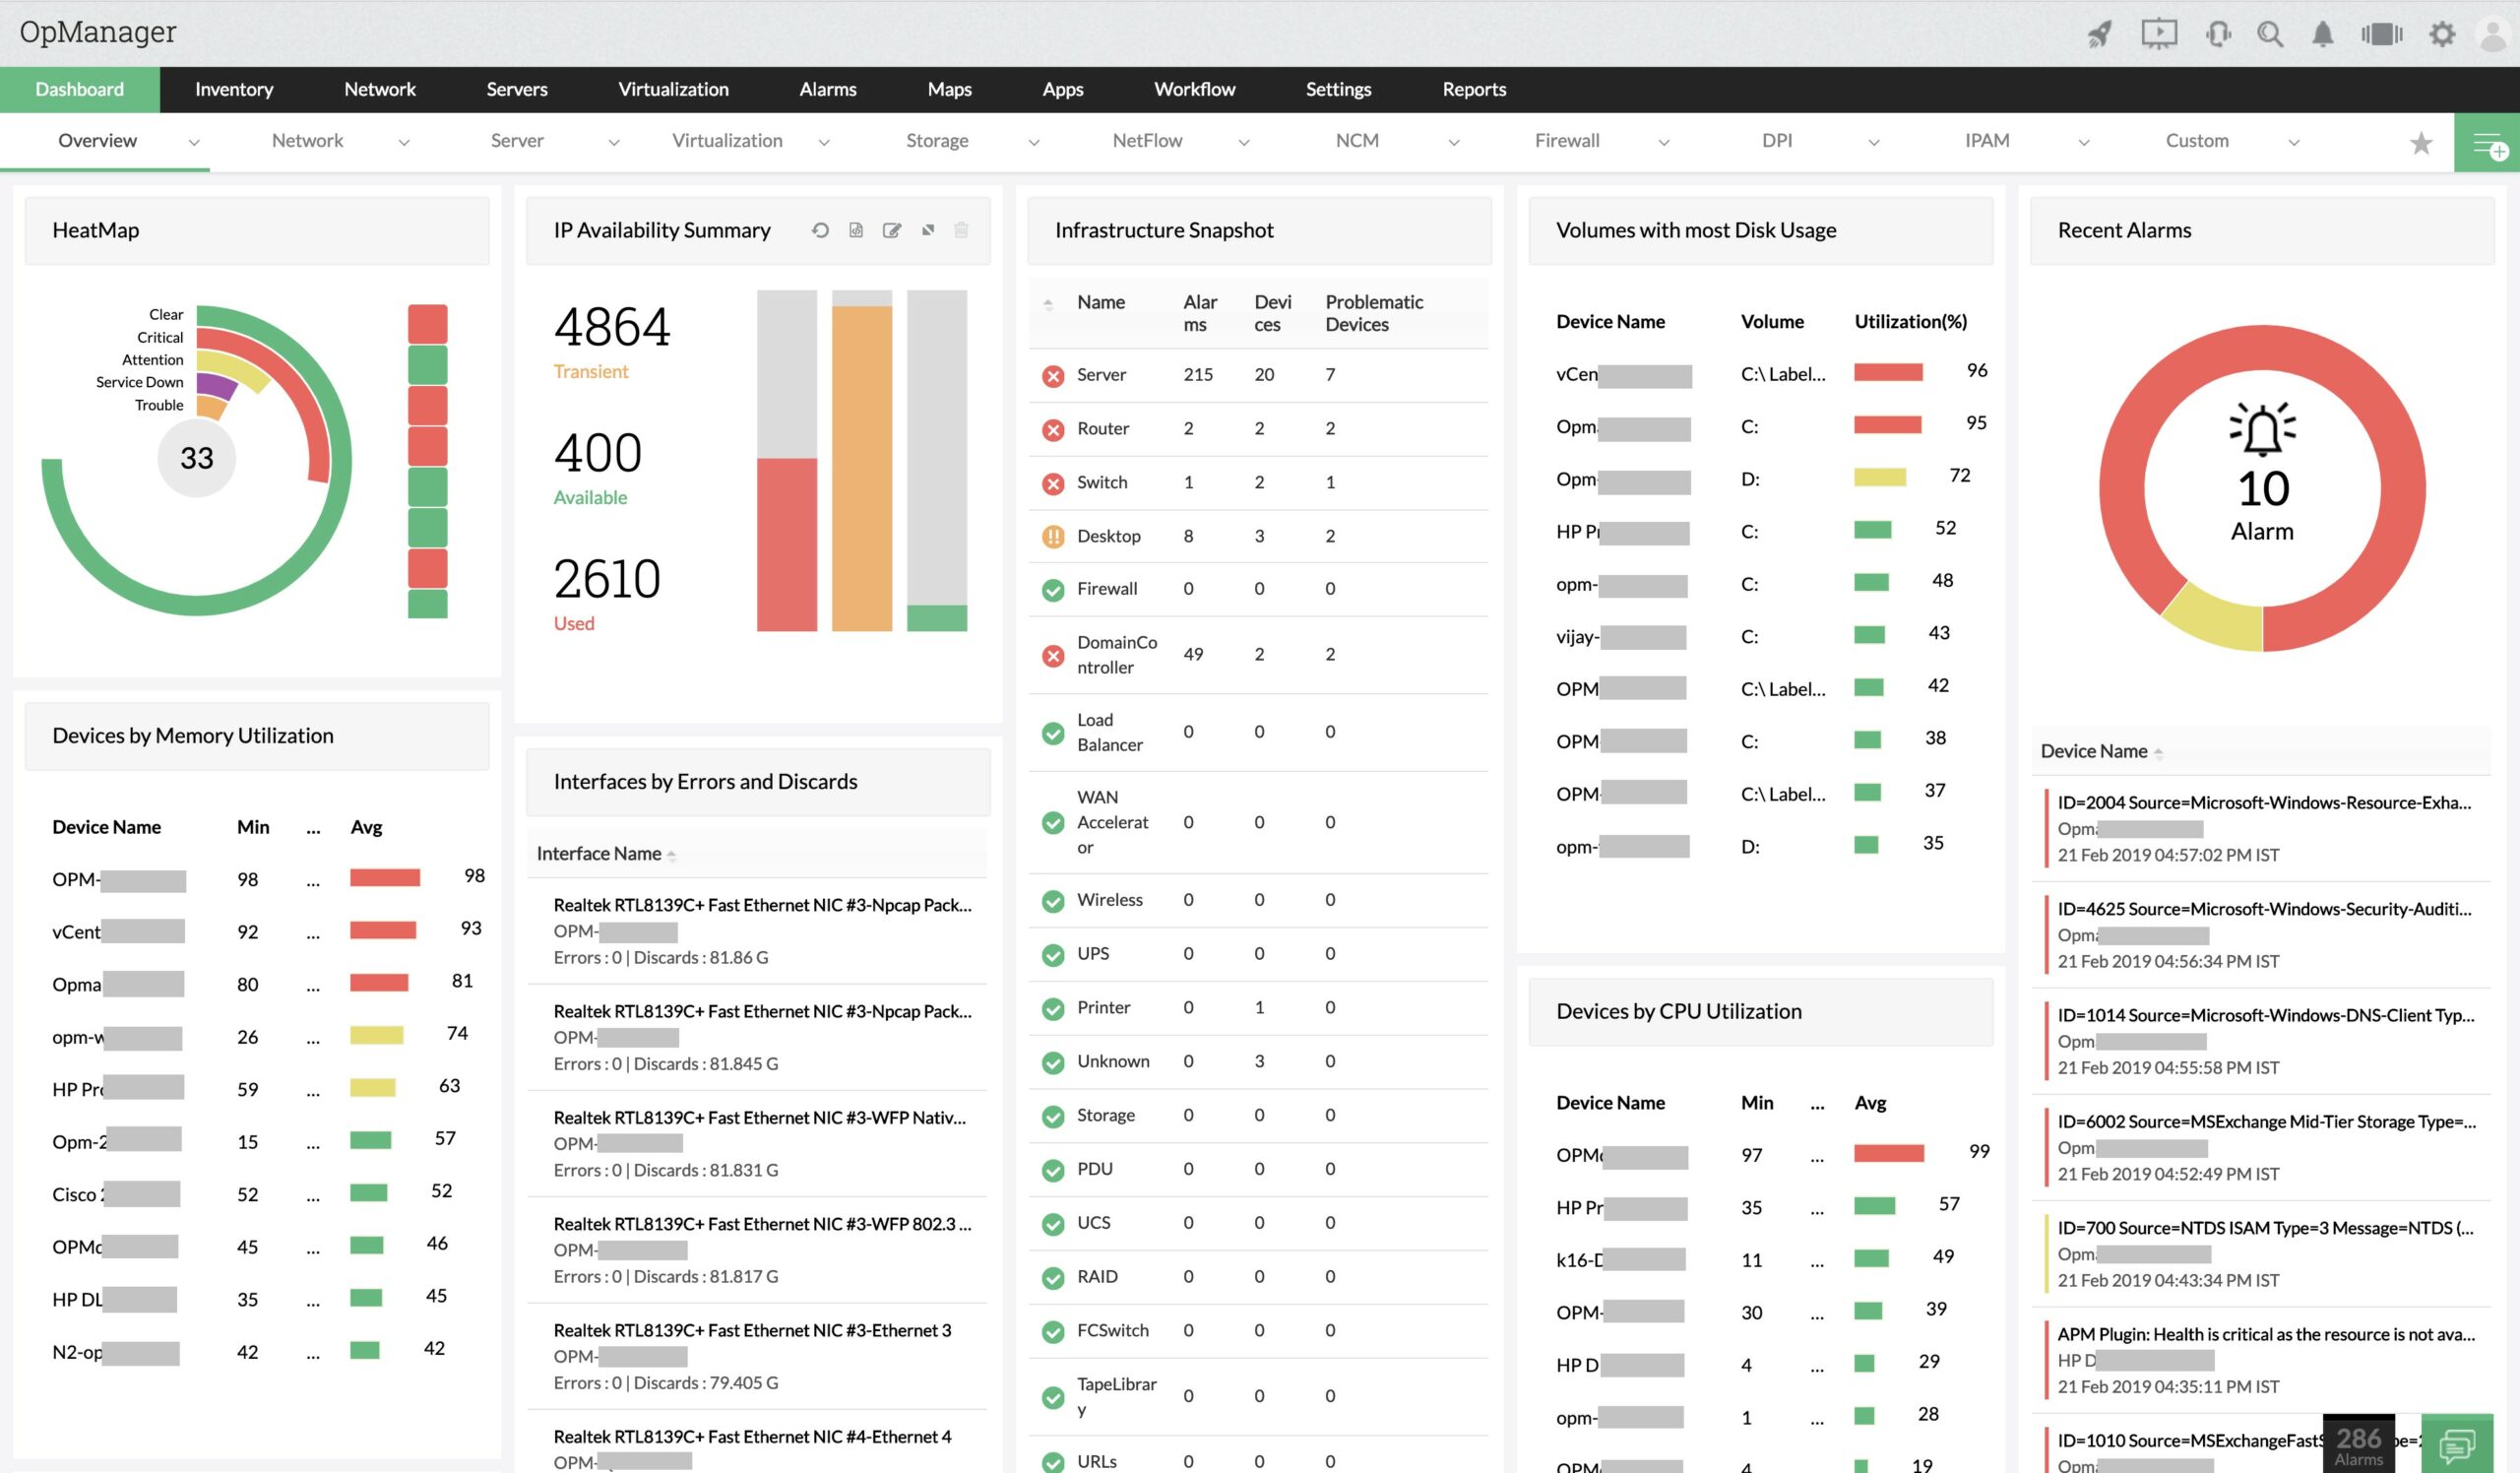
ManageEngine OpManager is a network performance monitor that implements network discovery and creates a network inventory plus topology maps. The service also monitors servers and virtualization with Citrix monitoring capabilities in that list of services.
Key Features:
- Automated Virtual Discovery: Effortlessly identifies and catalogs the components of your virtual infrastructure for comprehensive visibility.
- VM Movement Detection: Accurately tracks and reports the dynamic reassignment of VMs across hosts, ensuring you’re always informed.
- Server Resource Oversight: Diligently monitors the resources of servers underpinning virtual environments, safeguarding performance.
Why do we recommend it?
ManageEngine OpManager provides both network and server monitoring functions which is the ideal combination of competence for tracking the performance of virtualizations, such as Citrix Xen. This tool watches over Hyper-V, VMware, and Nutanix systems as well. It tracks physical servers and network equipment and cloud platform statuses all in real-time.
The package scans Xen structures, mapping servers and VMs plus the connecting virtual network structure between them. As a server monitor, the tool can also correlate the linked demands on the physical server that supports the hypervisor.
Xen Motion will move the allocation of VMs from one host to another to match resource demand with capacity availability. This is a great service for the efficient use of resources, but a nightmare for monitoring. OpManager is able to track these movements and update its dependency maps so you can see exactly what is happening and where.
Who is it recommended for?
ManageEngine offers a Free edition of OpManager but that won’t monitor your Citrix virtualizations. However, the Professional edition, which includes virtualization monitoring, is priced for monitoring 10 devices, which is suitable for small businesses. Larger businesses are catered for, too, with capacity expansions and a multi-site version available.
Pros:
- Extensive Monitoring Reach: Provides a broad scope of monitoring capabilities, encompassing networks, servers, and virtual systems including Citrix, Hyper-V, VMware, and Nutanix.
- In-Depth Virtual Insights: Capably maps out the entirety of Xen structures, offering clear visibility into servers, VMs, and their network connections.
- Adaptive Resource Tracking: Seamlessly correlates physical server demands with virtual activities, optimizing resource allocation and performance.
- Dynamic Virtualization Support: Keenly observes the fluid movement of VMs due to Xen Motion, keeping your infrastructure mapping current and accurate.
Cons:
- Lack of Cloud Service: Currently does not offer a Software as a Service (SaaS) version, limiting deployment options to on-premises or private cloud installations.
ManageEngine OpManager is written for Windows Server and Linux and it is also available as a service on the marketplaces of AWS or Azure. There is a Free edition of OpManager and ManageEngine offers a 30-day free trial of full service. If you choose not to buy at the end of the trial period, your installation switches over to the Free edition.
EDITOR'S CHOICE
ManageEngine OpManager is our top pick for a Citrix monitoring tool because this package covers networks and servers as well as virtualization, so it is the ideal package for examining the performance of Citrix virtualizations that deliver applications to users through systems such as thin clients. The monitoring service includes a series of performance thresholds, placed on each piece of equipment that the package monitors. This provides immediate root cause analysis because a problem with one part of the system will trigger an alert before its impact ripples through to all of the components that rely on it. For example, if users are reporting problems with the delivery of the Citric system, it could be that a network device is faulty and the origin of the performance issue has nothing to do with Citrix at all. Those alerts can head off problems and let technicians fix the problem hopefully before users notice. Citrix isn’t the only virtualization system that the tool with monitor, if you have Hyper-V or VMware, this package is also a good choice. It can also monitor Nutanix HCI.
Download: Get a 30-day free trial
Official Site: https://www.manageengine.com/network-monitoring/download.html
OS: Windows Server, Linux, AWS, and Azure
2. Paessler PRTG Network Monitor (FREE TRIAL)
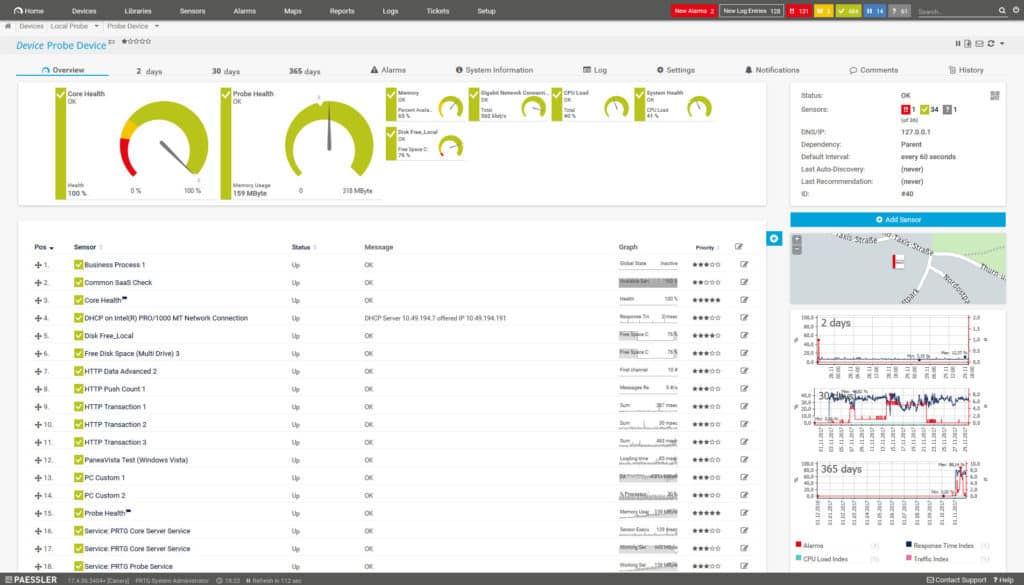
Paessler PRTG Network Monitor is a network monitoring tool that has a number of sensors that can monitor Citrix hosts. Through the PRTG Citrix Hypervisor Host Sensor, you can monitor the CPU usage, memory usage, network usage, number of running virtual machines, and a load average of Xen host servers. Similarly, the Citrix Citrix Hypervisor Virtual Machine Sensor can monitor virtual machines on a Xen server. Through this sensor, you can monitor the CPU usage, memory usage, disk usage, network usage, and balloon driver target size.
Key Features:
- Citrix-Specific Sensors: Offers tailored sensors for monitoring Citrix Hypervisor Hosts and Virtual Machines, covering CPU, memory, disk, and network usage.
- Backup Monitoring: Includes options to keep tabs on Citrix Hypervisor backups, ensuring data integrity and availability.
- Resource Utilization Tracking: Monitors the consumption of physical resources by Citrix systems to optimize performance.
- Flexible Alerts: Configurable notification system that can send alerts via email, SMS, or Slack to keep admins informed.
Why do we recommend it?
Paessler PRTG is a collection of sensors and there are a number that relate to Citrix Xen operations. For example, as well as watching Xen server performance, each VM needs to be tracked individually and then the availability of physical server resources is also important.
There is also a range of options for monitoring Citrix Hypervisor backups. For example, the IMAP Sensor allows you to monitor your emails for keywords that indicate a backup has been completed. By configuring this sensor you’ll be able to stay on top of backups and ensure your services are up-to-date.
The notifications system on PRTG Network Monitor is highly customizable. You can send alerts via email, SMS, or push notifications. Alerts can be scheduled according to your requirements. For example, you can configure it so you don’t get alerts outside of working hours.
Who is it recommended for?
Paessler provides PRTG for free for up to 100 sensors. However, Citrix systems require many different types of monitors so you would use up that allowance very quickly. For larger amounts, you buy an allowance of sensors and then choose which one to activate.
Pros:
- Dedicated Citrix Monitoring: Utilizes custom sensors designed specifically for Citrix environments, offering precise insights into performance metrics.
- Adaptable Dashboard: Provides a fully customizable interface, suitable for individual administrators or teams in a network operations center (NOC).
- Comprehensive Host and VM Monitoring: Enables detailed monitoring at both the host and virtual machine levels for Citrix systems.
- Varied Alerting Options: Supports multiple channels for alerts, accommodating different communication preferences and operational requirements.
- Freeware Availability: Offers a free version for up to 100 sensors, allowing small-scale or initial deployments at no cost.
Cons:
- Learning Curve: The extensive functionality and customization options necessitate a period of learning to fully exploit the system’s capabilities.
The great thing about PRTG Network Monitor is that the sensors system makes it easy to configure. All you need to do is launch one of the preconfigured sensors and you’re ready to go. PRTG Network Monitor has a scalable pricing model. PRTG Network Monitor starts at $1600 (£1,276.31) for 500 sensors and one server installation. There is a 30-day free trial.
3. eG Enterprise (FREE TRIAL)
eG Enterprise, from eG Innovations, is a network monitoring software platform that can monitor all the Citrix services in a single pane of glass. eG Enterprise is a top application monitoring solution because it allows you to move past superficial metrics and on to the issue of problem resolution. You can monitor every layer of your Citrix infrastructure and monitor data like CPU usage with bar charts and graphs to make sure you can see everything you need to.
Key Features:
- In-depth VM Discovery: Automatically identifies the relationships between VMs and their host servers for clear visibility.
- Dependency Mapping: Provides detailed maps showing the dependencies within Citrix environments, aiding in troubleshooting and planning.
- Performance Alerts: Utilizes intelligent baseline-based alerting to notify administrators of anomalies and potential issues.
Why do we recommend it?
eG Enterprise provides server and application monitoring as well as network activity tracking and it is particularly strong at monitoring Citrix services. This tool will track the internal operations of virtualizations and also the resource availability of the supporting physical servers.
To keep up with performance issues, eG Enterprise uses alerts. Alerts work by using auto-baselines to monitor for unusual activity. You can also configure alarm policies through the Alarm Manager. In effect, you have complete control over the activity you’ll be notified about.
Who is it recommended for?
The eG Enterprise system is one of the best packages available for Citrix monitoring because it covers many more Citrix products, such as Citrix Cloud and Citrix StoreFront, than the competition. Many monitoring systems know about Citrix XenServer and you get that monitoring capability with eG Enterprise plus a lot more.
Pros:
- Comprehensive Citrix Coverage: Monitors a wide array of Citrix services, offering insights beyond basic metrics for effective problem resolution.
- Visual Performance Insights: Employs graphical representations, including bar charts and graphs, for an intuitive understanding of Citrix infrastructure status.
- Flexible Alert Configuration: Features a customizable alert system, allowing for tailored monitoring policies and notifications.
- Versatile Deployment Options: Available for both on-premises and cloud environments, providing flexibility for different IT infrastructure setups.
Cons:
- Opaque Pricing: Does not disclose pricing details upfront, requiring potential users to contact sales for a quote.
- Initial Setup Complexity: The comprehensive monitoring capabilities come with a setup and configuration process that may be involved for new users.
- Learning Requirement: Offers deep and broad monitoring features that may present a learning curve to fully leverage the platform’s power.
eG Enterprise is available in a number of versions (on-premises and in the cloud); Easy Evaluation, Perpetual License, Subscription, SaaS, and Audit service. In order to view a quote for this product, you will have to contact the company directly. You can download the 30 day free trial to figure out your network’s requirements.
4. Dynatrace
Dynatrace is a virtualization monitoring platform that monitors virtual resources from all the main providers. Xen, Amazon EC2, Hyper-V, KVM, and VMWare are just some of the providers that Dynatrace supports. The platform monitors the entire application infrastructure behind the virtualization layer to help identify problems hidden beneath the surface.
Key Features:
- Broad Virtualization Support: Monitors a wide array of virtual resources including Xen, Amazon EC2, Hyper-V, KVM, and VMWare.
- Application Insight: Provides deep application dependency mapping to reveal the full infrastructure behind the virtualization layer.
- Comprehensive Compatibility: Well-suited for diverse environments, supporting VMware, Hyper-V, and KVM, alongside Citrix solutions.
Why do we recommend it?
Dynatrace is able to monitor Citrix XenApp/XenDesktop and Citrix NetScaler ADC as well as the standard XenServer virtualization system. The package offers a lot of VM options so you can mix systems on your site. It will also track the availability of the physical servers and cloud platforms that support your Citrix services.
What makes Dynatrace perfect for monitoring Citrix Hypervisor is that it can automatically detect and pinpoint the root cause of performance issues. This is even more useful due to the fact that infrastructure changes are updated automatically so new servers will be added to your monitoring environment automatically.
Who is it recommended for?
Virtualization monitoring is included in the Infrastructure Monitoring plan offered by Dynatrace. This is reasonably priced and accessible to businesses of all sizes. Its rate is set per hour per server, which is unusual but it makes the service very scalable. This module is also included in the more comprehensive Full Stack Monitoring edition.
Pros:
- Unified Citrix Monitoring: Capable of overseeing Citrix XenApp/XenDesktop and Citrix NetScaler ADC, in addition to XenServer.
- Intelligent Problem Detection: Automatically identifies and pinpoints the root causes of performance issues for swift resolution.
- Automatic Infrastructure Updates: Dynamically updates monitoring to include new servers and infrastructure changes without manual intervention.
- Versatile Deployment: Available as a cloud service, eliminating the need for local installation and infrastructure management.
Cons:
- Limited Trial Duration: Offers only a 15-day free trial which may not suffice for extensive evaluation needs.
- Complexity for Novices: The platform’s depth and enterprise focus might present challenges to non-technical users or smaller organizations seeking simpler solutions.
If you require a virtualization monitoring solution that provides visibility beyond the virtualization layer then Dynatrace is a natural choice. To view the price of Dynatrace you will have to contact the sales team directly. You can also download the 15-day free trial.
5. SolarWinds Server & Application Monitor
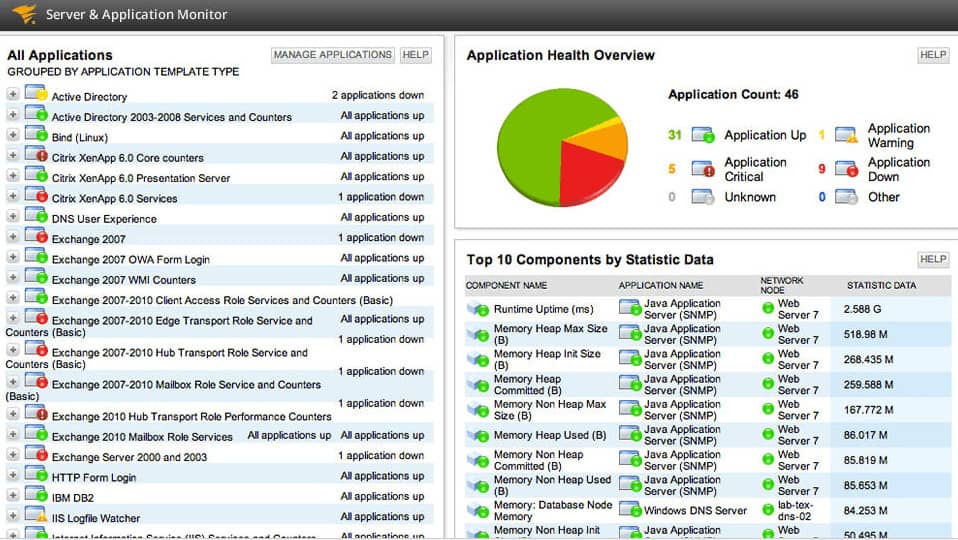
SolarWinds Server & Application Monitor is an application monitoring solution that can be used to monitor Citrix infrastructure. The tool enables you to monitor CPU load, performance counters, services, events and processes for Virtual Apps and Virtual Desktops. All of this information is shown in the form of a list format accompanied by a graph with time period options (1h, 12h, and 24h).
Key Features:
- Application Dependency Insight: Automatically generates a comprehensive map of application dependencies within Citrix infrastructures for better oversight.
- Automated Virtual Discovery: Effortlessly identifies all components of your virtual environment, providing complete visibility.
- VM Movement Tracking: Keeps precise track of virtual machine allocations across hosts, ensuring accurate resource mapping.
- Wide-Ranging Compatibility: Excellently supports a variety of virtualization platforms including Hyper-V, VMware, and Nutanix, in addition to Citrix.
Why do we recommend it?
SolarWinds Server & Application Monitor is a system-wide application and services monitoring package that includes routines for tracking the activity in virtualizations, such as Citrix Xen Server. It simultaneously watches the load on servers from all other applications and provides an overview of activity on all servers in a business.
One of the most appealing features is the out-of-the-box monitoring templates that the program has for Citrix. Performance metrics include CPU entitlement, reservation, shares, usage, IMA network traffic sent/received, active connections, SecureTicketAuthority metrics, ICA session bandwidth metrics, Datastore read/writes, DynamicStore read/write, Encryption ActiveSync service, and end-user experience.
To keep you up-to-date on Citrix performance, SolarWinds Server & Application Monitor offers alerts. The software sends alerts to you by email and SMS if certain performance issues occur. For example, if a session slows to a crawl or an application isn’t available to a user the program sends a notification.
Who is it recommended for?
Large organizations that have many servers in different locations wouldn’t have a hope of teaching them all manually. Complicated systems like virtualizations throw many more variables into the mix and that’s where an extensive system like this SolarWinds helps. The tool is also able to track the capacity and utilization of cloud platforms as well.
Pros:
- Tailored Citrix Monitoring: Features specialized monitoring templates designed for Citrix, capturing crucial metrics like CPU entitlements, active connections, and session bandwidth for thorough analysis.
- Immediate Alert Notifications: Implements an advanced notification system that delivers alerts through email and SMS for prompt action on performance issues.
- Comprehensive Monitoring Scope: Capable of monitoring across multiple virtualization platforms, providing a holistic view of your IT infrastructure’s health.
Cons:
- Complexity for Beginners: The depth and breadth of the platform’s features may present a steep learning curve for those new to sophisticated monitoring tools.
SolarWinds Server & Application Monitor is a reliable product for Citrix monitoring and measuring application performance. The user interface is straightforward and configurable so you can view all the information you need to uphold your services. The software is available from a price of $2,995 (£2,388.21). You can download the 30-day free trial.
6. SysKit Monitor
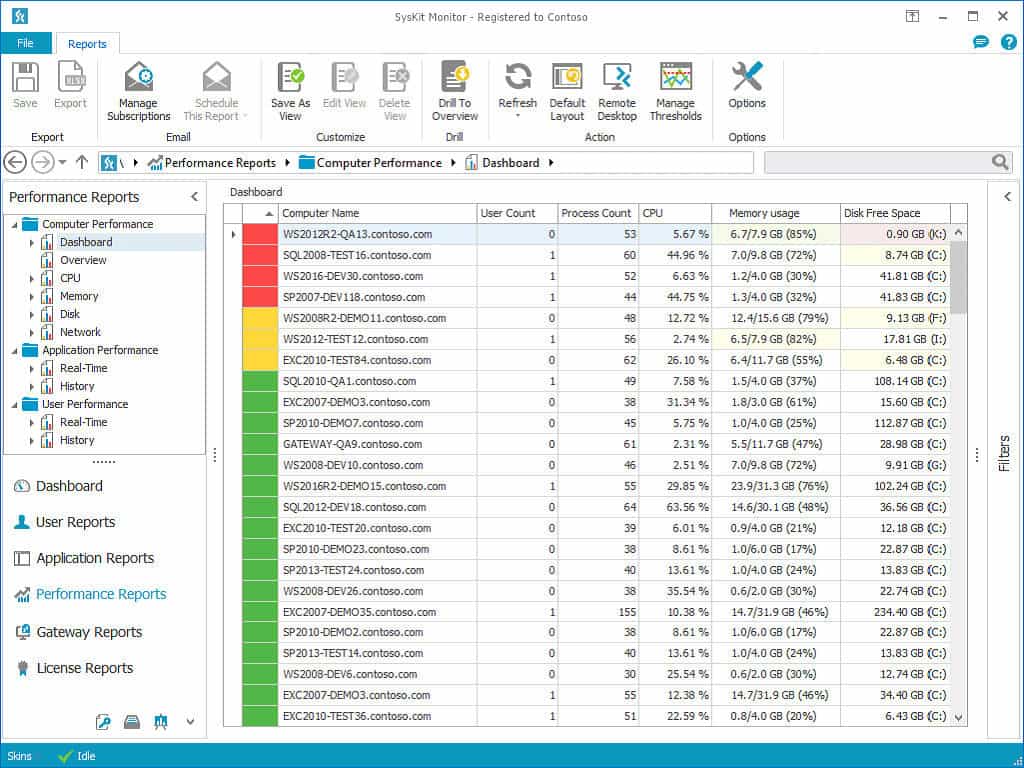
SysKit Monitor is an agentless network monitoring solution. The tool tracks real-time and historic performance. You can also monitor the live experience of end users. You can monitor users activity such as logons and how long they spent during each state of their sessions.
Key Features:
- Agentless Monitoring: Provides comprehensive monitoring capabilities without the need for deploying agents on monitored servers.
- User-Focused Insights: Specializes in monitoring user activities, session durations, and real-time experiences on Citrix Virtual Apps and Desktops.
- Versatile Application Tracking: Capable of monitoring a broad spectrum of applications, with a focus on Microsoft and Citrix technologies.
Why do we recommend it?
SysKit Monitor is an on-premises software package for Windows. This service monitors servers with particular attention to remote access events. The system is able to track activity on Citrix Virtual Apps and Desktop, which is a thin client delivery system for virtual workstations.
Sessions are broken down into three sections; active, idle, and disconnected. The software also monitors for OS, patches, and licenses of components connected to your network. Real-time alerts keep you posted so you won’t miss anything important.
The reporting capabilities of Syskit Monitor are also very flexible. There are user monitoring reports and server auditing reports to show you everything you need to identify performance problems. When you generate a user monitoring reports for Syskit Monitor you can see a session log summary, details of user activity, most active users, a list of IP addresses and clients, and concurrent usage reports.
Who is it recommended for?
SysKit Monitor is concerned with user activity rather than server resource availability. It doesn’t monitor any other virtualization. However, it does record user activity on a number of Microsoft applications and systems, including Windows Server. The software is sold on a permanent license at a reasonable price per server.
Pros:
- Efficient Monitoring Approach: Utilizes an agentless system for seamless and lightweight monitoring across your network.
- Comprehensive User Activity Reports: Offers detailed insights into user behaviors, session states, and application usage, facilitating better management and troubleshooting.
- Historic and Real-Time Data: Delivers both real-time alerts and historical data analysis to provide a complete view of system and user activities.
Cons:
- Interface Design: While functional, the interface’s resemblance to Microsoft Office may feel cluttered or overwhelming when monitoring large-scale environments.
There are three versions of SysKit Monitor available to purchase: the Standard, Professional, and Enterprise versions. The Standard version costs $199 (£158.65) per server and includes agentless monitoring, user activity reports, and application reports.
The Professional version costs $299 (£238.36) per server and adds other features like PowerShell administration and License reports. The Enterprise version costs $449 (£357.94) per server and includes a web application plus performance reports. There is also a 30-day free trial version.
7. ControlUp
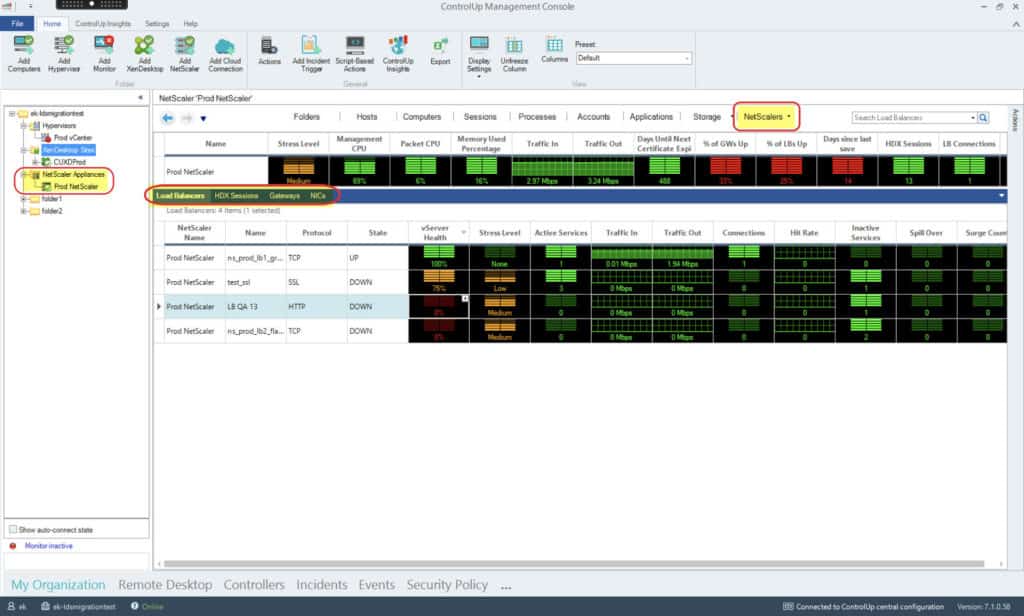
ControlUp is a performance monitoring software tool that identifies issues throughout your Citrix infrastructure. The program delivers transparency from hypervisors right through to individual user sessions. The dashboard shows performance data in real-time. Data shown on the dashboard includes latency, login times, and application launch times, in the form of a table. The table is color-coded so you can see problems at a glance.
Key Features:
- Comprehensive Citrix Insight: Offers complete visibility across the Citrix ecosystem from hypervisors to user sessions.
- Real-Time User Monitoring: Tracks user activities, providing insights into performance metrics like login times.
- Resource Optimization Tools: Equips users with capabilities to address and manage resource shortages effectively.
Why do we recommend it?
ControlUp tracks the delivery of software to employees. The package is available in a version for physical endpoints and another to watch over virtual desktop systems. This is an area in which Citrix excels and so the ControlUp service monitors Citrix Virtual Apps and Desktops, Citrix Cloud, and Citrix ADC as well as Citrix Xen.
Once an issue has been found there are a number of actions the user can take to address it. For example, the user can select the ‘Kill Policy’ option to remove group policy restrictions and enable configurations to be changed at a much faster rate than before (particularly useful when responding to performance troubles).
A distinct advantage of this product compared to many others on the market is that it can monitor multiple Citrix apps and desktops. The software supports all Citrix Virtual Apps, and Desktop versions so that you can manage your entire virtual infrastructure from one location.
Who is it recommended for?
This is a SaaS package and it is available in three editions. ControlUp doesn’t publish a price list, so it is difficult to judge whether it is affordable for small businesses. However, mid-sized and large organizations that use virtual desktop systems will benefit from using this tool.
Pros:
- Agentless Monitoring Advantage: Utilizes an agentless approach for efficient, lightweight monitoring of Citrix environments.
- In-depth Citrix Analytics: Delivers both real-time and historical data, enhancing visibility into Citrix infrastructure performance.
- User-Centric Metrics: Displays detailed user metrics, aiding in the management of resource consumption and session activities.
Cons:
- Complex Interface: The interface mimics Microsoft Office, leading to a cluttered experience during extensive monitoring operations.
- Varied Data Retention: Offers different data retention periods across its tiers, necessitating direct contact for pricing and details.
There are three versions of ControlUp available to purchase: the Pro, Enterprise, and Platinum versions. The Pro version has one-day data retention, the enterprise version has one month, and the platinum version has one year. You need to contact the company directly to view a quote. You can download a free trial.
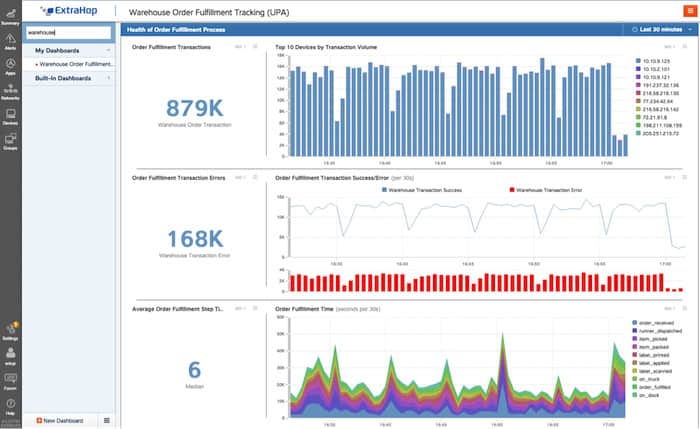
8. ExtraHop
ExtraHop is an application performance monitoring platform that has support for monitoring Citrix infrastructure. The ExtraHop Citrix ICA Module provides visibility for Virtual Desktops and Virtual Apps, and displays ICA and CGP transactions in real-time. The Citrix ICA module comes configured out-of-the-box. Metrics are broken down into user, session, and client type. From this module, you can monitor for issues like slow logins and long loading times.
Key Features:
- Citrix Infrastructure Monitoring: Provides comprehensive monitoring capabilities for Citrix environments, including user and session data.
- ICA Module: Offers out-of-the-box support for virtual desktop and app visibility through the Citrix ICA module.
- Root Cause Analysis: Aids in pinpointing the root causes of virtual machine issues, enhancing problem resolution.
Why do we recommend it?
ExtraHop Reveal(x) is a cloud-based XDR that protects user workstations from attack. In that task, the package is able to account for virtual desktop systems and that includes Citrix services. As it monitors activity on networks, endpoints, and cloud platforms, this tool simultaneously provides performance monitoring.
It is worth noting that you can also monitor bandwidth with the ExtraHop Citrix ICA Module as well. The module shows bandwidth activity by the application so that you can see any bandwidth hogs in your virtual infrastructure. You also have an alerts system that notifies you when anomalous behavior is recognized.
Who is it recommended for?
ExtraHop is designed to cater to hybrid systems and it takes issues such as virtualization in its stride. The package XenApp and XenDesktop (Citrix Apps and Desktops) and the Citrix Cloud service. It can also monitor Citrix ADC (NetScaler). So, this is a necessary tool for both performance and security monitoring in a virtualized environment.
Pros:
- Dedicated Citrix Module: Features a specialized Citrix ICA module for tailored monitoring of virtual desktops and apps.
- Intuitive UI: Boasts a user-friendly interface with a dark mode option for improved visibility.
- Network Issue Detection: Automatically identifies and helps correlate network problems for quicker resolution.
Cons:
- Opaque Pricing: Requires direct inquiry for pricing information, lacking upfront cost transparency.
- Complex Web Management: The web-based management console could benefit from enhancements for better intuitiveness.
- Steep Learning Curve: The process of filtering traffic can be challenging to master, requiring a significant learning investment.
The top-down perspective gained from using ExtraHop is excellent for diving straight to the root of performance problems. If one application is experiencing difficulties, you’ll be able to find it and start troubleshooting. To view the price for ExtraHop you will have to contact the company directly. A free trial is also available for download.
9. Goliath Performance Monitor
Goliath Performance Monitor is a network monitoring tool that can monitor Citrix servers and applications. The tool has been designed to provide end-to-end visibility of virtualized infrastructure right down to end-user experience.
Key Features:
- Network Utilization Insight: Excels in tracking network usage to optimize performance across Citrix servers and applications.
- Xen Resource Monitoring: Keeps a vigilant eye on XenServer resource consumption, identifying heavy users.
- Resource Consumption Analysis: Pinpoints significant resource consumers, facilitating targeted optimizations.
Why do we recommend it?
Goliath Performance Monitor is concerned with the successful delivery of applications across a network. The system also applies to applications that are delivered from the cloud or packaged in virtual desktops. The monitor works from measuring availability and delivery times and works backwards to identify any causes of poor performance.
For example, you can monitor End User Experience data such as Session start/end, ICA/RTT, Bandwidth, Packet loss, Network latency, ICA channel metrics, Logon duration, and availability. For applications, you can monitor processes per session, app performance, CPU, memory, IOPS, throughput, application availability, and more.
The program also has an intelligent alerts system. Alerts work on a threshold basis and are triggered once certain trigger conditions are met. For further analysis, you can use the advanced reporting and analytics module that includes 66 reports out-of-the-box. For example, you can generate a graph that displays the Average Time for parts of the Logon throughout Virtual Apps services.
Who is it recommended for?
The more virtualized your system is, the more you will need this package. Although virtualization creates efficient use of hardware, it also creates an extra layer of complication. You don’t just need to make sure that your servers and networks are working efficiently, you also need to check on your virtual environment.
Pros:
- Comprehensive Monitoring: Delivers a holistic view from the network to the end-user experience, ensuring application delivery is optimal.
- Smart Alert System: Employs threshold-based alerts to proactively manage system health and minimize unnecessary notifications.
- Detailed Virtual App Tracking: Monitors virtual app services, capturing fluctuations and performance metrics over time with precision.
- Flexible Licensing: Offers a variety of licensing options to accommodate different organizational needs and scales.
Cons:
- Complex Interface: The dashboard’s complexity can be daunting, with a need for more graphical elements to enhance readability.
- Limited Application Integration: The current scope of application integrations is narrow, necessitating expansion for broader utility.
- Customization Restrictions: File monitoring within Citrix environments could benefit from more adaptable customization features.
Goliath Performance Monitor is available in a number of pricing options such as: perpetual license, subscription, enterprise license agreements, and OEM options. You can download a 30-day free trial.
Choosing a Citrix monitoring tool
Software like Paessler PRTG Network Monitor concentrates on a monitoring experience that keeps things simple for smaller enterprises.
Other tools like Dynatrace concentrate on increasing the visibility of performance issues and diagnosing the root cause of server or application problems. If you want the most responsive service then Dynatrace is probably your best bet on account of its automatic updates which keep you up-to-date.
Citrix Monitoring FAQs
Can Citrix track activity?
Citrix records session details for each system user. However, this information is not organized well. Many businesses prefer to use a third-party tool to manage connection status information into more digestible user activity reports.
What can Citrix track?
The native monitoring console of Citrix is called Citric Director. It shows live data on a number of factors. These include real user logons and session times, session statuses, connection failures, application failures, and server resources.
What type of tool is Citrix?
Citrix is a company that offers virtualization systems. These split up the resources of a server and create individual virtual machines that can be accessed as though they were independent computers. Citrix first marketed its system as a way to distribute cheaper “dumb terminals,” also known as “thin clients,” to company desks, leaving all processing power centralized. This improves security and reduces costs.


