Network discovery systems implement protocols that play a pivotal role in managing modern networks by facilitating the identification and interaction of devices within a network. These protocols enable devices to share critical information about themselves, such as their type, configuration, and connectivity status, promoting efficient network management, troubleshooting, and security.
Network discovery protocols are communication protocols that operate at various layers of the OSI model to identify and describe devices in a network. They automatically gather information about network-connected devices, including routers, switches, servers, and endpoints. This information helps administrators monitor, configure, and optimize the network’s performance.
Key Examples:
- Cisco Discovery Protocol (CDP): A proprietary Layer 2 protocol used in Cisco networks to exchange device information such as names, IP addresses, and interfaces. It simplifies troubleshooting and topology mapping.
- Link Layer Discovery Protocol (LLDP): A vendor-neutral Layer 2 protocol standardized by IEEE 802.1AB, used to discover neighboring devices and provide similar capabilities as CDP across multi-vendor environments.
- Simple Network Management Protocol (SNMP): While not strictly a discovery protocol, SNMP can gather detailed device information, assisting in network inventory and monitoring.
- Neighbor Discovery Protocol (NDP): Used in IPv6 networks, NDP facilitates device discovery, address autoconfiguration, and route advertisement.
Network discovery is the fundamental element of automated network monitoring and management packages. The services that network discovery provides include:
- Network Visibility: Provide real-time insights into device connectivity and relationships.
- Troubleshooting: Simplify the identification of misconfigurations or connectivity issues.
- Automation: Enable automated network mapping and inventory management.
When using discovery tools, ensure proper configuration and security measures, such as disabling unused protocols and encrypting sensitive data. By leveraging these concepts effectively, network administrators can maintain efficient and secure networks.
Here is our list of the best network discovery tools:
- Datadog Network Performance Monitoring EDITOR’S CHOICE Discover, map, and track network activity from your endpoints through to services wherever they may be with this cloud-based system. Watch over LANs and the links across the internet that connect remote users to your sites and your office workers to cloud services. Start the 14-day free trial.
- Faddom (FREE TRIAL) A hybrid discovery and mapping service for applications and IT assets both on premise and in the cloud that includes a mapping function. Runs on site as a virtual appliance. Start a free trial.
- Atera (FREE TRIAL) This cloud system is a remote monitoring and management package that has a network discovery feature to set up network asset management. Access a 30-day free trial.
- ManageEngine OpManager (FREE TRIAL) This tool can be installed on Linux or Windows, it has some great mapping options that feed off autodiscovery data. Start a 30-day free trial.
- Site24x7 Network Monitor (FREE TRIAL) A cloud-based service that is integrated into Site24x7 system monitoring packages. Start a 30-day free trial.
- Paessler PRTG Network Monitor (FREE TRIAL) PRTG monitors servers and applications as well as networks; it uses SNMP to map networks and track changes. Start a 30-day free trial.
- Nagios XI Has its own network monitoring protocol which aids in network discovery.
- SolarWinds Network Performance Monitor Offers automatic discovery and mapping of networks, including remote sites, cloud-based services, and WiFi systems.
- Cacti SNMP-driven network monitoring system that includes an autodiscovery phase; it installs on Unix, Linux, and Windows and is free to use.
- Zenmap A basic frontend to the NMap network discovery and monitoring tool.
- Spiceworks Ad-supported SNMP-based network monitoring software that includes an auto-discovery function.
- NetBrain Cloud-based paid service with a 14-day free trial, this network monitor includes autodiscovery features and some great mapping options.
- Intermapper Specialist network mapping tool for Windows, Linux, and Mac OS creates the layout of your current network after it searches via SNMP.
Key features typically include; device discovery, device profiling, IP address management, service and port scanning as well as network topology mapping.
There are a wealth of tools on the market and they vary in their capabilities, complexity, and deployment options, catering to different network environments and requirements. Some are standalone, others part of a broader network monitoring suite.
The Best Network Discovery Tools and Software
Our methodology for selecting network discovery tools
We reviewed the market for network discovery software and analyzed the options based on the following criteria:
- An autodiscovery function that runs constantly or on-demand
- The ability to compile a network asset inventory detailing make, model, and firmware version
- A dashboard screen that gives access to details about each discovered device
- Details on how devices are linked together
- A network topology mapper
- A free trial or a money-back guarantee that creates a no-cost assessment period
- Value for money represented by a package that will save time and money
This list includes an updated list of select tools, so you should be able to find the network discovery software that is right for you by reading through our selection.
1. Datadog Network Performance Monitoring (FREE TRIAL)
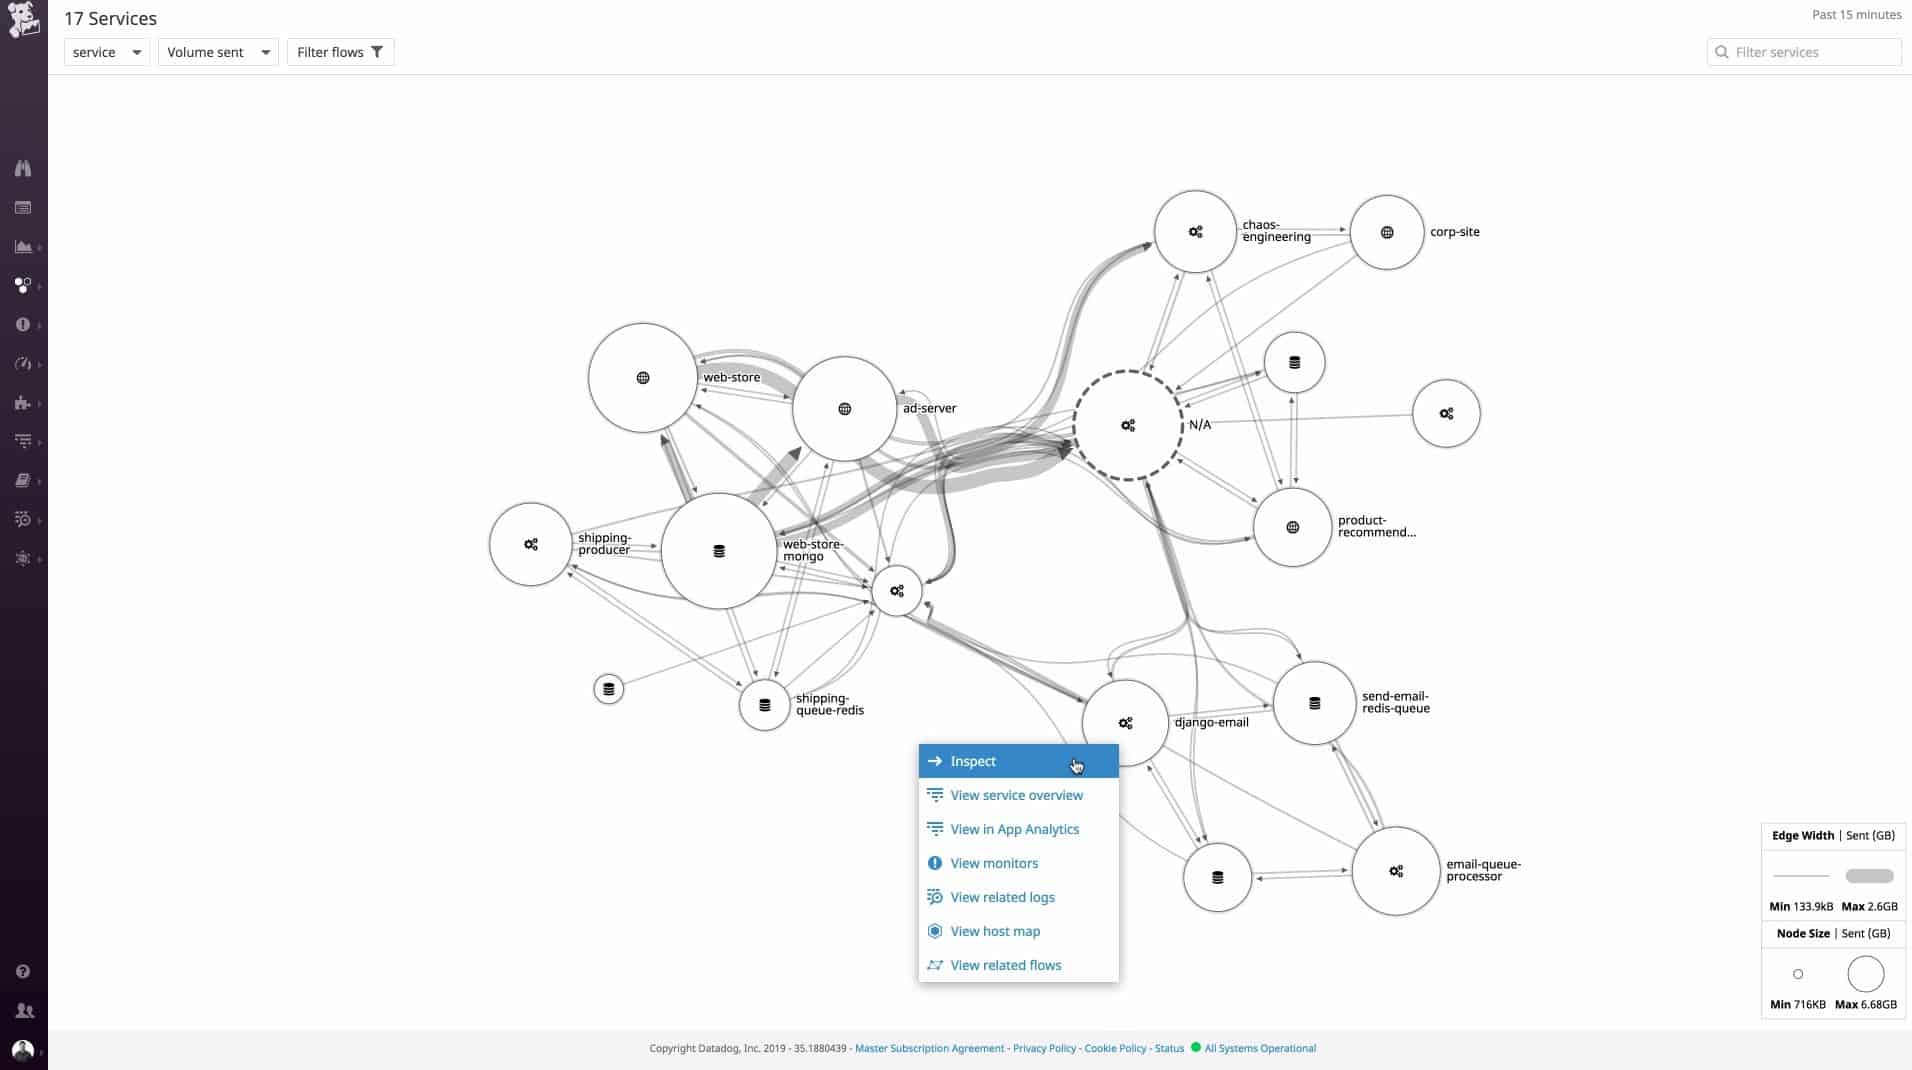
Datadog Network Performance Monitoring includes a network discovery feature that tracks down all devices connected to the network, logs them in an inventory, and depicts all of the links between them. This is a cloud-based service and so it isn’t necessary to install any software anywhere on site other than an agent program. The agent gathers information and sends it to the Datadog server where all processing occurs.
Key Features:
- Cloud-based system: A SaaS platform
- Network traffic analysis: Identifies traffic patterns
- Network mapping: A visual depiction of network devices and links
- Capacity planning tool: Analyze current and past throughput to work out capacity requirements
- Alerts for traffic anomalies: Get notified about traffic surges or absences
Why do we recommend it?
The Datadog Network Monitoring package is a cloud-based system that is offered as a SaaS package. The tool is able to explore a network through the installation of an agent on the sited that is to be monitored. The agent then continually scans the network and uploads details of all devices and their connections to the Datadog server.
The console of the service is accessed through any browser. Being a cloud-based service, the Datadog Network Performance Monitoring module can map local and remote networks and also include internet connections to cloud-based resources.
The network view enables the user to change perspective, selecting to see a single device and all of the connections to it, a complete view of the network, or a focus on the links that run between to endpoints.
The network map is live so it gets redrawn if any devices are moved, added, or removed. The network topology map is interactive and acts as an interface through to details on each device.
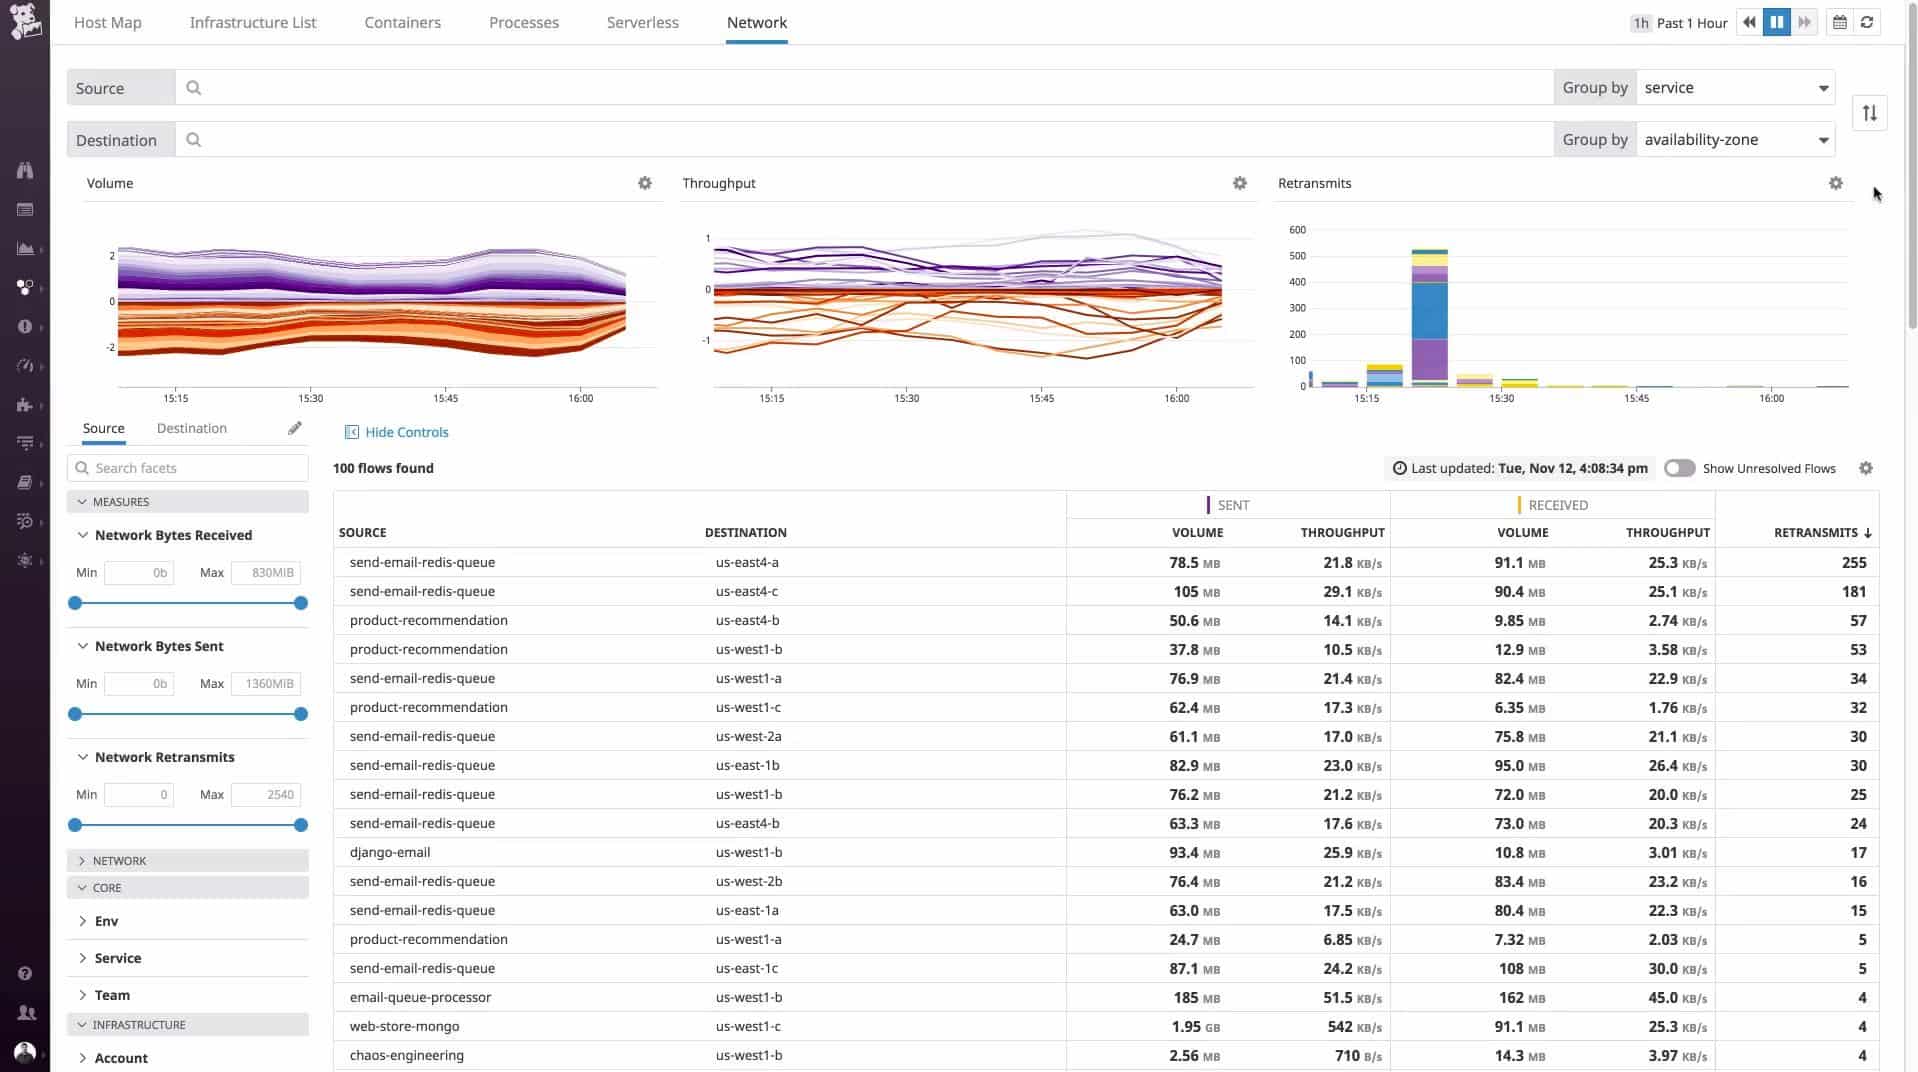
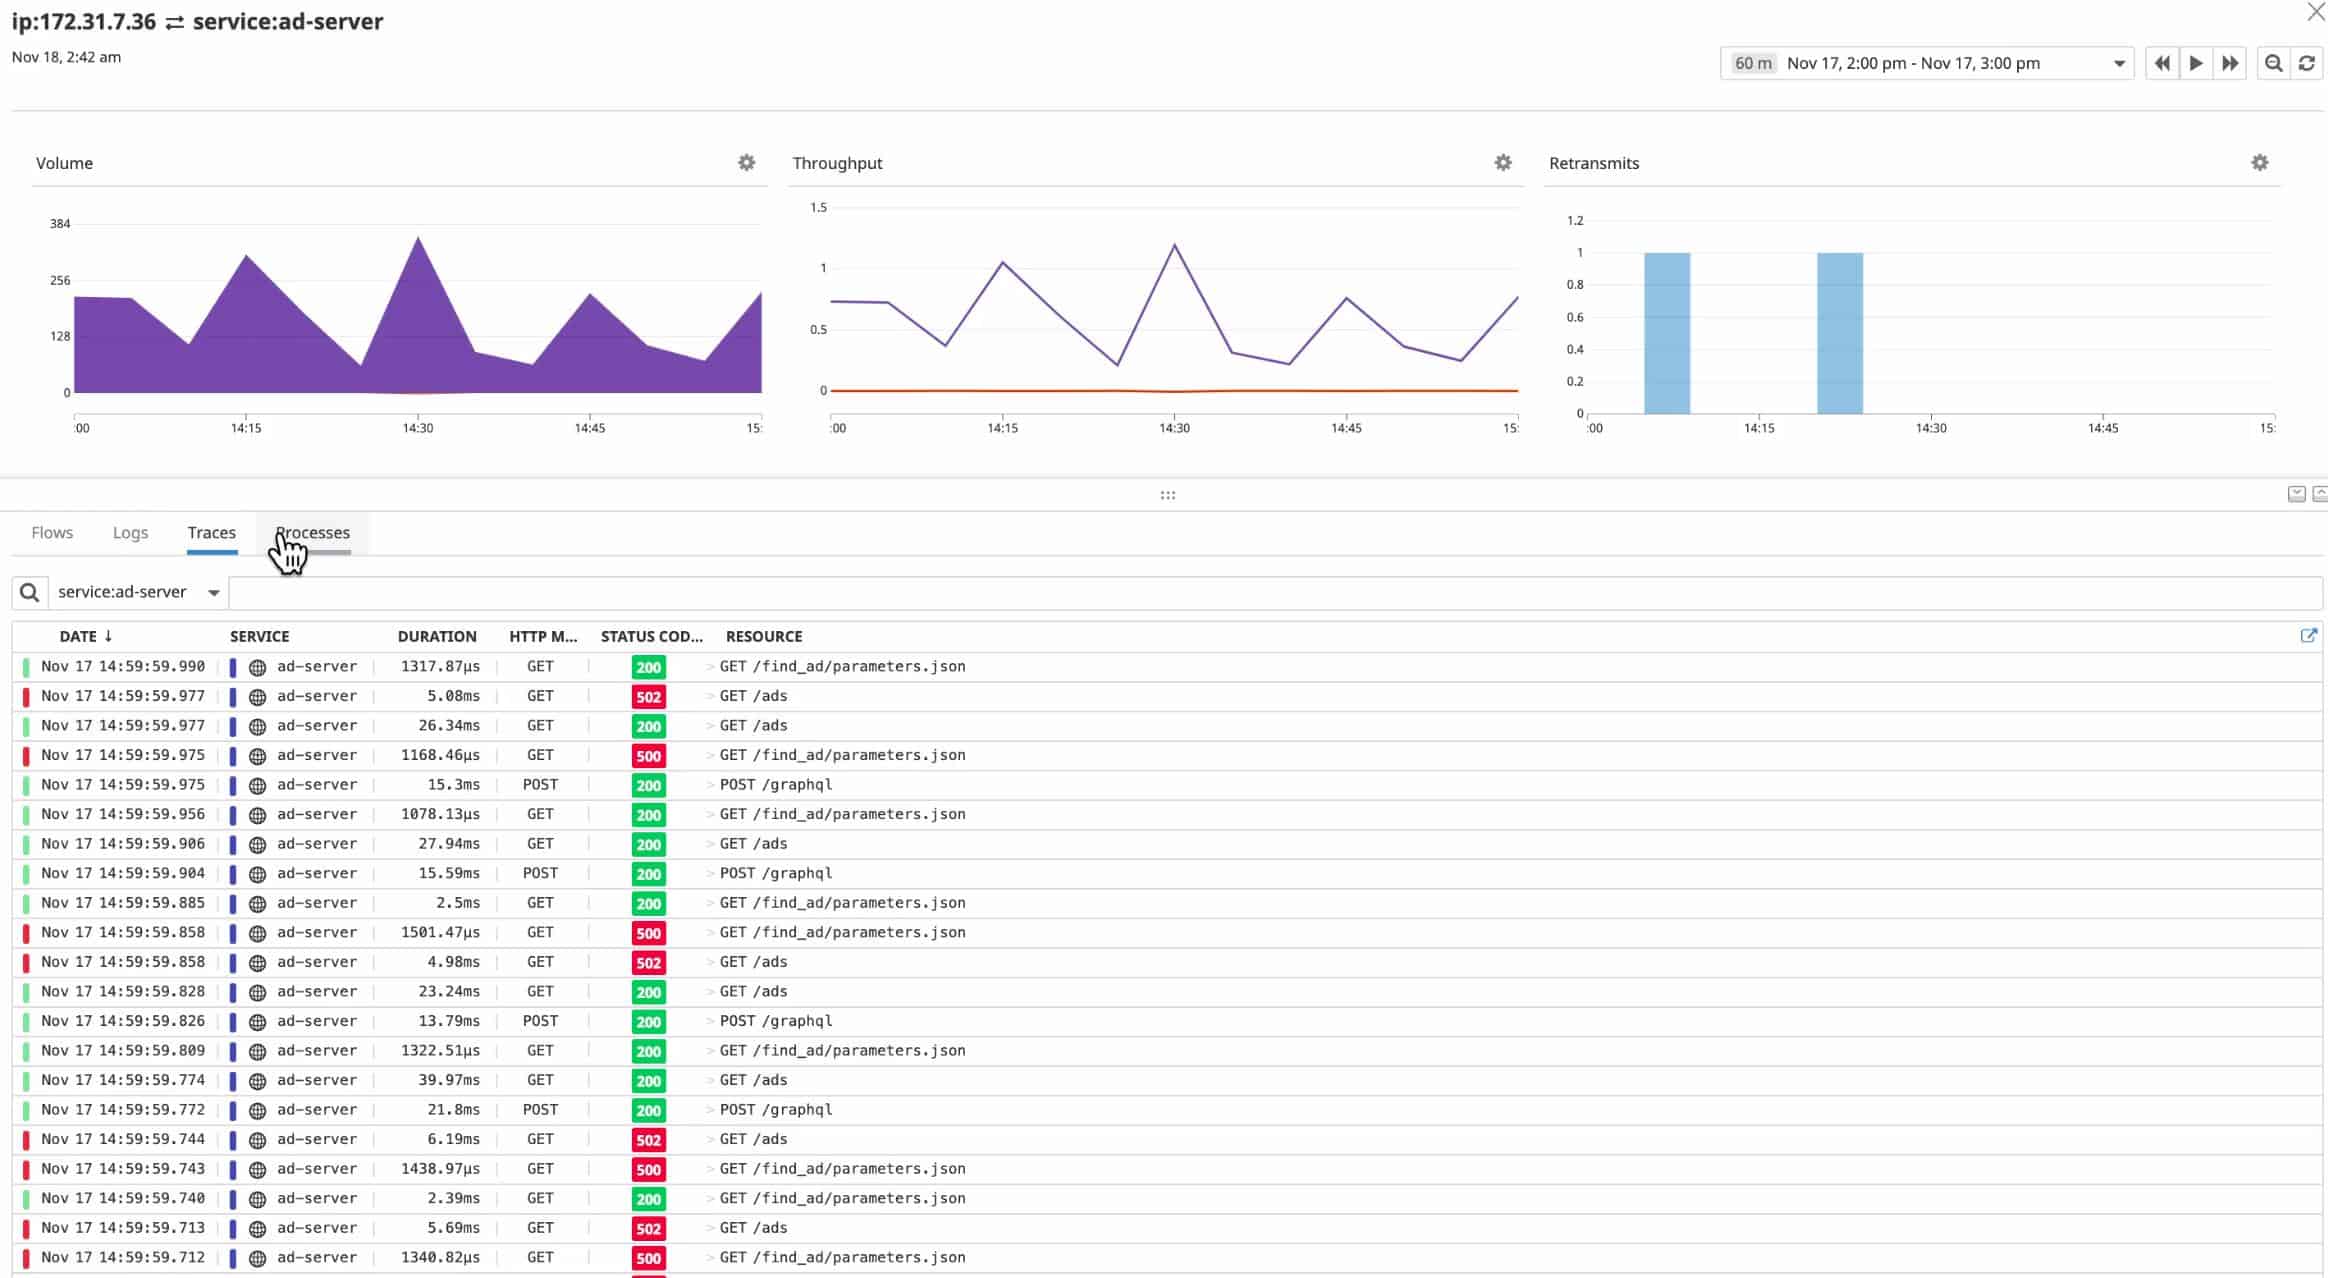
The data flows traveling around the network and through each device are also shown on the network map. An examination of a specific device offers details on the data throughput of that piece of equipment and status reports on its performance, shown both in graphical format and as event lists.
Traffic views shown on the network map can be segmented by application, or by endpoint, so it is possible to work out which devices or applications are generating the most traffic. The tool has other options that include the ability to analyze traffic patterns and see where devices and links get overloaded. This is a great tool for capacity planning and forecasting.
Who is it recommended for?
The Datadog system provides a hardware asset inventory, which is necessary for any business. The package also creates a network map and provides traffic monitoring. The Network Performance Monitoring service is charged for at a rate per device per month, which means that businesses of all sizes can afford the subscription.
Pros:
- Part of a platform of tools: Add on Network Device Monitoring and Infrastructure for full network monitoring
- Looks for overloaded devices: Shows when you need to replan the network
- Identifies underutilized equipment: PRovides ideas on how investment can be directed more beneficially
- Includes cloud traffic management: See cross-region movements and traffic costs
- Checks on DNS performance: Continuously monitors DNS server availability, response times, and accuracy
Cons:
- Needs Infrastructure Monitoring: The discovery routine is actually provided by Datadog Infrastructure Monitoring
The Network Performance Monitoring module of Datadog is charged for on a subscription basis with a rate per host per month and also a cheaper annual rate per host. However, whichever payment cycle is chosen, the whole time period has to be paid upfront. Datadog offers a 14-day free trial of the Network Performance Monitoring module.
EDITOR'S CHOICE
Datadog Network Performance Monitoring is our top choice for a network discovery tool because it addresses the needs of contemporary systems that many traditional network monitors ignore. This is a monitoring service that is able to cope with the complexities of virtual networks and multi-site, hybrid networks because it includes internet links in its traffic monitoring services. Identify faulty links and implement traffic shaping to relieve overloaded equipment on your network with this cloud-based network monitoring service. Add on other modules, such as Network Device Monitoring and an APM to extend the capabilities of this network performance monitor.
Download: Access 14-day FREE Trial
Official Site: https://www.datadoghq.com/product/network-monitoring/network-performance-monitoring/
OS: Cloud-based
2. Faddom (FREE TRIAL)
Faddom is a hybrid on-premises package that can be used to discover, document, and map IT assets both on premise and in the cloud. That remit extends to software, digital infrastructure, physical hardware, and virtual systems. The flexible package can be used by consultants, new on a site, who need to find out exactly what the client is operating in its offices and on the cloud.
Key Features:
- Network discovery: Generates a network inventory
- Network mapping: This is the core service of the platform
- Security service: Highlights anomalous traffic
- Supports microsegmentation: See network layout and traffic flows to plan ACLs
Why do we recommend it?
Faddom is an IT asset mapping system and that relies on a network and application discovery process. The tool is based in the cloud and can track down applications no matter where they are running. The network mapping tool supports security segmentation and capacity planning. The platform also provides other IT asset documentation and management services.
Other use cases include an IT asset tracking service for managed service providers, both for contract creation and for ongoing operations. IT departments can also use the system to log assets and watch over them. Also, to track the movement of systems from one environment, such as site to cloud, in any migration project.
Faddom is also useful for development teams that need to establish that their supporting infrastructure is in place. One more scenario that would be suitable is the support for development analysts that are hoping to re-plan a software package to move it into microservices.
The on-site deployment method is reassuring for many system managers who worry about the lack of security that is engendered by using cloud services. In truth, widely used cloud platforms, such as Azure, AWS, and Google Cloud Platform are safe and secure, and being able to use Faddom to identify all of the services in use can help a system administrator choose a cloud workload protection system to make their own software hardened against attack.

The Faddom tool will search through your network and log each network device and all of the endpoints on the system. Each device gets a details page in the Faddom console, which documents their identifiers and factors such as make, model, and age. The service will also list all software on each device and that record is useful for a license management strategy.
Mobile apps and Web assets can be difficult to track because they are constructed with development environments that provide functionality. Many standard features in any Web page are also supplied by plug-ins and APIs. Those lines of code in a Web page call larger routines that are hosted elsewhere – but you don’t know where.
Tracking Web designs is made more complicated by the fact that services that you call in can themselves rely on third-party function libraries that the developers of those plug-ins know nothing about.
Faddom hacks through the undergrowth in the Web application jungle and allows you a way to monitor the operations of these supporting services, choose to replace them, or find ways to secure them.
Who is it recommended for?
Faddom is a great tool for asset management and it can help you get a full inventory of your equipment. However, unlike Atera and Datadog, this package doesn’t provide you with live monitoring. Despite not having all of the features of those two rivals, Faddom is the most expensive of the three.
Pros:
- Monitors SSL certificates: Ensures that your certificates don’t expire
- Discovers applications: Can cross sites and platforms to log the services that you use
- Application dependencies: Creates an application dependency map
- A cloud-based service: This is a SaaS package
Cons:
- On-premises only: No cloud-based version
Faddom installs on its own custom VM, which means that it will run on any operating system. Register for a free trial.
3. Atera (FREE TRIAL)
Atera is a remote monitoring and management package that also provides team and task management systems. This service is hosted in the cloud and your technicians access the system dashboard through any standard Web browser. The Network Discovery service is an add-on package for any of the eight plans offered by Atera.
Key Features:
- Network discovery available: As an add-on feature
- Automated network monitoring: Watches device statuses
- Software management: Maintains a list of software on a site
Why do we recommend it?
The network discovery feature of Atera quickly sets up the asset inventory for a site and automates onboarding. This is particularly important for a managed service provider because automated processes such as this saves time and squeezes value for money from expensive human resources.
The network discovery scan creates an asset inventory, which eases the process of automated monitoring. The inventory provides information on the device plus its addresses and information about its ports. Scan recur continuously, so any changes in each device are spotted straight away.
If a device is added to or removed from the monitored network, the rescan will recognize that system alteration by updating the asset inventory. Having a precise count of all of the assets on a site assists with billing because managers can show precisely how many devices are being supported.
The network discovery system will also identify rogue devices connected to the network. This raises an issue that would need to be raised with the site – Atera supports remote monitoring, so technicians are not expected to be in the same location as the network that is being monitored.
Each scan will assess the status of network devices and endpoints. This tool will raise an alert if one piece of equipment is experiencing problems. These alerts mean that system monitoring is automated and doesn’t require technicians to constantly keep an eye on the monitoring console. They will be able to assume that everything is working well unless they receive an alert.
The full Atera package includes a ticketing system that gives users a channel to report problems or ask for assistance. The user portal is white labeled, so it can be branded. The service feeds through to an automated ticket routing system that feeds tasks to technician team members. The technician dashboard lists open tasks and enables the support operative to close issues.
A manager dashboard gives an overview of each technician’s workload. The processing of tickets also automatically generates timesheets for billing. The management functions of Atera are different according to the version that is in use. There are two versions available: one for managed service providers and one for IT departments. While the RMM tools in each version are the same, the management functions differ. Each of the two versions of Atera offers four plans. These offer different bundles of services for progressively higher fees. The Atera cloud platform is charged for on a subscription with a rate per technician.
Who is it recommended for?
The two versions of Atera give it a very wide audience. It can be used by an in-house tech support team or by a managed service provider. The per-technician pricing of Atera plans makes it suitable for businesses and managed service providers of all sizes. Even a solo technician could use the system.
Pros:
- Monitor multiple sites: A multi-tenant architecture enables managed service providers to support multiple clients
- Versions for IT departments and MSPs: Different types of services have different software requirements
- Ticketing system included: Provides team and task management as well as a channel for users to request assistance
Cons:
- Network discovery costs extra: This isn’t part of any plan and has to be selected as an add-on service
As it is based in the cloud, the system can be used by technicians located anywhere to monitor networks anywhere in the world. The team doesn’t even need to be sitting in the same office, so a tech support team can include remote workers or be split into different operations centers around the globe to provide round-the-clock support. Get Started with a 30-day free trial.
4. ManageEngine OpManager (FREE TRIAL)
ManageEngine OpManager is an extensive network management system that includes an autodiscovery function. The system performs a network discovery scan of your network for devices during the installation phase, and then keeps rechecking all equipment constantly. The links between each piece of equipment enable OpManager to build network maps.
Key Features:
- Discovers network devices and endpoints: Automatic network scanning
- Creates a network inventory: Constantly rechecks and updates for changes
- Network topology mapping: Network layout building plans, cabinet rack view
Why do we recommend it?
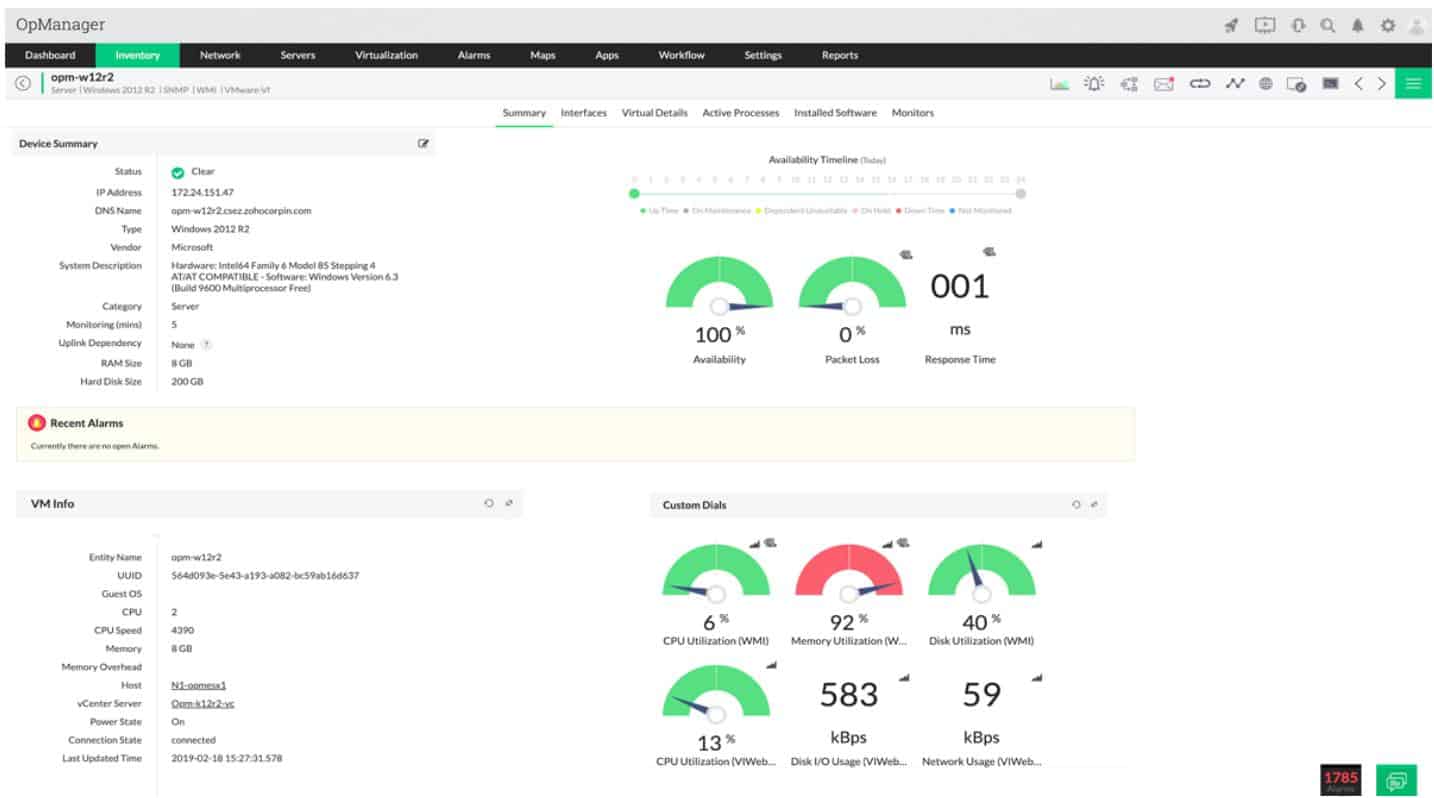
ManageEngine OpManager offers both network and server monitoring. The tool includes a discovery service that documents all devices connected to the network and how they link together. The package creates a hardware inventory from that information and also draws up a topology map. All of this documentation is kept up to date.
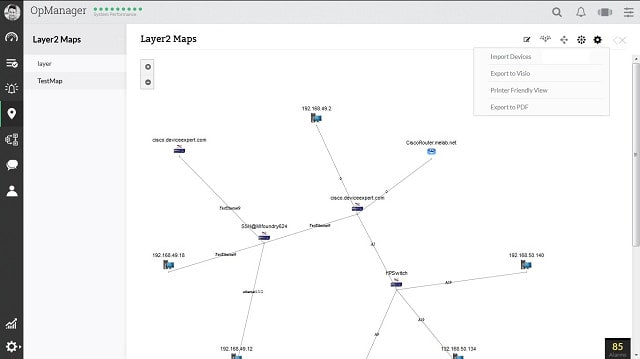
The maps can be displayed in a range of formats. These include a straightforward Layer 2 map that shows all equipment with straight lines representing the links between them. You can also get OpManager to display a 3D view of your premises, showing the location of each piece of equipment. If you have in-house servers held in racks, you can also get the OpManager interface to show you the position of your servers in the cabinet. Finally, you can switch to a world view that shows an actual geographical map with all of the sites of your business connected together. Although the links drawn on that map do not accurately represent the complexity of all of the internet topology between your sites, it does display performance metrics that represent the average speed of the links between your sites.
OpManager continuously monitors your network equipment, using the Simple Network Management Protocol (SNMP) methodology. This system allows for device agents to report alert conditions back to the controller so you will keep abreast of the statuses of all of your network devices. This constant monitoring catches any changes in the inventory of your network, and it will update the network maps automatically.
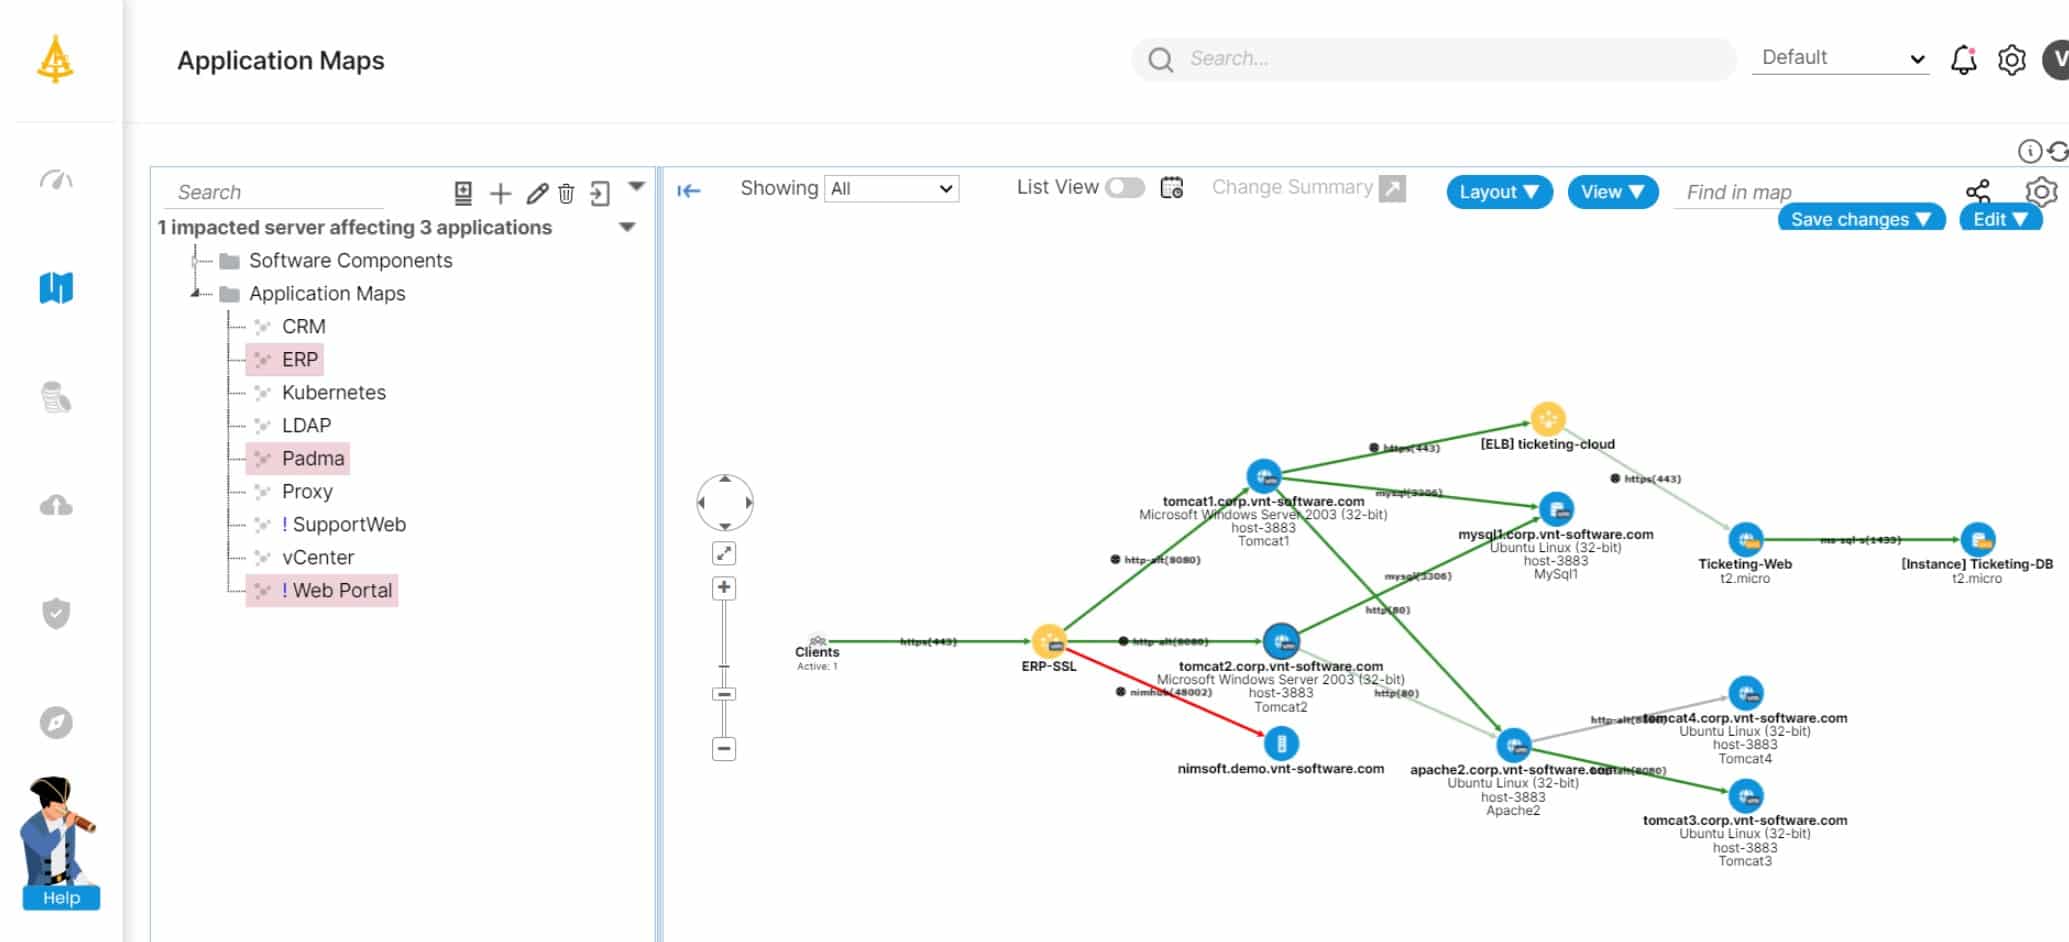
OpManager includes a network mapping tool, which enables you to create your own custom maps of your network. The network monitor locates the devices for you and then you can change the representation of the layout to be more compliant with your company’s graphical design standards.
The network monitor can manage virtual environments and it will map those for you. It is also able to track VoIP traffic running over the data network, and it can integrate WiFi routers and Cloud-based servers into your network map. OpManager includes network traffic analysis, and you can get traffic flow information both link by link and end-to-end depicted on your network maps.
Who is it recommended for?
This package is a major rival to the SolarWinds Network Performance Manager, PRTG, and Datadog. It is a stablemate of Site24x7. It has a good position in the marketplace because the software can run on Windows Server and Linux and it can also be installed on an AWS or Azure account.
Pros:
- Scans repeat: Updates the network inventory and topology map
- Constant device status monitoring: Alerts for component failure
- Troubleshooting tools: Ping and Traceroute
Cons:
- No SaaS version: Although the package is available as a service on AWS and Azure as well as software for Windows Server and Linux
OpManager is available for Linux and Windows environments. There is a free version of the system, which will allow you to manage up to three devices. You can use the free version to get to know the system, using it as a free trial before you commit to buying the full system. Then, depending on the size of your network, you could upgrade to the Standard, Professional, or Enterprise editions – starting from $245 for 10 devices, $345 for 10 devices, or $11,545 for 250 devices respectively.
5. Site24x7 Network Monitor (FREE TRIAL)
Site24x7 is an infrastructure monitoring platform that offers a list of specialized tools. The Network Monitor is integrated into all of the system management packages offered by the service.
The Network Monitor has two elements: a device monitoring tool and a traffic analyzer. The network device monitor is based on SNMP. This strategy has the advantage of locating all of the devices on a network through a status report request. The Site24x7 system acts as the SNMP manager, sending out a request every minute as a broadcast. Any device out on the network will have an SNMP agent installed on it that listens for a request.
Key Features:
- A cloud platform: This is a SaaS package
- Network discovery: Documents endpoints and network devices
- Network device monitoring: Status checks on switches and routers
Why do we recommend it?
The Site24x7 Network Monitor implements both network traffic analysis and network device monitoring from its cloud platform. The basis for these two services is an autodiscovery system that creates a network inventory and a topology map. You also get server and application monitors with this SaaS package.
SNMP agents send status reports in response to the Site24x7 request. The Site24x7 system involves an agent that is a data collector installed on the monitored system. This collects the SNMP responses and uploads them to the Site24x7 server over encrypted connections for processing.
The collection of responses tells the Site24x7 server exactly what devices are out there on the network and how they are connected. This is the autodiscovery feature in the system and it will replay every time an SNMP request broadcast is performed.
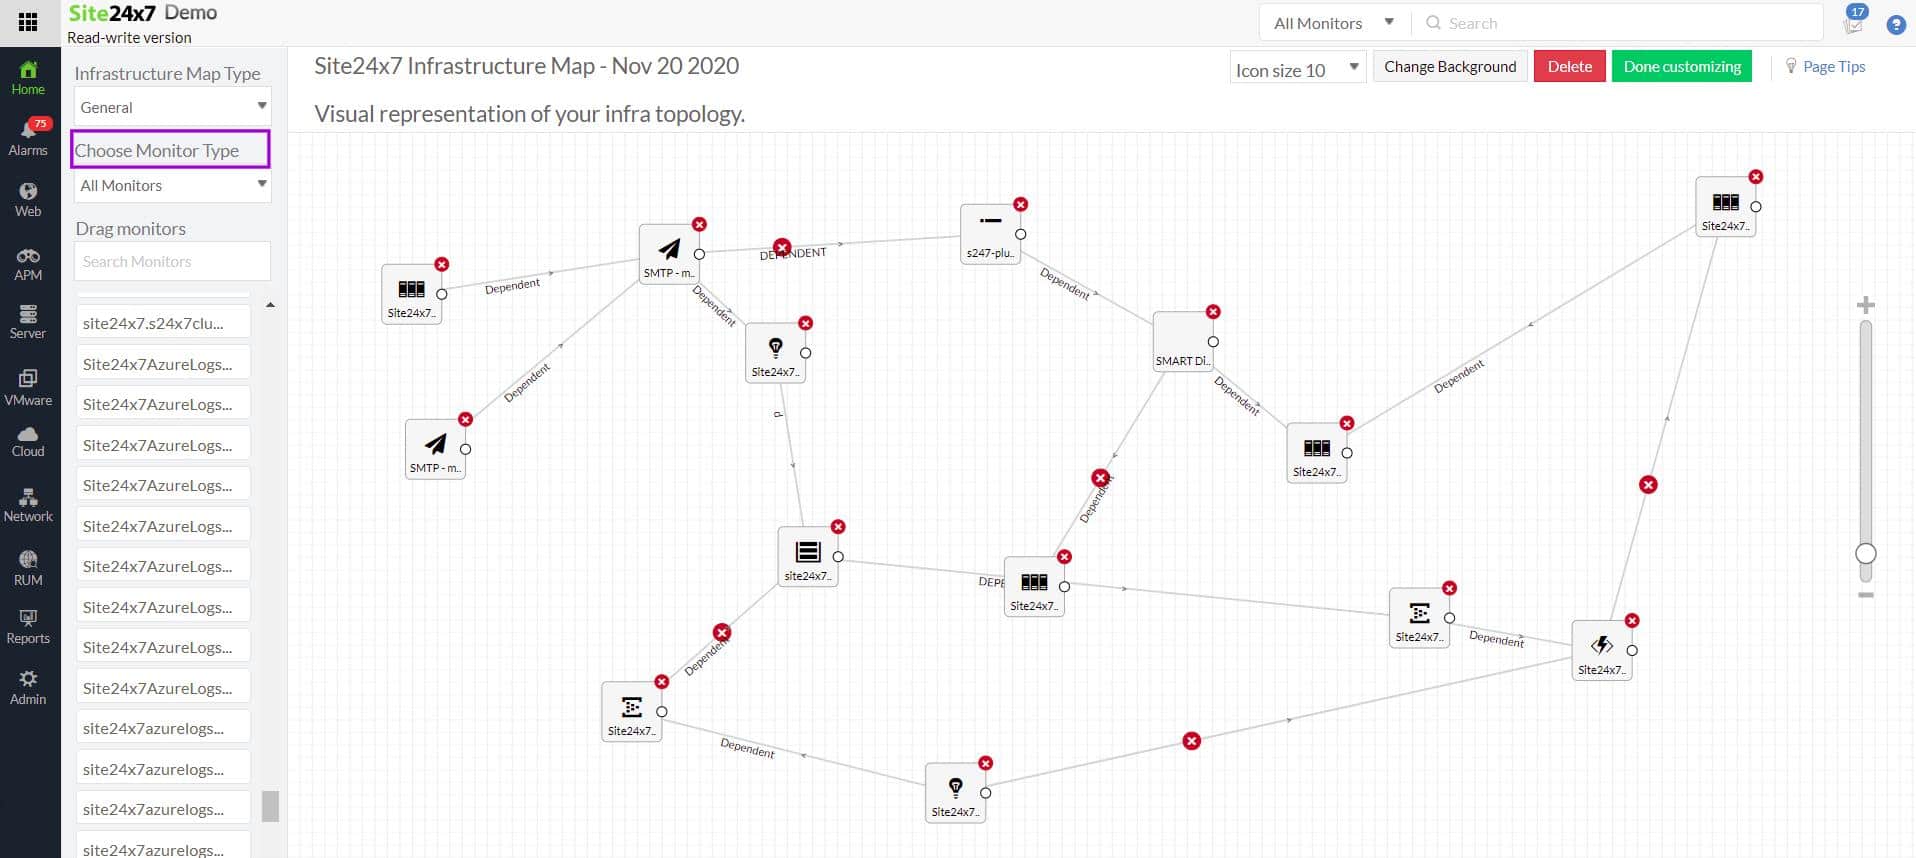
The responses from device agents get written up into a network inventory. The Site24x7 network monitor has a network topology mapper, which instantly creates a map of the network from the network inventory whenever it is accessed. So, the topology map is always up to date.
The other component of the Network Monitor is its traffic analyzer. This works through NetFlow and other device communication protocols to collect live traffic throughput data for each interface on switches and routers. This enables the Network monitor to enhance its device inventory and topology maps with live traffic throughput information per link.
Who is it recommended for?
Site24x7 is very similar to the Datadog platform except in its pricing structure. With Datadog you subscribe to each module separately but Site24x7 offer bundles that provide all of their modules together. The base package is big enough for small businesses and is reasonably priced. Larger businesses pay for extra capacity.
Pros:
- Traffic analysis: Combine with the network map for capacity planning
- Network configuration management: Stores configurations and scans for changes
- Network troubleshooting: Ping and Traceroute
Cons:
- No on-premises version: Only available on the cloud
The Network Monitor isn’t available as a standalone service. Instead, it forms part of each of the five monitoring service bundles that Site24x7 offers. These are:
- Website Monitoring
- Site24x7 Infrastructure
- Application Performance Monitor
- All-in-one
- MSP
For example, taking out a subscription to Site24x7 Infrastructure gets you access to the Network Monitor plus server, virtualization, application, and website monitoring tools. You can get a 30-day free trial of Site24x7 Infrastructure.
6. Paessler PRTG Network Monitor (FREE TRIAL)
Paessler PRTG is a combined network device monitor, traffic analyzer, and server status manager. This will keep track of the health and performance of all of your network hardware and supporting devices. The server status monitoring extends to Cloud storage and online application services. Application transaction and resource utilization are also covered, and the monitor extends to the tracking of database transactions that server application execution. PRTG will also cover virtual environments and WiFi elements in your network. All of those different types of services take a lot of tracking, and it can be challenging to conceptualize all of the interfaces between different types of systems.
Key Features:
- A customizable package: The buyer decides which sensors to activate
- Network discovery: Creates an IT hardware inventory
- Network topology mapping: Based on the data in the hardware inventory
Why do we recommend it?
Paessler PRTG Network Monitor is based on a network discovery tool. This creates a network inventory and a topology map. The PRTG package also has a great wireless network discovery and mapping service. With all documentation in place, the system implements continuous network device monitoring and traffic analysis.
Thankfully, you don’t have to set up this complicated network tracking system yourself. The software installs itself, and one of the setup steps is a network discovery scanning phase that will document and list all of these different types of devices and how they work together. You can opt for an online version of the system, but that still needs an agent to be installed on your system. The PRTG dashboard can assemble maps that represent all of the different elements of your network. You can access maps that show virtualization, wifi performance, VoIP traffic, general network performance by link and end-to-end, and connections over the internet through to the operations of network links and server performance owned and managed by other companies.
Paessler PRTG’s monitoring system keeps gathering data on your system and reporting back live statuses on all of your networking equipment, including server conditions. Any potential problems arising in any part of the system get reported to the console immediately. Those alerts can be customized, so you can specify your combination of errors and warnings that would make you sit up and take notice, rather than getting notified about low ink toner levels or other non-critical maintenance conditions. Those lesser problems don’t have to be discarded because you can direct different types of alerts to different team members.
While all of this monitoring is going on, the network discovery process keeps you in the loop. So, any outages or performance problems get reflected on your various network maps. You don’t need to update the network inventory if you add, remove or move equipment because the monitor spots those changes and updates your network maps.
Who is it recommended for?
PRTG is one of the leading network device monitoring systems alongside the SolarWinds and ManageEngine packages outlined above. Paessler has recently expanded the appeal of the PRTG system by making it available on the cloud as a SaaS package. The on-premises version is still available and it runs on Windows Server.
Pros:
- Continuous scanning: The inventory gets updated if changes are detected
- Constant device checks: Alerts if components are in trouble
- Connection troubleshooting: Check on network or Internet routes
Cons:
- Free version only for small businesses: Limited to 100 sensors
The PRTG system can be accessed as a Cloud service, or it can be installed on premises – the software will run on Windows 10 and Server environments. The system is available for free to monitor small networks. However, a small system wouldn’t need all of the monitoring tools that are bundled into the PRTG tool; this option would be more useful as a partial install for assessment before getting the system to cover a large network. You can also get a 30-day free trial of PRTG.
7. Nagios XI
You will encounter two types of Nagios monitoring software. These are Nagios Core and Nagios XI. The one you need to consider is Nagios XI. Nagios Core is a free, open-source network management tool. However, it doesn’t have a proper front end with it. There is a Nagios Community made up of Nagios users and you can get interfaces for Nagios Core in the community forum for free from some of those users. However, Nagios XI is Nagios Core with a professional interface included, so you are better off going for that version.
Key Features:
- Full stack observability: Monitors networks, servers, cloud platforms, and software
- Network discovery: Creates a network inventory
- Network status map: A customizable view of the network
Why do we recommend it?
Nagios XI provides network, server, and application monitoring. The system is based on a network discovery service, which operates continuously, so any changes that you make in the network layout are instantly noticed by Nagios. The discovery system populates a hardware inventory and the system creates a network topology map.
The Nagios XI suite includes an autodiscovery module that will map all of your network for you and compile an inventory list. The mapping feature of Nagios XI has a handy utility, which is that it will replay all of your network’s activity, showing traffic levels on a network map. This means that you can review periods of network congestion and watch as bottlenecks appear. This is an excellent tool for analyzing the system weaknesses because you can examine events over and over again, making sure that you understand exactly what happened.
The monitor will observe and record the status of your network equipment and you will see alerts when failure and warning conditions occur. In addition to showing alerts in the Dashboards, you can get Nagios to notify team members by email or SMS. Those alerts can be directed to different team members according to source and severity. The Dashboard can also be customized, which means that you can give access to different views and controls to different team members. The Dashboard widgets include dials, graphs, histograms, and charts that make data easier to view.
Who is it recommended for?
Nagios is quite expensive and if you are particularly interested in monitoring your network, this package recently because less tempting because the developers moved the traffic an analysis features out into a separate module. Nagios XI still offers network device monitoring and it runs on Linux, Docker, or VMware.
Pros:
- Free version available: Called Nagios Core
- Extensible: Has a large library of free extensions, called Nagios Exchange
- Constant device status checking: Alerts for devices with problems
Cons:
- Traffic analysis not included: This has been separated into another product, called Nagios Network Analyzer
Nagios XI runs on CentOS or Redhat Enterprise Linux version 6 or 7. There is a free version of Nagios XI. This is capable of monitoring small networks. Free Nagios XI is limited to monitoring just seven pieces of equipment. The paid version of the system is available in a Standard Edition and a more expensive Enterprise Edition depending on the size of your network.
Related post: Nagios vs Zabbix
8. SolarWinds Network Performance Monitor
Larger organizations that need network management functions and not just a network mapper will be drawn to the SolarWinds Network Performance Monitor. This tool begins by tracing all of the networking equipment that is connected. The installation processes include an automated network discovery scanning phase.
Key Features:
- Device discovery: Creates a network inventory
- Wired and wireless networks: Logs wireless APs as well as wired network devices
- Network topology mapping: An interactive map provides details of each device
Why do we recommend it?
SolarWinds Network Performance Monitor provides an SNMP-based device monitoring service and it is based around a continuous network discovery system. The tool creates a network inventory and a topology map and it is also able to draw up wireless heatmaps. All these network records are constantly updated.
The Network Performance Monitor produces a map of your network, which will make it clear how all of your equipment link together. The map includes links over the internet to remote sites and Cloud-based services, and it also includes wifi systems. The graphical displays of your network that the auto-discovery process of the Network Monitor produces include a wireless network heat map. This is a fantastic network mapping bonus because it shows where WiFi signals overlap and where you have dead service zones. The information from the heat map makes it clear where you should place your WiFi routers to get full signal coverage all across your premises.

The network map itself gets updated automatically if you add, move, or remove a piece of network equipment. The map draws connections between routers, switches, and endpoints on your network. The map is color-coded displaying overloaded connections in red. It also gives a read-out of the volumes of data that each connection carries.
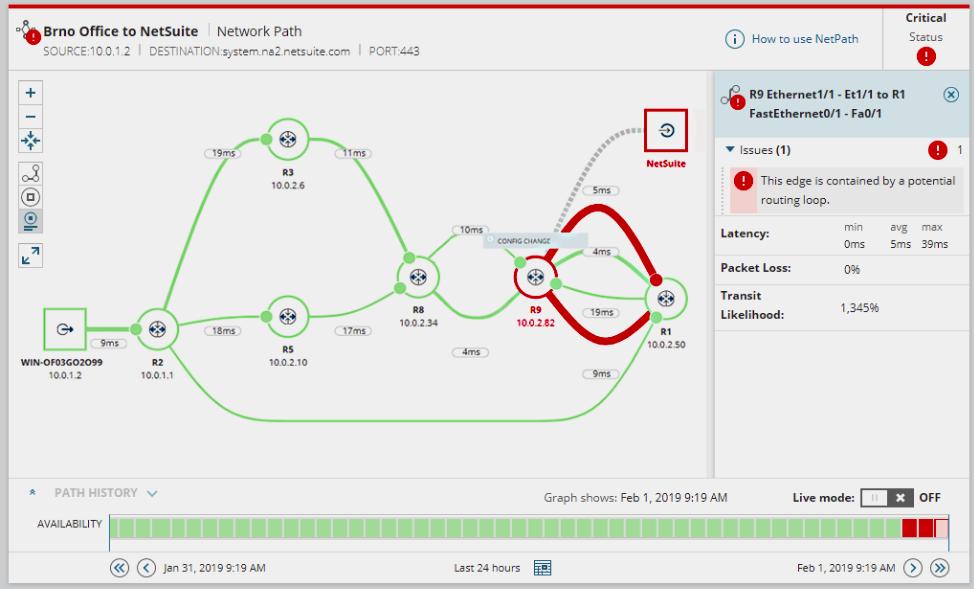
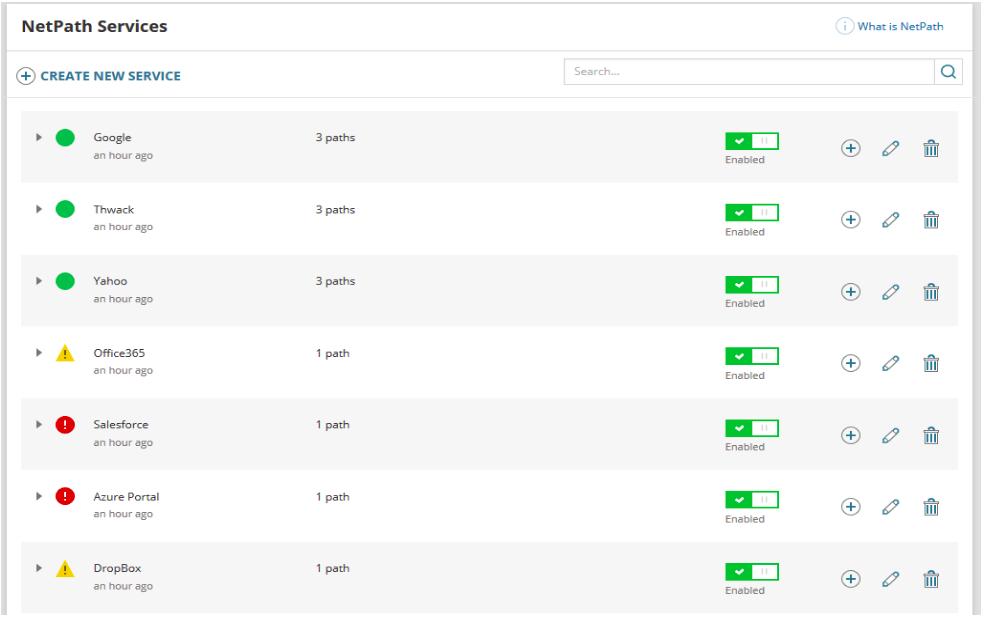
The Network Performance Monitor includes two other mapping facilities, which also generate network visualizations automatically. These are NetPath and PerfStack. NetPath gives you views on all of the links, detailing all of the devices that data will have to pass through on a journey between two given pieces of equipment. These links even extend over the internet to include Cloud-based services. PerfStack is a handy tool that can explain to you why applications and services are performing badly. This screen shows the ongoing performance graphs for a given application with each of the services supporting it beneath it – the services and hardware that support those underlying layers are also shown in the form of a stack. This will help you identify the root cause of performance issues immediately.
The Network Performance Monitor is a comprehensive monitoring system that will keep adjusting network maps and performance indicators in real-time. It will also alert you when operational metrics move into warning conditions. As a full, live management system, this package doesn’t come cheap. It installs on the Windows Server environment and you can get it on a 30-day free trial.
If you aren’t really in the market for a full network monitoring system and just want a tool that can map your network, then take a look at the SolarWinds Network Topology Mapper. This tool is cheaper than the Network Performance Monitor. It also runs on Windows 10 and Windows Server and you can get a 14-day free trial of it. This tool will draw you a nice, straightforward map of your network, which you can export to Visio.
The Network Topology Mapper gives you a choice of detection methods and it will extend to virtual environments and off-site resources. Each node in the map is an icon that leads to a details screen that shows the type of device and its current status. You can alter the style of network map representation and update node information to add in the names that you use yourself rather than the serial numbers of the devices. You can leave the Network Topology Mapper running to get it to update the network map automatically when you change the hardware on the system.
The wireless network heat map shows the overlap of WiFi signals and dead zones. The map is updated automatically and gives details of why applications and services are performing poorly. This tool uses SNMP procedures to discover all devices connected to a network and keep track of topology changes. Specifically, it discovers and maps devices, various performance metrics, link utilization, and wireless coverage. The NPM offers a robust set of tools to help you detect, diagnose, and work through a host of network issues.
Who is it recommended for?
This is a large package that provides more services than a small business would need. Mid-sized businesses could use the Network Performance Monitor but it is really designed for large organizations. The package also provides continuous live network monitoring and alerts for discovered problems. The software runs on Windows Server.
Pros:
- Rogue device identification: See all devices on the network including those that shouldn’t be there
- Constantly repeating scans: Automatically updates the network inventory and map
- Network device scanning: Provides status reports on network devices and alerts for problems
Cons:
- Only available for Windows Server: No cloud version
9. Cacti
Like most of the tools in this list, Cacti uses the SNMP protocol to monitor network devices. A significant advantage of the SNMP methodology is that it has network discovery software built-in. This is because all network devices have SNMP agents installed on them, so any monitoring program just has to broadcast a report request on the network to receive notifications from all of the network equipment. This enables an initial network device inventory to be compiled. The polling process of SNMP is re-issued periodically. That means that the equipment list is continuously updated. So, if you add or remove a device, those changes get registered in the inventory automatically.
Key Features:
- Free to use: There is no paid version
- Network discovery: Creates a hardware inventory
- Constantly repeats: Updates the device inventory if it encounters network changes
Why do we recommend it?
Cati is a nice free tool that provides network discovery, inventory creation, topology mapping, and live network performance monitoring. This is an SNMP-based system, so its main monitoring capability relates to device status monitoring but it can also provide some network traffic throughput information. The system is expandable by plug-ins.
Cacti is a free, open-source system that was created to provide a front end to the data gathering RDDTools. So, you need to install both of these systems to get network discovery and monitoring. The RDDTool system is also open-source and free to use.
The Cacti package includes a set of graph templates. You can customize a user interface by selecting a subset of the graph template pack. You can also create multiple user accounts and assign different sets of graphs to each. The free tool is useful for allowing users to see their own service consumption in leased service scenarios, SaaS provision, storage services, and even internet service provision. The no-cost model means that a vast number of instances of the software won’t force up costs.
Cacti and RDDTools can be installed on Linux, Unix, and Windows.
Who is it recommended for?
This tool is appealing to small businesses, while larger businesses would probably prefer a package that is fully supported. The system can be expanded by your own custom plug-ins and there is a library of pre-written plug-ins available. The fact that the tool is free is attractive and it is available for Linux, Unix, and Windows.
Pros:
- Extensible system: Functions can be added by free plug-ins
- SNMP-based: Notes device statuses, collected by the Simple Network Management Protocol
- Generates graphs and charts: Graphical representations of network activity
Cons:
- Requires work to set up: You need to spend some time setting up the tool and getting the right plug-ins
10. Zenmap
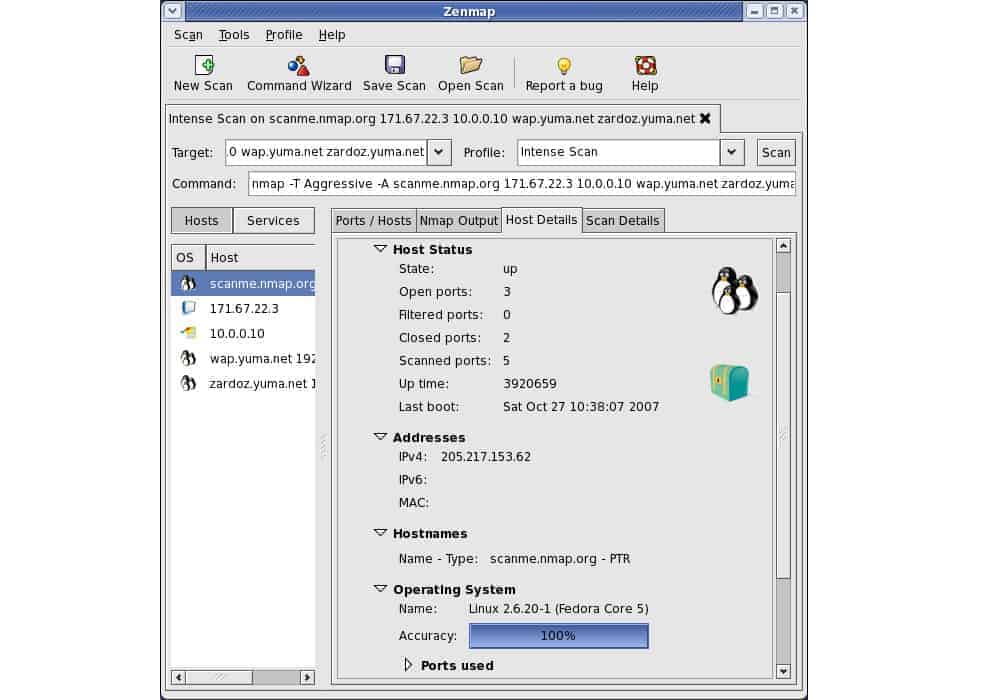
Zenmap is a graphical front end to Nmap. Both Zenmap and Nmap are free to use. Nmap is a security auditing tool, but it can be used for network scanning. Details of each node include the operating system, manufacturer, device type, IP address, hostname, and the status of the ports on the device.
Key Features:
- Based on Nmap: Provides a network map for Nmap results
- Free to use: Both Nmap and Zenmap are permanently free
- Provides a graphical user interface for Nmap: Issue Nmap commands through the Zenmap utility
Why do we recommend it?
Zenmap is a graphical front end for Nmap, which is widely used by hackers and penetration testers for network discovery. The Nmap system is a command line utility, and it has some very powerful features for black and white hat hackers but doesn’t provide the well-ordered displays that network managers need – that’s where Zenmap comes in.
The interface of Zenmap is very basic, and the tool doesn’t have the ongoing network monitoring capabilities of the other tools on this list. However, Nmap has a huge following and the combination of Zenmap and Nmap is widely distributed. These tools will be of use to you to provide ad-hoc system scans and security checks. As Zenmap is free, you won’t have to worry about your budget if you install it in addition to your regular network monitoring tool.
Zenmap and Nmap will install on Windows, Linux, BSD Unix, and Mac OS.
Who is it recommended for?
While Zenmap and Nmap are free to use, the display of Zenmap is a little dated and there are better free systems available that give more user-friendly network topology maps than the representation you get in Zenmap – Cati is an example of a well-planned free tool.
Pros:
- Multi-platform: Available for Windows, macOS, Linux, and Unix
- Ad-hoc scanning: This is an on-demand investigation tool
- Remote scanning: Can scan a remote network across the Internet
Cons:
- The interface is dated: Look at the Free edition of PRTG for a better free discovery tool
11. Spiceworks
Spiceworks produces a suite of system management tools that can be accessed online. All of the Spiceworks tools are free but ad-supported. To get all of your devices logged, you will need to use the Spiceworks Inventory module.
Key Features:
- Spiceworks tools: It system tools available for free online
- Spiceworks Inventory: Scans a network and creates a list of connected equipment
- Software inventory: Gives a list of software installed on each device that has a Spiceworks agent installed on it
Why do we recommend it?
Spiceworks Inventory is an online tool. It is able to compile a device inventory but it doesn’t provide a topology map. The system needs to install an agent on at least one device on your network in order to gather information. If you want to reveal hardware details, you need to install an agent on every endpoint.
The Inventory tool will search your system and log all of the equipment connected to your network. Not only will it register each piece of equipment, but the facility also gives you operational details of each device. The scan will also log all of the software that you have available.
Who is it recommended for?
This tool is aimed at small businesses that aren’t IT dependent. You don’t get device status monitoring with this system, so you risk service outages because you won’t be able to see problems evolving. Spiceworks also produces a free online connection tester and a free Help Desk system.
Pros:
- Free to use: You need to create an account but that is free
- On-demand scans: Doesn’t provide continuous scanning
- Easy to use: You don’t need any technical knowledge to use the tool
Cons:
- Suitable for small businesses: Doesn’t provide the performance monitoring functions that larger businesses need
12. NetBrain
NetBrain has an excellent network discovery procedure. The software is accessible online but it can penetrate your network to build an inventory of devices. You enter the IP address of a key router on your network, and the NetBrain system crawls out from there to record all of your network devices. The next phase of installation is the automatic creation of a network map. The map provides the interface for other functions available with the NetBrain package.
Key Features
- Hybrid network discovery: Discover all assets on premises and on the cloud
- System documentation: Hardware inventory that gets automatically created and updated
- System visualizations: Maps networks, SD-WANs, and virtualizations
Why do we recommend it?
NetBrain is quite a complicated system that implements Network Intent Automation. This means that it helps you implement security measures on your network devices and then monitors activity to see whether the security strategy has been implemented correctly or if it needs to be adjusted.
The network discovery feature of NetBrain keeps monitoring your system and updates automatically when you add or remove devices. The system will log Layer 2 and Layer 3 devices and help you manage their configurations. The Configuration Management tool in NetBrain alerts for unauthorized changes and also keeps the firmware of your network equipment up to date.
The network maps can identify virtual environments so you can see how many VMs (Virtual Machines) are dependent on each server. You can adjust maps on the fly to request a link view or get reports on end-to-end activity on a given path. This insight helps you to identify bottlenecks and also spot ways to re-route traffic away from troubled hardware.
Process automation enables you to set scripts to operate under certain trigger conditions. The automation works through a system, called “runbooks.” These are workflows that include software update tasks and data collection and analysis routines. The analysis functions help you spot intrusion, and it can also assist you in right-sizing your subnets. The NetBrain system can be sampled on a 14-day free trial.
Who is it recommended for?
This package is designed to assist hybrid networks. It is particularly useful if you want to introduce micro segmentation because it can write out all of the router rules needed to implement the plan. If you don’t get the plan right the first time, some paths on your network could get blocked, so the implementation is a recursive process.
Pros:
- Network status scanning: Provides warnings that trigger preventative remediation tasks
- Vulnerability scanning: Assesses switches, routers, and firewalls
- Network testing: Path analysis
Cons:
- No on-premises option: Only available as a cloud-based service
13. Fortra’s Intermapper
Intermapper is a product of Fortra. The tool installs on Linux, Windows, and Mac OS. This tool uses a range of technologies to detect network-connected equipment. These methods include SNMP and Ping. The tool includes an autodiscovery module, which compiles lists of hardware and also creates a map of your system. The discovery process is continuous and so any changes to the resources on the network automatically get reflected in the inventory and on network maps included in the utility.
Key Features:
- On-premises software: For Windows, macOS, and Linux
- Network discovery and mapping: The network map also acts as an inventory
- Network monitoring: Scans devices for problems, using SNMP
Why do we recommend it?
Fortra Intermapper discovers a network and then maps it. The map is the basis of live network monitoring because each device has its current status depicted by color coding. This is an easy to use system because anyone can understand that red means trouble. The tool isn’t overcomplicated, which is great for busy network managers.
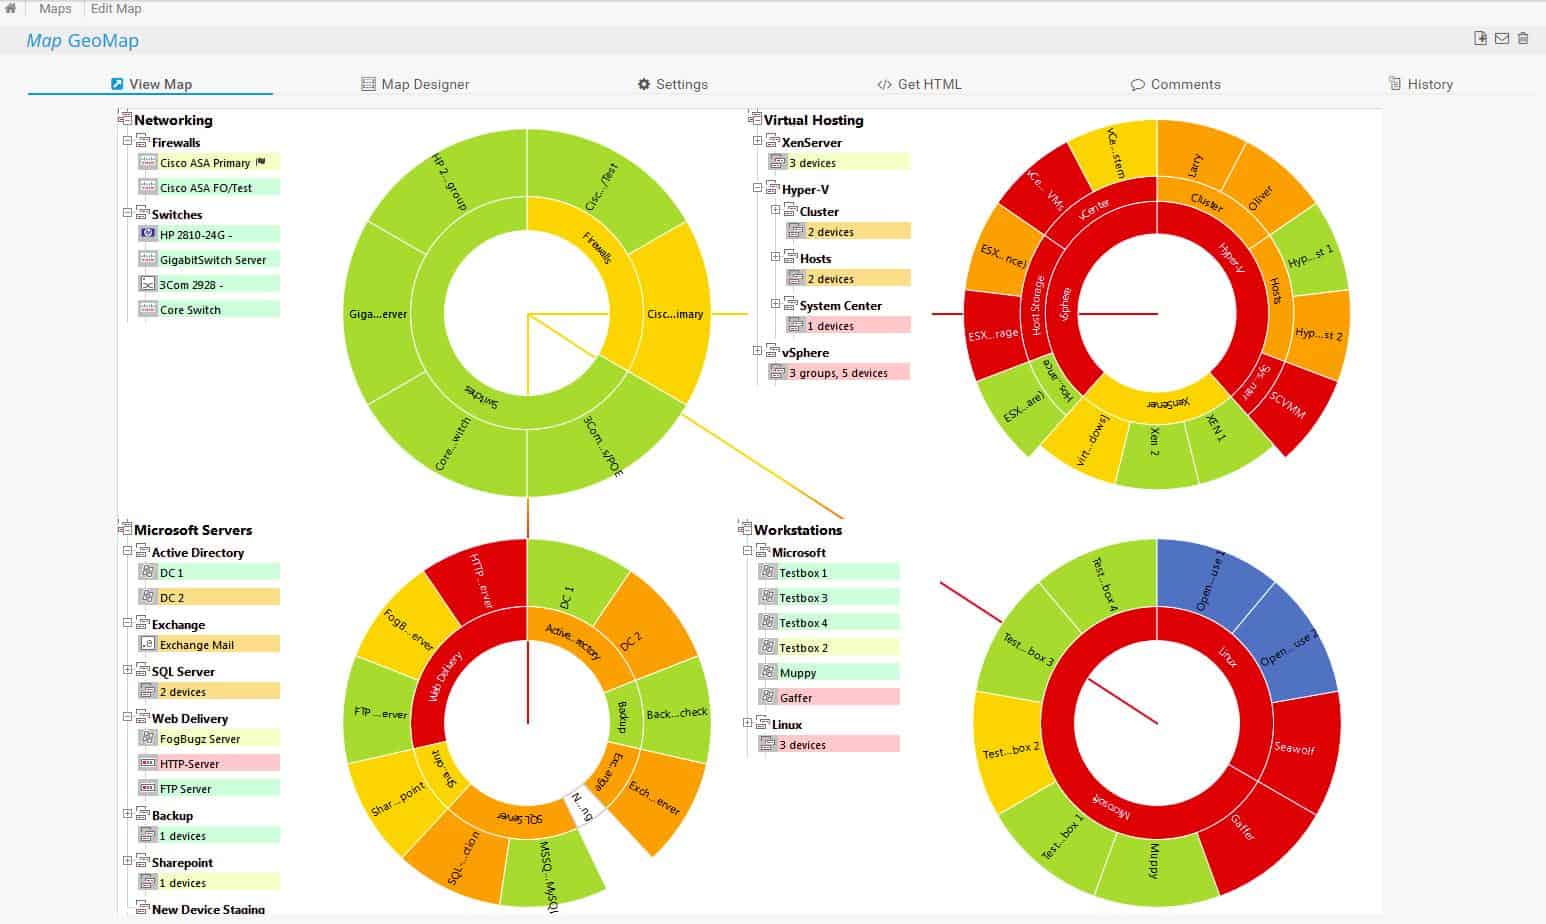
If you run a WAN, you can export Intermapper data to overlay on Google Maps to show your network on a real map of the world. Those exports can be scripted and periodic, giving you a near live map of your network status around the world.
As the Intermapper system relies on SNMP, constant status monitoring is an integrated part of its processes. This monitoring also extends to the collection of alert messages sent by device agents, so you get notified immediately if there are any problems with your system. Those alerts get shown in the system console and you can also set up the alerting mechanism to get notifications sent to you or another team member by email or SMS.
You can create action scripts that are triggered by alert conditions and get automatic error resolution. The data that Intermapper collects includes device statuses and network traffic flows. Alert conditions include traffic congestion as well as device statuses.
Who is it recommended for?
Intermapper is a lot less complicated than the services offered by SolarWinds, PRTG, and ManageEngine. However, that fact provides the tool with a market niche. Not every business needs a lot of network monitoring features. So, mid-sized businesses would be drawn to this package. This software runs on Windows, macOS, and Linux.
Pros:
- Constantly scans the network: Updates the map when changes are encountered
- Performance alerts: Sends notifications by email or SMS
- Traffic analysis: Useful for capacity planning
Cons:
- No price list: Buyers have to contact the Sales Department of Fortra for a quote
The Intermapper system is available on subscription and there is a free version with monitoring and mapping functions limited to 10 devices. You can get a 30-day free trial of the full paid version.
Choosing a network discovery tool
As you can see from our list, network discovery tools come in all shapes and sizes. The autodiscovery function is a handy setup feature of many network monitoring systems. It is also an essential element of security monitoring software, so you get a lot of choices when you are looking for a way to map your network automatically.
The list that we have compiled includes tools that are suitable for small and medium networks and others that would only really be of interest to large organizations with complicated networks. The size of your network, your budget, and the operating system of your servers are likely to be the three most important selection criteria that will influence your choice of network discovery system.
Do you employ a network discovery tool in your company? Do you use one of the tools that we have listed in this guide or do you have another tool that you could recommend? Leave a message in the Comments section below to let us know about your experiences.
Network Discovery FAQs
What is passive scanning in networking?
Passive scanning is an information gathering task that relies on catching information that is already in circulation on a network rather than actively querying systems and rewriting programs to originate data. Passive scanning is implemented in a number of network management processes including network vulnerability scanning and network discovery.
How do I stop network discovery from turning off?
The phenomenon of network discovery turning off seems to be a particular problem with Windows 10. This pattern of behavior isn’t very common in business network discovery software that runs on Windows Server or Linux. If your PC displays this problem try these steps.
- Restart the computer to make sure the problem isn’t temporary.
- Update your network adapter
- Go to the Device Manager.
- Right click on the entry for your network adapter
- Select Update driver from the context menu
- Reset network settings
- Go to the Network and internet section of Windows settings.
- Click on Status
- Click on Network reset.
- Restart your computer after this process
- Set sharing options in the network connection settings
- Go to the Status section
- Click on Sharing Options
- Activate the Turn on network discovery radio button
- Check your firewall settings and ensure that it isn’t blocking network discovery
- Check your antivirus system to make sure that it isn’t deactivating your network discovery settings
How do I find free IP addresses on my network?
The easiest way to find free IP addresses on your network is to create a Ping loop.
- Open a command line session
- Enter ipconfig on Windows or ifconfig on Linux or Mac OS
- Look for the Default Gateway entry in the results. Write down the first three octets. In the following example, that Default Gateway address is 192.168.0.1, so the first three octets are 192.168.0
- Enter the following text, replacing the example IP address octets with those of your own network:
for /l %i in (1,1,254) do @ping 192.168.0.%i -w 10 -n 1 | find "Reply"
The results of this loop are all the currently used IP addresses on your network. A free IP address would be one that is not in this list but within the same range. So, pick an address that would lie numerically between the gaps in the series of addresses that are in the Ping loop output.
What is network inventory?
The network inventory is a list of all of the devices that you have connected to your network. This includes network devices, such as switches and routers. The list also includes endpoints, such as PCs, printers, and servers. The network inventory can also show details of each device including make and model and possibly operating system version or firmware version.
Related:


