Effective network monitoring is essential for ensuring the optimal performance and security of modern IT infrastructures. With network traffic growing exponentially, especially in large organizations, administrators need tools that can provide deep insights into network activity and performance. J-Flow is a flow protocol that is built into all Juniper Networks devices. It captures and analyzes network traffic and administrators need specialized monitoring tools that can process J-Flow data to benefit from its insights.
J-Flow is Juniper’s implementation of the popular NetFlow protocol, designed to collect flow data on routers and switches. This data provides an in-depth view of network traffic, including who is communicating, what data is being exchanged, and how bandwidth is being utilized. However, collecting raw flow data is not enough. To make the data useful, it needs to be analyzed and interpreted effectively. This is where J-Flow monitoring tools come in, providing the necessary visualization, analysis, and reporting capabilities.
Here is our list of the best J-Flow monitoring tools:
- Paessler PRTG J-Flow Monitoring EDITOR’S CHOICE A combined network, server, and application monitor that includes J-Flow, sFlow, and NetFlow monitors as well as a general packet capture tool.
- ManageEngine NetFlow Analyzer (FREE TRIAL) A traffic monitoring and analysis tool that is able to extract data through J-Flow. Installs on Windows Server and Linux.
- Site24x7 J-Flow Monitoring (FREE TRIAL) A network traffic monitoring system that is able to communicate with Juniper Networks devices through J-Flow. This is a SaaS system.
- Noction Flow Analyzer This network monitoring tool provides live network traffic tracking that uses a list of statistics extraction protocols, including J-Flow to communicate with network devices provided by Juniper Networks. Runs on Linux.
- Nagios Network Analyzer J-Flow, NetFlow, and sFlow monitoring with this traffic analysis module that complements Nagios XI.
- SolarWinds Bandwidth Analyzer Pack A complete network monitoring system that covers network performance and traffic analysis. The traffic management system is compatible with NetFlow, J-Flow, sFlow, NetStream, and IPFIX.
- Opsview Monitor with Opsview Network Analyzer J-Flow, NetFlow, and sFlow monitoring with this module that is an add-on to the core Opsview Monitor.
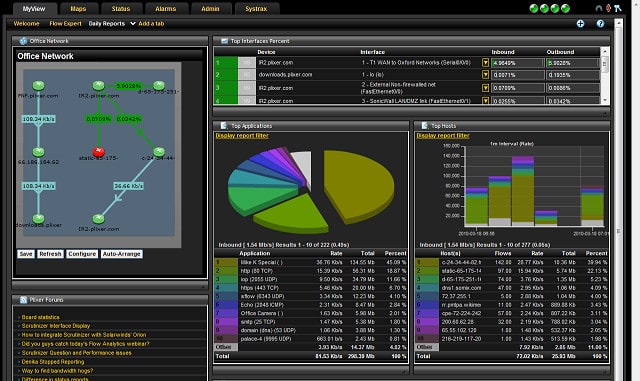
- Plixer Scrutinizer A standalone traffic analyzer that includes J-Flow, sFlow, NetFlow, NetStream, and IPFIX tracking.
In this guide, we’ll explore the best J-Flow monitoring tools available today. These tools help organizations monitor network traffic, detect anomalies, optimize bandwidth usage, and troubleshoot network issues. Some of the top J-Flow monitoring solutions include powerful features such as real-time data analysis, customizable dashboards, alerting, and reporting capabilities. These tools integrate well with Juniper Networks’ hardware and software, ensuring seamless compatibility and providing a comprehensive view of network performance.
Whether you are looking to troubleshoot network issues, optimize performance, or enhance security, J-Flow monitoring tools are critical for organizations using Juniper devices. In the following sections, we will review the best options available, highlighting their key features, advantages, and the ways they can support your network monitoring efforts.
Network Traffic Analyzers
There are many great network monitoring tools available on the market today and it takes a lot of time to preview and evaluate all of your options. That’s why we produced this guide to save you time and direct you towards the best monitoring tools that have J-Flow capabilities.
Network management tools are produced in a modular format with specialist software focusing on specific aspects of networks. For J-Flow capabilities, you need to concentrate on traffic analyzers. This category of monitor will let you examine the flow rate of data across your network. In order to get a full picture of your network’s capabilities, you will also need to employ other specialist tools, such as network device monitors, server and application monitors, and specialist modules for mobile device management. If you also add on IP address management and configuration management you will have the full suite of a network administration system.
Even if you are only interested in a traffic analyzer for the moment, it pays to think of how you might want to expand your network management software in the future. In order to produce a list of network analyzers that are the best-of-breed, it is important for us to include options that are suitable for different network sizes. This list of recommendations includes options for small networks as well as full-service bandwidth monitors that fulfill the needs of large networks.
Best J-Flow monitoring tools
Each of these tools offers extended capabilities, giving other features in addition to J-Flow reporting.
Our methodology for selecting a J-Flow monitoring tool
We reviewed the market for network bandwidth monitors that can process J-Flow and analyzed tools based on the following criteria:
- The ability to communicate with J-Flow
- The capability to extract data from devices and store it
- A tool that can communicate with other protocols, such as NetFlow
- An analysis package
- A display that can categorize traffic by protocol
- A free trial or a demo system that offers a cost-free assessment opportunity
- Value for money, represented by a tool that can provide live bandwidth usage tracking at a fair price
With these selection criteria in mind, we identified some comprehensive bandwidth monitoring tools that can communicate with switches and routers produced by Juniper Networks, using J-Flow.
1. Paessler PRTG J-Flow Monitoring (FREE TRIAL)
Paessler PRTG is a unified monitoring tool that covers networks, servers, and applications. The capabilities of this package are vast and the company ships the full suite to every customer. The system is made up of a series of sensors and you just tailor it to your needs by choosing which sensors to activate. So if you only want to use PRTG for network traffic analysis, you can only turn on those functions and leave the rest dormant.
Key Features:
- Network, server, and application monitoring
- J-Flow, sFlow, and NetFlow
- Packet sniffing
- QoS, CBQoS, and IP SLA tracking
Why do we recommend it?
Paessler PRTG J-Flow Monitoring is a component in a larger package of network, server, and application monitoring services. The system’s units are deactivated when the software bundle arrives and the buyer decides which to turn on, so if your network devices are from Juniper Networks, you would use the J-Flow sensor.
Limiting the system to just a few sensors will save you a lot of money because Paessler charges for PRTG based on the number of active sensors. The charge rate works on bands of sensor numbers and if you activate 100 or less you don’t have to pay anything for the tool. However, if you ever want to expand the reach of your PRTG implementation, you have to make an upgrade payment and then you can turn on more sensors.
PRTG implements traffic analysis with four packet capture sensors. These are:
- J-Flow sensor
- NetFlow sensor
- sFlow sensor
- Packet sniffer
If you just want to centralize J-Flow data then you only need to turn on the J-Flow sensor. If you have equipment from other providers on your network, then you might also want to use the NetFlow and sFlow sensors, or just use the native packet sniffer to capture packets travelling through all brands of network devices. The PRTG packet sniffer only captures packet headers; therefore, you don’t need to worry your CIO over data integrity issues because no one on the systems administration team will be looking into the payloads of the packets travelling across the network.
The Ping sensor should also interest you. It will give you round-trip performance data on essential paths, including out to remote sites on a WAN or up to Cloud services. The traffic monitoring sections of PRTG also include wireless networks. The monitor can log your traffic flows that are tagged for the QoS, CBQoS, and IP SLA standards.
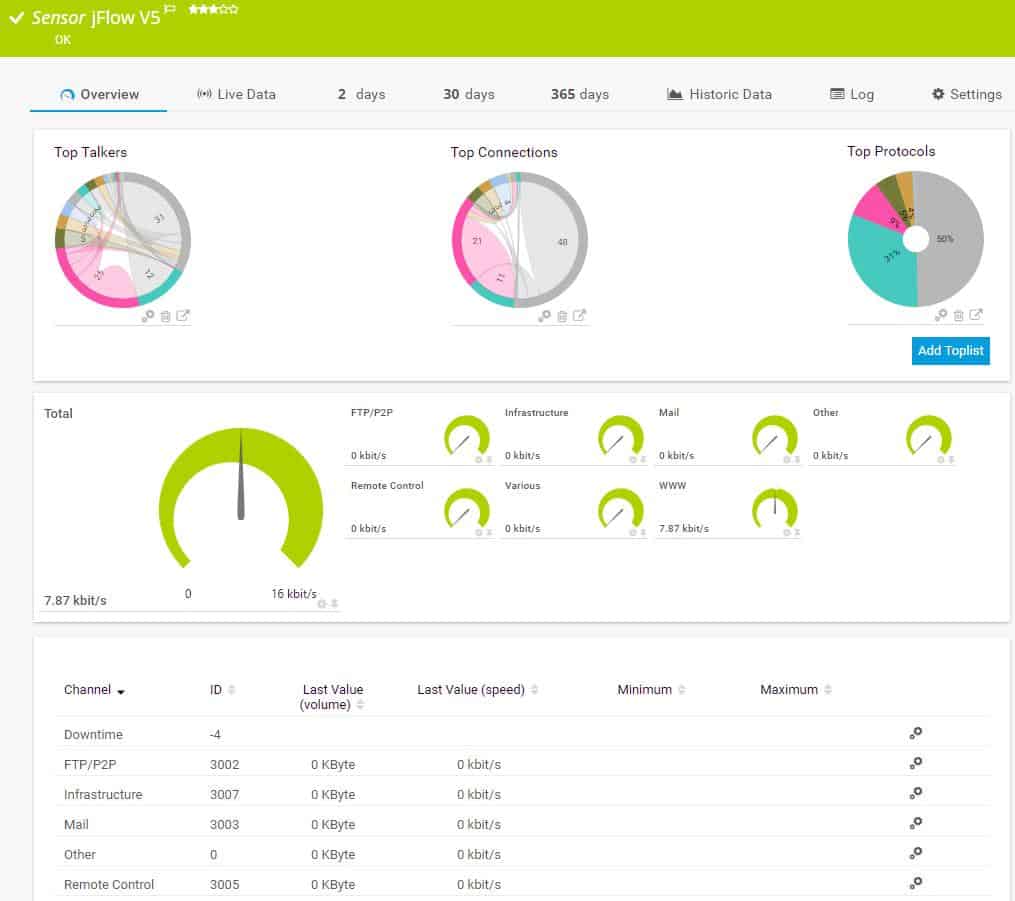
The traffic analysis console will identify the protocols and applications originating each packet and identify them. This enables you to focus on one slice of your network traffic according to purpose, and you can also group traffic by conversation. The applications types that PRTG identifies include email traffic, chat app traffic data, Web transactions, and file transfer packet volumes.
Getting a map of your network with traffic statistics coded on it is a big aid to capacity monitoring and you can get a great map from PRTG. This tool uses an SNMP sensor to discover all network devices and their interconnections. The links between these devices get plotted onto a map and all equipment and links are shown with color-coded statuses.
SNMP traps get interpreted into dashboard alerts by PRTG. These alerts can be filtered to strip out the less important messages and prevent your console from getting cluttered with non-essential notifications. You can also customize your own alert conditions, including traffic capacity utilization conditions as well as equipment statuses. Why not mix together conditions to create custom alerts that blend several sources of warnings? With PRTG, this type of creativity is possible and you can also route categories of notifications to different team members according to source and severity. Alerts can be pushed out through email, SMS, or a chat app to notify team members even when they are away from their desks.
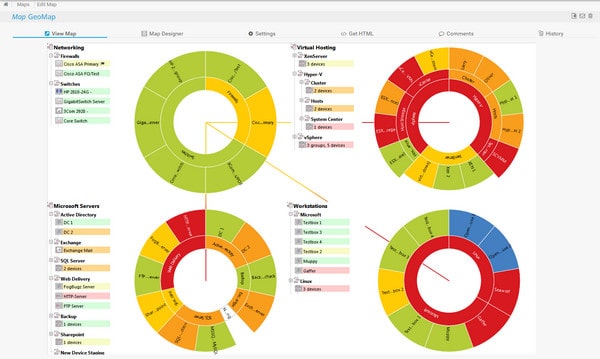
PRTG offers some really good mapping options, which include a real-world map with site links drawn onto it for WANs. You can also use the automatically-generated sunburst map, which is proprietary to Paessler. This shows underlying services with higher layers and applications radiating out from the center. The result of this display is the circular, status-colored “sunburst.” It’s a good visual for presentations as well as a shortcut method to spot the root cause of performance issues.
Who is it recommended for?
PRTG isn’t limited to collecting data with J-Flow. It incorporates sensors for all of the other traffic sampling protocols, such as NetFlow and IPFIX. You just turn on the sensors that you need and get monitoring and sampling services for the devices on your network. You can get PRTG for free if you only activate 100 sensors.
Pros:
- Designed to be an infrastructure monitoring tool that supports multiple sensors types such as NetFlow, sFlow, and J-Flow
- Offers additional monitoring on the same platform, supporting infrastructure, network, and application performance monitoring
- Captures packet headers only, helps speed up analysis and keep storage costs down for long-term collection
- Uses simple yet intuitive graphing for traffic visualization
Cons:
- Very detailed platform that takes time to learn and fully utilize all of the features available
PRTG is available as on-premises software or as a cloud service. All PRTG software elements, including data collectors for the Cloud version, install on Windows Server. You can get a 30-day free trial of PRTG with unlimited sensors.
2. ManageEngine NetFlow Analyzer (FREE TRIAL)
ManageEngine NetFlow Analyzer is a traffic monitor that is able to communicate with network devices through the J-Flow protocol. This tool can also sample traffic and gain throughput statistics with the NetFlow, IP-FIX, sFlow, AppFlow, and NetStream standards.
Key Features:
- Network, server, and application monitoring
- J-Flow, sFlow, IPFIX, NetStream, AppFlow, and NetFlow
- Performance threshold alerts
Why do we recommend it?
ManageEngine NetFlow Analyzer is the equivalent of the SolarWinds NetFlow Traffic Analyzer. However, while the SolarWinds tool relies on the presence of the company’s Network Performance Monitor, this system can operate as a standalone package. This system also collects NetFlow, sFlow, NetStream, and AppFlow, and IPFIX data and has a packet sniffer.
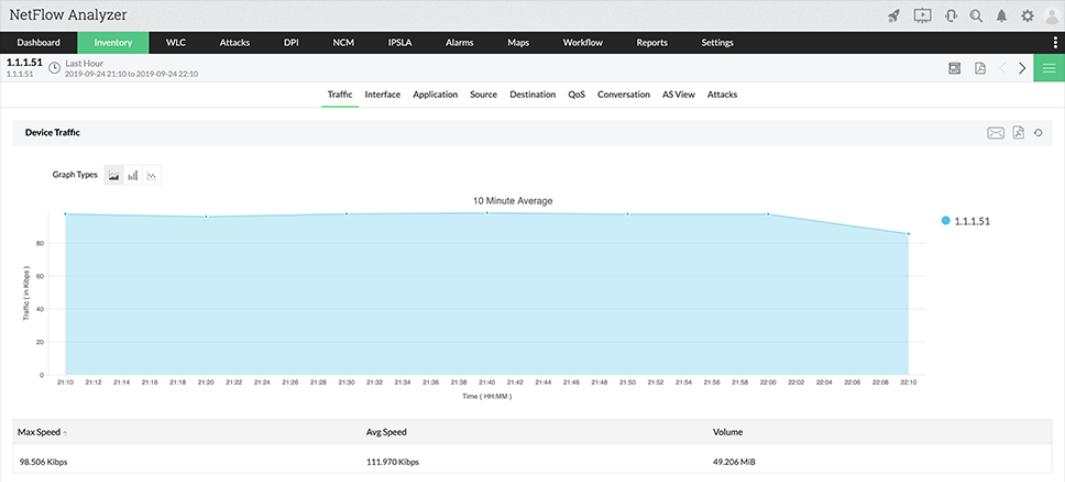
The NetFlow Analyzer makes rapid use of data collected with J-flow statistics displayed immediately in the system dashboard. Information is made available with both data and graphical representations appearing on the traffic monitoring screens. Those representations of data are more than just an eye-catching feature – they make instant recognition of statuses very easy.
The time-saving way that NetFlow Analyzer portrays system statuses will be appreciated by any time-pressed network administrator. Better still is the system of performance thresholds and alerts that is built into the monitoring service.
The thresholds that monitor the performance of your network offer several perspectives to supervise bandwidth usage. You can identify groups of IP addresses or devices and set bandwidth utilization thresholds on them – these aren’t limits because they won’t throttle traffic. Instead, if traffic rises above a margin of safety, the NetFlow Analyzer will notify you with an alert. That alert appears on the system dashboard and you can set the system to also send out alerts by SMS or email.
Depending on your traffic expectations, you can modify alert incidences by specifying that only threshold breaches that occur with a particular regularity should be reported or that traffic peaks that endure beyond a time limit should provoke an alert.
Those notifications give you time to deal with traffic volume excesses before they impact delivery quality. This is particularly important in the case of live, interactive protocols, such as VoIP or video conferencing. NetFlow Analyzer includes the capabilities of analyzing protocol traffic and imposing IP SLA and NBAR measurements to identify the efficient performance of those time-sensitive traffic flows.
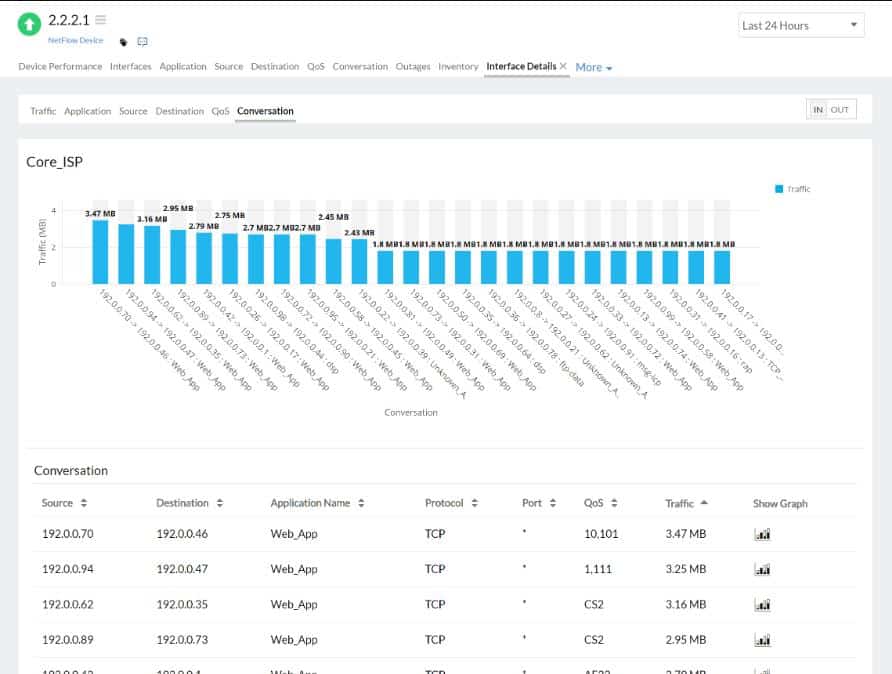
Analytical tools in the NetFlow Analyzer package enable you to investigate major traffic issues. You can watch traffic flows over time and see when demand hits the system’s capacity limits. You can also identify which applications, protocols, and endpoints generate the most traffic.
Link statistics expose which parts of the network are acting as bottlenecks that slow traffic or even lose packets. Once you can see the what, where, and why of traffic problems, you can access traffic management tools within NetFlow Analyzer to fix those issues.
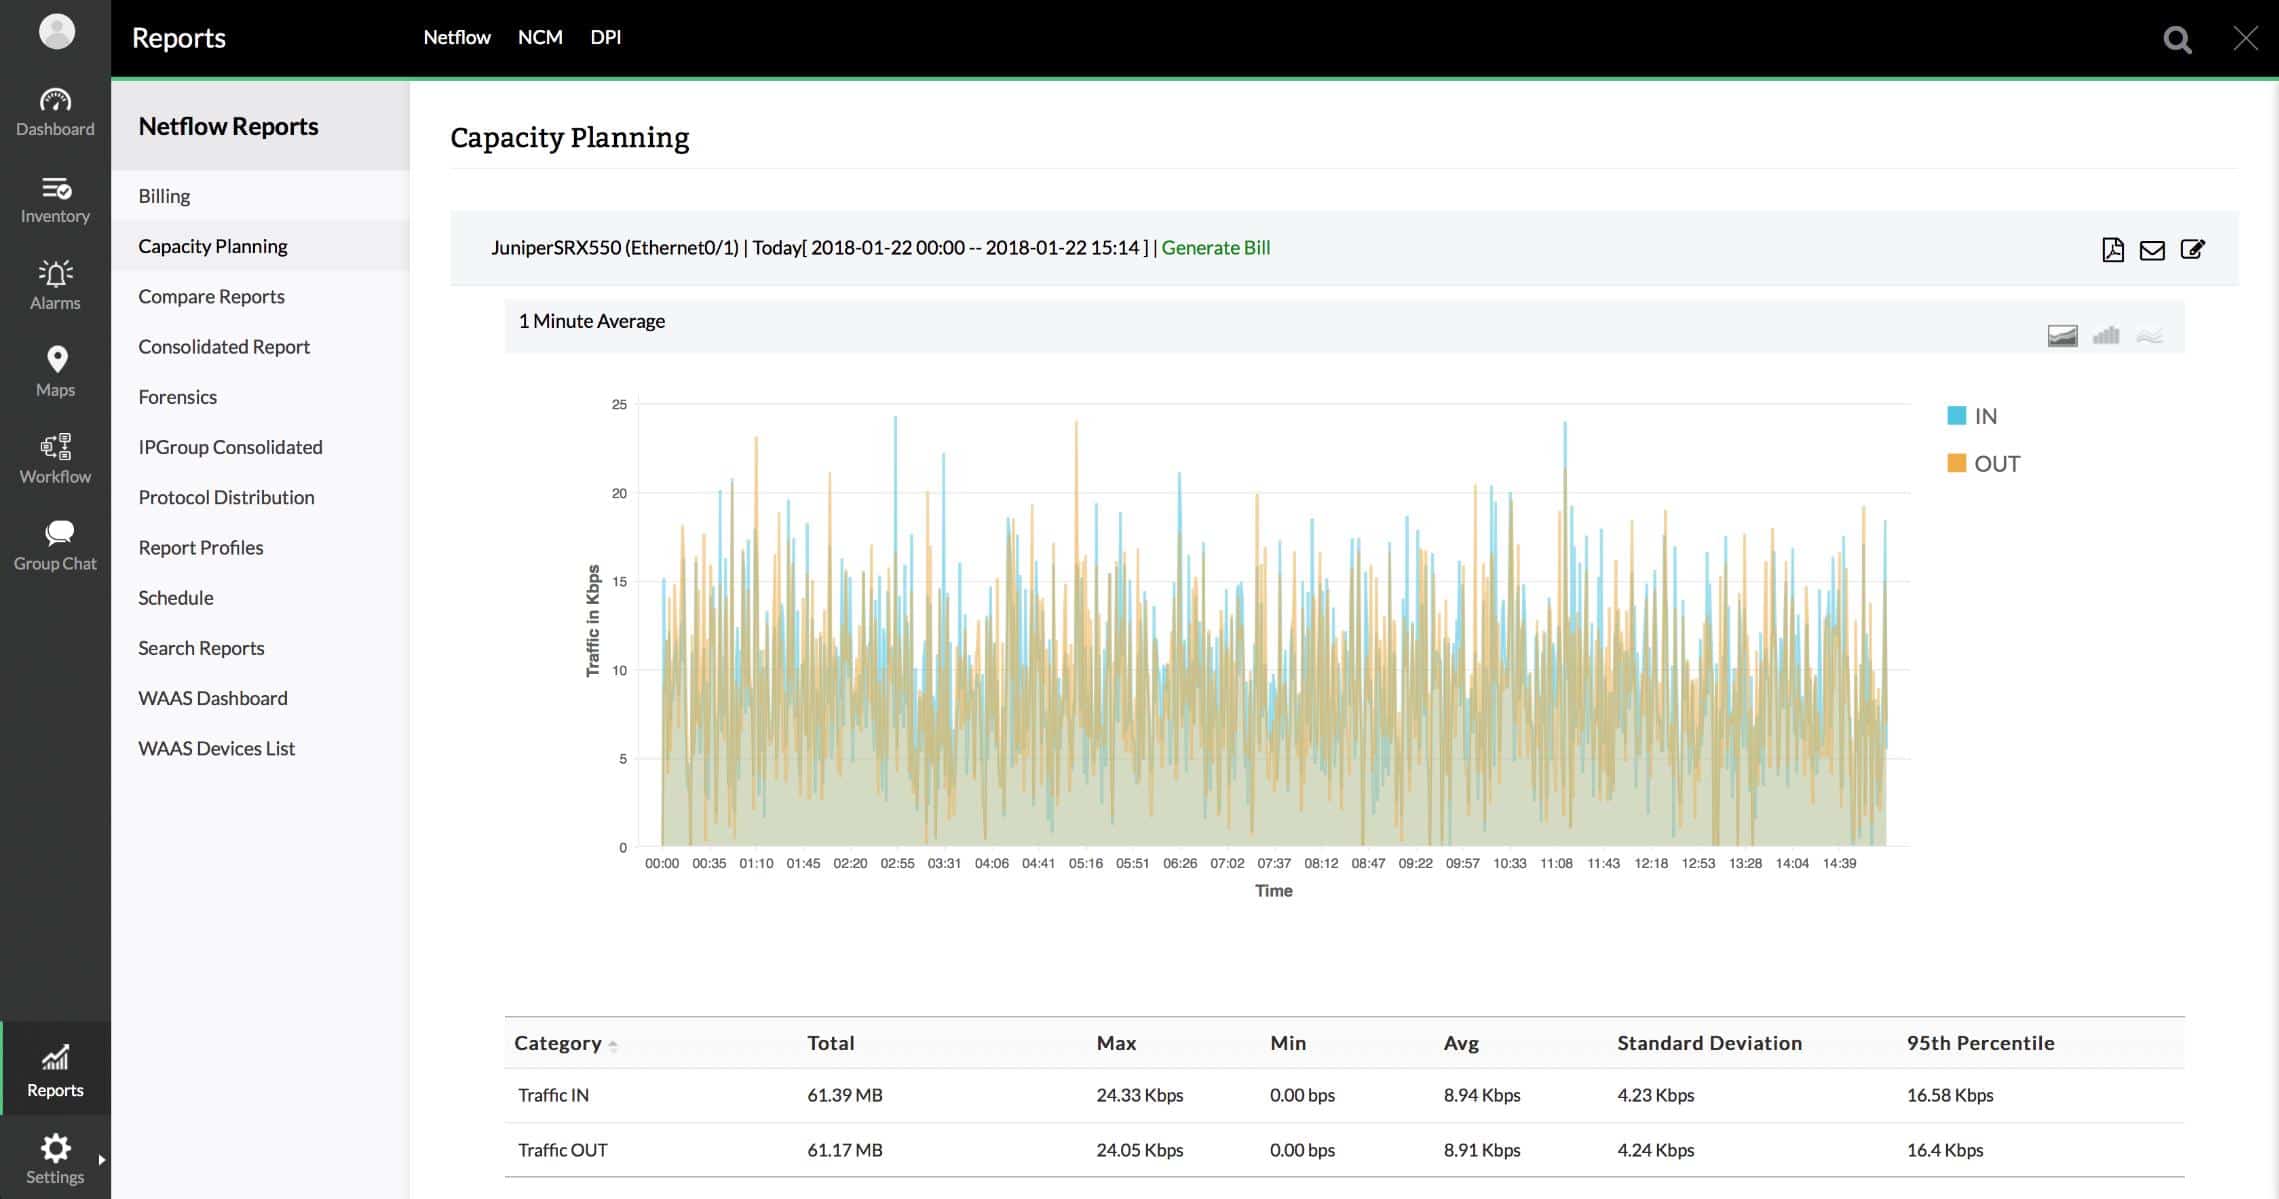
Capacity planning tools will help you spot where resources are underutilized and where they are overstretched. With those tools, you will be able to see if rerouting traffic by protocol or relaying the physical layout of the network will enable you to squeeze value out of your current investment. Traffic shaping measures can be implemented within NetFlow Analyzer to prioritize real-time application traffic and head off capacity issues without the need for further capital investment. Other management features in the tool include VLAN tagging, QoS management, and Access Control Lists.
Other utilities in the NetFlow Analyzer package include packet header sampling for deeper traffic analysis and traffic trends identification. You will be able to work out whether shifting some system tasks to after-hours processing could alleviate bandwidth capacity issues without needing to expand your physical infrastructure. Network traffic volumes inevitably increase over time and the trend analysis tool in NetFlow Analyzer helps you plan ahead and expand your resources exactly when extra capacity will be required.
Buying network management software costs money and you will need to justify the expense of acquiring ManageEngine NetFlow Analyzer. That proof comes from the quality of reports that the system produces as well as its cost-saving capacity planning and traffic shaping measures. Corporate influencers and senior management will be a lot less hostile to your efforts if you provide them with the statistics and performance proof that they are always asking for. The NetFlow Analyzer doesn’t just free up your time for other tasks, it also automatically produces volumes of metrics and analysis reports to keep any accountant happy.
Who is it recommended for?
The package has a great many packet-level analysis features. For example, the service can capture and replay packets for network capacity testing and it can even generate packets for stress testing. There is a Free edition, but it is limited to monitoring two interfaces, which is not very much. Fortunately, the base package is reasonably priced.
Pros:
- Supports multiple protocols like NetFlow alongside J-Flow, great for monitoring Cisco equipment
- Both tools work well alongside each other to help view traffic patterns and bandwidth usage
- Easy-to-use interface automatically highlights bandwidth hogs and other network traffic outliers
- Scale well, designed for large enterprise networks
- Can view traffic on a per-hop basis, allowing for granular traffic analysis
Cons:
- Designed for enterprise use, takes time to fully explore all options available
ManageEngine NetFlow Analyzer is available in two editions – both are available for installation on Windows Server or Linux. The lower edition is called Essential. The higher package, Enterprise includes all of the IP SLA, NBAR, and CBQoS tools that will really help you to get real-time applications running smoothly. That Enterprise plan is able to monitor multi-site networks and also includes IPAM and switch port mapping features. ManageEngine offers a 30-day free trial of both the Essential edition and the Enterprise plan.
3. Site24x7 J-Flow Monitoring (FREE TRIAL)
The J-Flow monitoring system offered by Site24x7 is integrated into all of the monitoring packages offered by this cloud-based system management utility provider.
Key Features:
- Cloud-based
- J-Flow, sFlow, IPFIX, NetStream, AppFlow, CFlow, and NetFlow
- Protocol analysis
Why do we recommend it?
Site24x7 J-Flow Monitoring is a unit on the Site24x7 cloud platform of monitoring tools. This service is able to provide protocol analysis in easy-to-read tables and graphs. You can customize the dashboard and decide which statistics to show and in what format.
The network traffic monitoring capabilities of Site24x7 is able to show traffic statistics per link and end-to-end across the network. It will segment traffic data per application and per source and destination address. The system can also track conversations that show all of the activities on a specific connection. These tools let you identify big bandwidth users.
The Site24x7 J-Flow monitoring tool shows live time-series charts of traffic flows and is also able to save statistics for historical analysis. Network managers can use this system to spot peaks and troughs in terms of times of the day and then choose a range of traffic management strategies.
The tool isn’t limited to examining data from Juniper Networks devices through J-Flow. It can also communicate with the devices provided by other manufacturers. In fact, it can communicate with network equipment supplied by more than 200 vendors. The monitoring tool is capable of communicating with NetFlow, sFlow, IPFIX, CFlow, NetStream, and AppFlow as well as J-Flow.
Within the tool, a threshold setting function enables the technical team to set acceptable levels of throughout to warn against capacity exhaustion. This means that operators can get on with other tasks and leave the monitor to supervise normal patterns of traffic, knowing that they will be called back to the monitor if problems arise.
If a performance threshold is breached, the system generates an alert in the dashboard and also forward those to key staff by email, SMS, or phone call. The dashboard is hosted on the Site24x7 servers and so can be accessed over the internet through any standard Web browser from anywhere.
All of the data processing for the J-Flow monitoring system are also hosted on the cloud. There does need to be an agent installed on site. That will collect data by querying network devices. The statistics that the agent gathers get uploaded to the Site24x7 server over a secure, encrypted connection.
The plans offered by Site24x7 are service bundles. These include a Website Monitoring package that focuses on web services and the servers that host them. This plan also includes network monitoring services that include J-Flow traffic monitoring. The J-Flow monitor is also included in an Infrastructure package that focuses on network and server performance. Site24x7 offers an Application Performance Monitoring (APM) plan, which has J-Flow monitoring included.
The graphs and reports in the J-flow monitoring system aid in capacity planning and trend usage analysis. The reports all help the network manager to communicate goals with IT staff and senior managers. Combining the network traffic monitor with network performance monitoring and server monitoring enables system administrators to track performance issues down to the root cause. All of those functions are included with all of the plans offered by Site24x7.
All of the three service plans of Site24x7 can be subscribed to as a bundle, which is called the All-in-One plan. There is a multi-tenanted version of the All-in-One bundle, called MSP, which is aimed at managed service providers.
Who is it recommended for?
The package is able to use all the other major traffic analysis protocols, not just J-Flow. It is possible to put alert thresholds on overall traffic per link and traffic per protocol. So, this is an excellent package for network managers who have small budgets and need to squeeze maximum value from their resources.
Pros:
- Has one of the best user interfaces among similar NetFlow analyzers
- Features a mobile app for both Android and iOS
- Can measure can detect latency, jitter, and performance over time, making it a viable long-term solution for ping monitoring
- Can integrate and monitor up to 200 different vendor devices
- Free version can support up to hosts, making it a great introductory option for smaller businesses
Cons:
- Feature dense platform that can take time to fully learn all of its features and customization options
Site24x7 offers a no-obligation 30-day free trial on all of its plans. For example, you can check out the Infrastructure edition on a free trial to sample the J-Flow monitoring capabilities of Site24x7
4. Noction Flow Analyzer
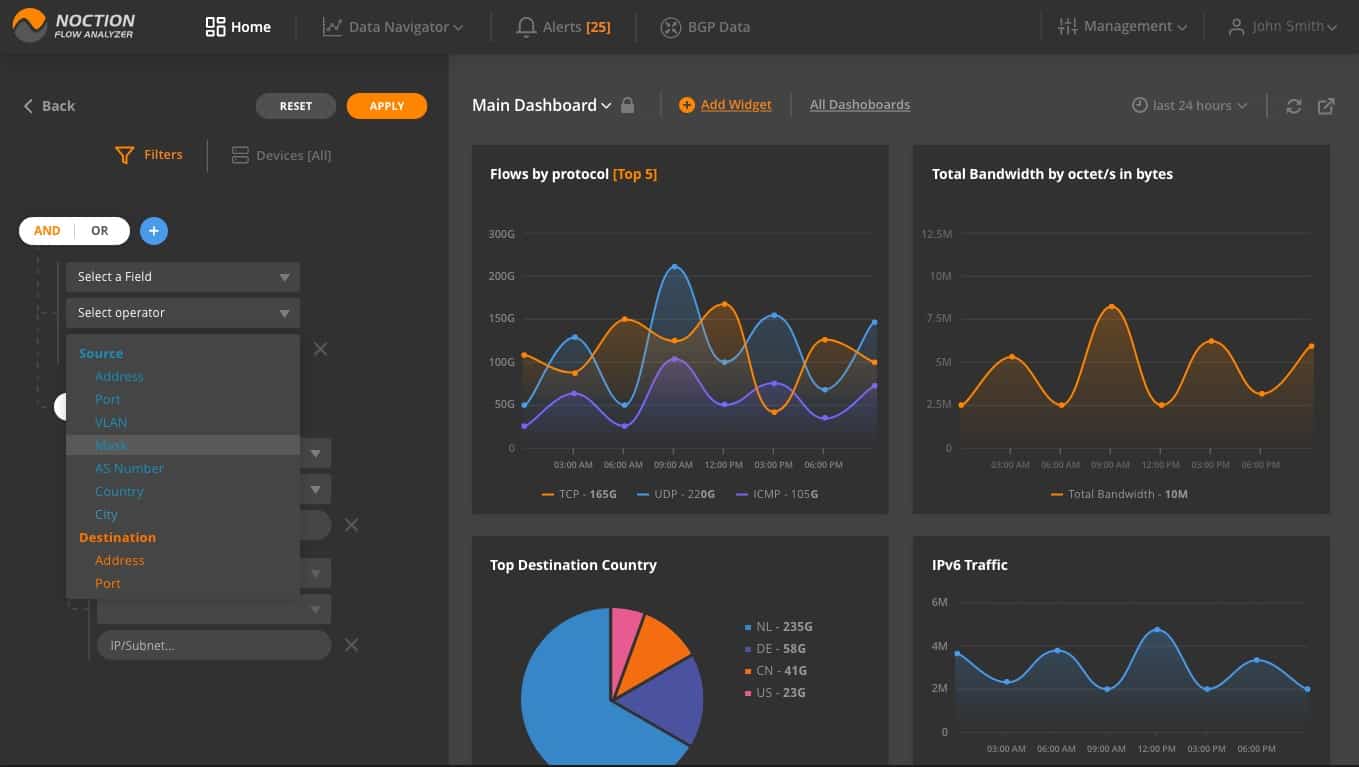
Noction Flow Analyzer (NFA) is an on-premises package that implements a range of network traffic monitoring services.
Key Features:
- Performance threshold alerts
- J-Flow, sFlow, IPFIX, NetStream, and NetFlow
- VLAN analysis
Why do we recommend it?
Noction Flow Analyzer is a detailed traffic tracker that provides a range of analysis features. The tool gathers source data for analysis using J-Flow, NetFlow, IPFIX, sFlow, and NetStream. This broad protocol capability allows the system to operate traffic analysis on a multi-vendor network. The software runs on Linux.
Flow Analyzer can communicate with all switches and routers provided by a list of manufacturered by:
- Netgear
- Juniper Networks
- Cisco Systems
- Hewlett Packard Enterprise
- Brocade
- Extreme Networks
- Dell
- Arista
- Huawei, and others
Some of these brands have creates their own communication protocols, through which monitoring packages can extract data. The first of these was NetFlow, created by Cisco Systems. Juniper Networks created its own version of NetFlow, called J-Flow. Huawei has NetStream. Other device producers use industry standards IPFIX and sFlow instead of creating their own protocols.
In order to communicate with a variety of device brands, Noction Flow Analyzer has to include the ability to communicate in these standards: NetFlow, sFlow, IPFIX, J-Flow, and NetStream.
The Flow Analyzer doesn’t compartmentalize data gathered by different protocols. However, it does record the device identifier against the data that it extracts. Thus, data can be aggregated for the whole network, while it can still be segmented per device.
Data is shown live in the dashboard for Flow Analyzer and it is also stored. The live monitoring system shows traffic data in both text and graphical formats. The screens of the dashboard can be customized.
The delivery system for the console of the Flow Analyzer is implemented as a website on an intranet. Technicians can access the dashboard through any standard Web browser.
Flow Analyzer recalls saved data that has been extracted from switches and routers and consolidated into a common format.
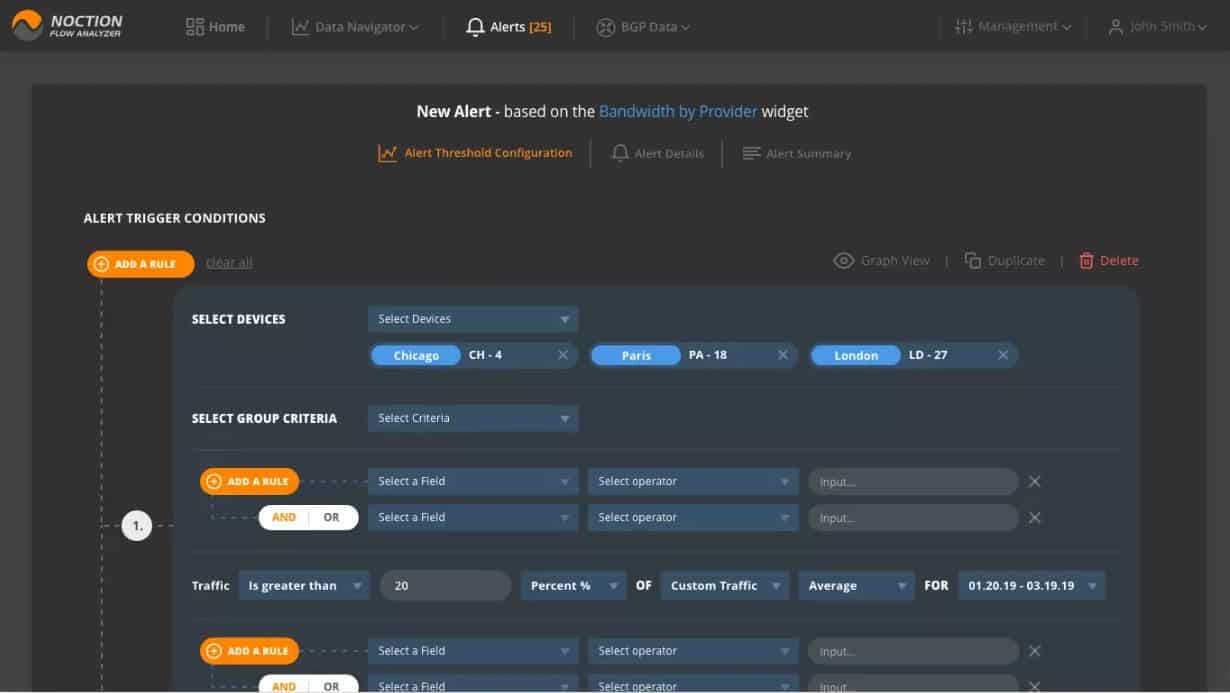
While the analyzer places interpretations on the retrieved data, there is a lot of interaction that the user can perform with this data. The screen allows for the user to specify the period from which the data is to be examined. There is a query facility within the screen, which enables the user to filter and sort traffic records.
The analysis tools enables the user to identify traffic by protocol, source, and destination address, VLAN, mask, etc. The information can be linked to the device that provided it and it is possible to link together data from several switches, creating a view of the complete path between two endpoints.
With the information gleaned in the Flow Analyzer, you would be able to identify the different trend growth rates in traffic volume per protocol and work out future capacity requirements. Comparing these needs with the existing bandwidth of each link, you will be able to replan the network in order to cater to those expected capacity requirements.
The BGP Sankey and BGP Report sections in NFA, offer a way to visualize BGP traffic volume and routing details. Users can review traffic volume distribution by different paths, find new peering candidates, see any other details using a long list of filters.
The network performance monitor uses a system of performance thresholds, which the user can activate on any of the metrics reported on in the monitor. These thresholds denote a level of performance that would indicate an evolving problem. The thresholds should be set at levels that allow technicians time to head off the problem before it becomes serious.
If a threshold gets crossed, the monitoring system raises an alert, which appears in the screen of the Flow Analyzer dashboard and can also be forwarded by email or Slack to technicians to draw them back to the dashboard.
Who is it recommended for?
This service is suitable for larger companies. The price tag puts the system out of the reach of small companies. The system includes network optimization and traffic shaping assistance to get better service from existing infrastructure. You can use traffic capacity alerts with this tool but it isn’t meant for ongoing network monitoring.
Pros:
- Does an excellent job at creating insights and statistics from network information gathered
- Best suited for Linux environments
- Offers Juniper-specific templates
Cons:
- Can take some time getting used to all the features
Noction Flow Analyzer runs on Linux – specifically Ubuntu, CentOS, and RHEL. It is charged for by subscription with both a monthly and a yearly rate. Noction Flow Analyzer is available for a free trial.
5. Nagios Network Analyzer
Nagios began as a free network monitoring system, which is called Nagios Core and is still available. The premium version of Nagios is called Nagios XI. The developers of that system have also produced the Nagios Network Analyzer. It is possible to buy both Nagios XI and Nagios Network Analyzer together and get a discount. The two systems interact so you can combine functions and pool data from both applications.
Key Features:
- Infrastructure monitor
- Extensible with plug-ins
- VLAN tracking
Why do we recommend it?
Nagios Network Analyzer is a product of a well-known brand. Nagios Core and Nagios XI are two versions of a full stack monitoring service. The one aspect of system monitoring that these widely-used packages lack is traffic analysis and this tool fills that gap. The Network Analyzer uses J-Flow for data gathering.
One advantage of using the Nagios system is that the free Core version is used by a large community that develops extensions to the system and distributes them for free. The underlying engine of Nagios XI is the same as Nagios Core, so operators of the paid version of Nagios also have access to a library of free plug-ins that extend the monitor’s capabilities.
The Nagios stable of products are all written to run on Linux – specifically RHEL and CentOS. This network analyzer is able to communicate with equipment using the J-Flow protocol. The base Nagios system uses a proprietary messaging system to check on the health of network devices instead of SNMP. However, the Nagios system is still able to detect the existence of equipment on your network and log them. Nagios also gives you an excellent map of the network, which is updated automatically.
Both the map and the equipment inventory act as an index of devices, which give access to a detail screen for each. The Details screen gives a range of statuses on the attributes and operating health of that piece of equipment. This status polling of capabilities extends to a wide range of switch and router types including those manufactured by Juniper Networks.
Despite the fact that the main module of Nagios employs an alternative monitoring system to SNMP, the Network Analyzer module is capable of monitoring SNMP messages and receiving SNMP Traps. These provide alerts to the dashboard, which gives the users of Nagios Network Analyzer a second channel to monitor network equipment statuses.
Nagios Network Analyzer is able to collect J-Flow messages and also display live packets as they travel across the network. That packet data can also be stored to file for later access. When you read a packet file into the Nagios viewer, you will be able to get an overview of the types of traffic that your business generates. The analytical features of the analyzer include a Bandwidth Utilization Calculator, which will report on traffic by source type, origin address, or protocol. Those factors can also be combined. The calculator enables you to see which applications or activities generate the most traffic on the network. Leaving filters off gives you a full throughput replay that will enable you to examine which links of the network came under strain.
The traffic monitoring capabilities of the Nagios Network Analyzer include facilities for intrusion detection and data theft. The packet-level visibility of the tool will help you detect malware activity, and device vulnerabilities.
The analyzer can support traffic-shaping efforts, including QoS management for VLANs and high-volume applications, such as video conferencing.
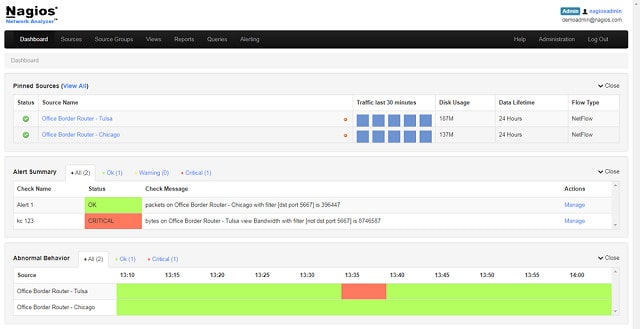
The Nagios dashboard includes visualizations, such as graphs, histograms, and pie charts, which make recognition of live statuses a lot easier. The dashboard can be customized and you can set up different consoles for different user accounts and user groups, which will enable you to give access to sets of controls and data views to different team members.
Who is it recommended for?
This package doesn’t just use J-Flow for packet analysis. It also has the ability to communicate with NetFlow and sFlow. The tool includes protocol analysis and it is possible to set traffic capacity thresholds for alerts, which implement continuous traffic monitoring. This package runs on Linux or on a VM.
Pros:
- Offers a free open-source version alongside a paid version
- Pricing is based on the number of flow exports, making it a flexible option
- Detailed reports and alerting options
- Can record live J-Flow traffic and replay it for further analysis.
Cons:
- Better suited for smaller networks
Nagios Network Analyzer is bought as a single license, or as a multi-user system. You can get a 60-day free trial of the system for evaluation.
6. SolarWinds Network Bandwidth Analyzer Pack
SolarWinds produces a range of network management tools that are all written on a common platform, called Orion. This means that it is possible to link together several products. The group includes cross-module features that really ramp up your network analyzing capabilities and the Network Bandwidth Analyzer Pack creates a perfect combination that beats all of the competition.
Key Features:
- Network device performance tracking
- Bandwidth analysis
- J-Flow, NetFlow, sFlow, NetStream, and IPFIX
- Wifi network analysis
- CBQoS tagging
Why do we recommend it?
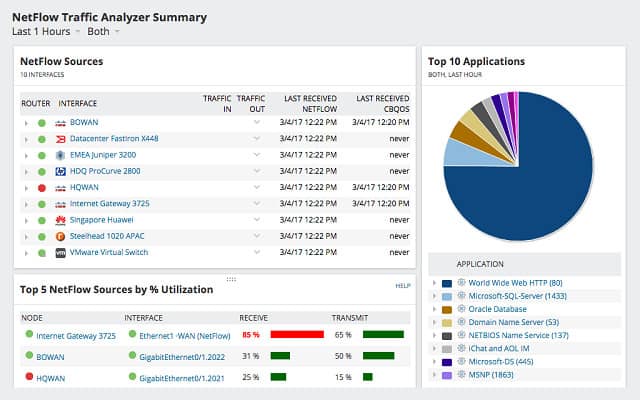
The SolarWinds Network Bandwidth Analyzer Pack gives you network discovery and device status monitoring and also provides traffic analysis. The bandwidth monitoring service is called the NetFlow Traffic Analyzer and it includes packet statistics data drawn from network devices with J-Flow. This system can also sample packets.
With this combination of the company’s NetFlow Traffic Analyzer and its Network Performance Monitor, you get SNMP monitoring to track the health of your network devices as well as traffic analysis capabilities.
Both modules include a series of sensors and you can choose which of these to activate. Don’t be put off by the name of the analyzer because the NetFlow Traffic Analyzer has more than just NetFlow capabilities. The system can interact with network equipment using J-Flow, just as easily as it can with NetFlow. It is also able to communicate with sFlow, NetStream, and IPFIX, so if you have a multi-vendor environment, you will be able to pick up data from all of your equipment.
The analyzer will help you monitor link data capacity and throughput and also watch end-to-end traffic scenarios. The tool is capable of tracking flows between sites, too, so if you operate a multi-site WAN, you can centralize all of your traffic analysis tasks at one location. The visibility on traffic also extends to Cloud services. There are a number of great features of the analyzer that require input from the Network Performance Monitor. These include the NetPath utility, which gives you a critical path analysis, with visualizations to help you look out for different hazards and bottlenecks on the various routes through your network. The PerfStack module lets you watch the performance of a range of interdependent hardware and software elements with live data flowing through each monitor. The performance graphs stack on top of each other on one screen, so you can instantly see where congestion, collision, or delays are being generated on a per-app basis.
A wireless monitoring feature extends your traffic stats off the wire and into the air. The Network Performance Monitor also includes a great wifi heat map graphic to which you can feed in your office plans and get a real-life view of your signal footprint. Network mapping is a really strong feature of the Network Performance Monitor. Out of the box, the tool will gather information on all of your network devices, not just your Juniper equipment. It gets those devices in a monitoring list and gives you instant live feedback on device statuses. The network map is plotted automatically from those initial discovery routines and gets updated instantly when equipment is added, deleted, or moved.
Those mapping capabilities get enhanced with J-Flow data so you can see instantly from the network visualization which links are heavily-loaded and which are being underutilized. The analysis functions give you great visualizations of applications and protocols that place the most load on your network, both as a live report and as a capacity planner based on historical data.
Once you have a better idea of your traffic load, you can use the extended management capabilities of the NetFlow Traffic Analyzer to implement CBQoS tagging to optimize your existing resources. You can squeeze extra performance out of your infrastructure and avoid expensive and needless additions to your hardware inventory.
The dashboard of this unified monitoring pack is customizable and password-protected. So you can set up different user groups and individual accounts that have access to different levels of data views and controls. That’s great if you have a team of varying experience and capabilities to help you monitor your network. It even enables you to give non-technical management limited access to performance views and the reporting tool for presentations.
Dashboard elements include dials, graphs, pie chart, histograms, and live data graphs and any of these can be added to printed reports or placed on presentational browser-based intranet pages. The system generates alerts from the SNMP messages that it processes. You can also customize alert-generating events and include J-Flow data into the triggers. Alert notifications can be tailored to be sent out to specific team members according to source and severity and they will appear on that team member’s dashboard as well as being sent as SMS or email alerts.
Who is it recommended for?
This pack is suitable for large businesses with extensive networks. The system’s J-Flow capabilities will communicate with devices from Juniper Networks and the monitor can also use sFlow, NetFlow, IPFIX, and NetStream to communicate with devices from other providers. So, the package can cover a multi-vendor network.
Pros:
- Supports multiple protocols like NetFlow, great for monitoring Cisco equipment
- Both tools work well alongside each other to help view traffic patterns and bandwidth usage
- Easy-to-use interface automatically highlights bandwidth hogs and other network traffic outliers
- Scales well, designed for large enterprise networks
- Can view traffic on a per-hop basis, allowing for granular traffic analysis
Cons:
- Built for enterprise use, not designed for small home networks
This is the top-of-the-line package that is really best suited for team-managed large networks. The system installs on Windows Server environments and you can test the pack with a 30-day free trial.
The pack includes the Network Performance Monitor and the NetFlow Traffic Analyzer systems. These two tools are written on a common platform and slot together seamlessly to offer all of the monitoring and management tools that a network manager needs.[/ctech_editors_choice]
7. Opsview Monitor with Opsview Network Analyzer
Opsview is a full-stack monitoring package that includes a network traffic analysis module. There are three editions for this system: Cloud, Enterprise, which is an on-premises package, and SMB, which is designed for use by businesses with up to 300 endpoints. The Cloud and Enterprise editions can monitor more than 50,000 endpoints.
Key Features:
- IP SLA tracking
- J-Flow, sFlow, and NetFlow
- Free version
Why do we recommend it?
ITRS Opsview is closely tied to Nagios because the package accepts Nagios plug-ins. For the purposes of J-Flow monitoring, that option is not much help because there aren’t any J-Flow monitoring add-ons in the Nagios Exchange. However, the core Opsview package includes a traffic analyzer that has J-Flow capabilities.
Opsview was developed from a collection of Nagios Core plug-ins and it is still compatible with Nagios, so it can be extended by any add-on that is compatible with Nagios Core. The Opsview Enterprise software runs on Linux – specifically CentOS, Debian, RHEL, and Ubuntu.
The Opsview Monitor is able to administer networks, servers, and software whether they are located on premises, on the Cloud, or at remote sites. The monitor integrates SNMP procedures to discover and monitor network equipment. An initial system sweep assembles an inventory and repeated polling keeps that registry updated. The data provided by the inventory gets automatically interpreted by Opsview into a network map, which is kept up to date according to any equipment changes. The dashboard of Opsview Monitor displays live statuses of devices on the networks. SNMP traps get shown on the dashboard as alerts.
The Opsview Network Analyzer has J-Flow capabilities. It is also able to communicate with devices through NetFlow and sFlow. The analyzer treats J-Flow as NetFlow messages because the two systems are fully-compatible. So if you opt for NetFlow monitoring, you will also get J-Flow capabilities. This will enable you to integrate our network analysis procedures for all types of network equipment, no matter who manufactured it. So if your equipment is not all supplied by Juniper Networks, you can still gather data across the entire infrastructure.
Monitoring for IP SLA factors (jitter, latency, Mean Opinion Score, and packet loss) can be preset according to your network policies and acceptable tolerance levels. You can set your own performance thresholds and create alerts for whenever these are breached.
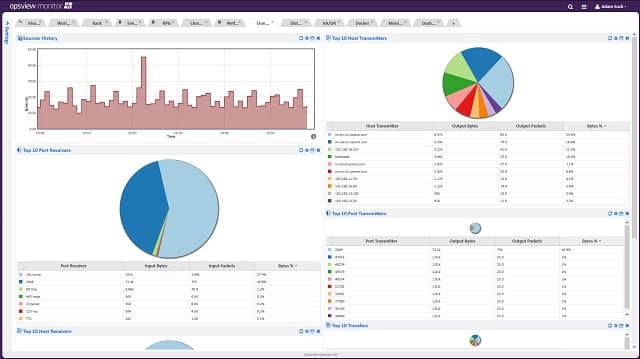
The traffic analyzer can display live J-Flow packet captures or you can store those packets to file for mass evaluation offline. The packets can be grouped by source, protocol, or destination, enabling you to rank traffic generators and work out where all of the demand on your network comes from. This will also help you to introduce traffic-shaping measures via queuing strategies, such as Class-Based QoS.
The traffic analyzer is able to compare equipment capacities with actual traffic volumes to highlight bottlenecks in the network. The dashboard uses graphical representations to clearly demonstrate traffic patterns and equipment limits.
Reports can be taken from the system in PDF, XLSX, ODT, HTML, or XML formats. Notifications can be sent via SMS, email, or Slack messages and can also feed statuses into your Help Desk system.
This is a comprehensive and award-winning network monitoring tool that gives the industry leaders a reason to worry.
Who is it recommended for?
The three editions of the Opsview system make the monitoring service accessible to businesses of all sizes. The SMB plan will appeal to small businesses and very large organizations can choose whether to opt for the SaaS package or run the Enterprise edition on their own servers.
Pros:
- Supports J-Flow, NetFlow, and sFlow monitoring.
- Clean, easy-to-use interface
- Integrated into a full stack monitoring package
Cons:
- The Free edition has been discontinued
The SMB plan is supplied as a core package with add-on options and the Network Analyzer service is one of those extras. The Cloud and Enterprise plans include all modules. You can get a free trial of the Cloud edition.
8. Plixer Scrutinizer
Plixer Scrutinizer is a stand-alone traffic analyzer that doesn’t form part of a general network management system. The system can be implemented as a hardware device, as on-premises software, or as a Cloud service. The on-premises software has to be installed on top of a virtual machine system. It runs on HyperV, VMWare, and KVM.
Key Features:
- IP SLA tracking
- J-Flow, IPFIX, NetStream, and NetFlow
- Free version
Why do we recommend it?
Plixer Scrutinizer is a network traffic analyzer with traffic stress testing options and sampling protocols, such as J-Flow. This is a comprehensive package that gathers data for ongoing historical performance analysis and capacity planning projections. Deployment options include a SaaS package or an on-premises virtual appliance.
Scrutinizer is primarily a data collector and it will use J-Flow in order to gather traffic examples and statistics. The collector can also work with NetFlow, IPFIX, and NetStream. The collector is also able to gather data from firewalls, servers, and wireless APs.
The main purpose of Scrutinizer is to store data streams for collective analysis. Live data passing through an analyzer doesn’t always give a complete picture of events because a packet-by-packet examination can’t spot intrusion anomaly signatures that are split across packets. So, the storage of packet data can lead to better analysis that reveals malicious activity as well as network infrastructure performance.
Scrutinizer uses several simultaneous sources of data on a network rather than collecting data from just one device. This gives a wider perspective on network performance because it is able to track the effects of a traffic surge that passes through the entire network, or just a few links. This multiple view can also give a clear insight into how other parts of the network behave while a congested link or overloaded device are coping with excessive volume.
The Scrutinizer system of collecting data from several network points simultaneously produces a large volume of data, so the database element of Scrutinizer has to be able to process, sort, and filter data at high speeds. The Scrutinizer analytical programs are able to work quickly through data to report on network performance issues within a meaningfully useful space of time.
Scrutinizer is sold on a subscription model with four service levels. The entry-level version of the package is free to use. However, it has volume limits and doesn’t include all of the utilities that the full Scrutinizer package provides. The three higher-level plans can be accessed for free on a 30-day trial.
Paid plans allow you more time to collect data in a study session and include longer storage periods. The ability to schedule data collection and reporting is also an extra that is only available to the paid plans. All plans include multiple user accounts, but the free version only allows two of them. The highest plan allows unlimited user accounts. The grades of four plans are designed to match enterprises of different sizes, so the free plan would create a monitoring system for a small enterprise.
The Scrutinizer system is certainly a good option for administrators who already have a network management system, but need to get analytical software that works independently of the standard operating network monitoring tool.
Who is it recommended for?
This system will collect traffic data with NetFlow and sFlow as well as J-Flow. Therefore, the package can be used for the analysis of multi-vendor networks. The package also includes network discovery and endpoint risk scoring. This package is more suitable for large companies and is too pricey for small businesses.
Pros:
- Simple yet effective dashboard and widgets
- Can run in multiple virtual environments
- Supports NetFlow, IPFIX, and NetStream alongside J-Flow
Cons:
- Isn’t designed for live analysis of J-flow data
Testing Traffic Analyzers
This guide includes a range of options for network analysis with J-Flow. If you are in the market for a new network monitoring system and you have Juniper Networks equipment on your network, you should pay close attention to the tools at the top of our list. Your exact choice will come down to which of the other functions those monitoring packages provide and also the size of your network.
If you have no intention to change your existing network management tool, then the Plixer Scrutinizer system would be a very good option that could give you effective insights into traffic patterns on your network.
Fortunately, all of the tools listed in this guide offer free trials or give free versions for testing or perpetual use by small networks.
Give the tools on this list a trial and make the most of the J-Flow capabilities of your Juniper Network devices.
J-Flow monitoring FAQs
What is J-flow?
J-Flow is a traffic recording system that is built into network devices that are produced by Juniper Networks. Accessing the records of J-Flow enables a bandwidth monitoring tool to measure traffic flows around a network and segment that data by such factors as source and destination and protocol. This collection of J-Flow data allows traffic analysis to identify bottlenecks on the network and spot devices that do not have the capacity to process all of the traffic that is sent to them.
How does JFlow work?
J-Flow records details of each packet that passes through a Juniper Networks device. The protocol doesn’t copy the packets or scan the contents of the payload. Instead, it gathers statistics about the packets, mainly derived from their headers, and what happened to them. These statistics are stored on the router and enable collection by an external system.
What is j-Flow in Juniper?
J-Flow is a statistics gathering package that is built into the network devices produced by Jupiter Networks. This is a very similar system to NetFlow, which was created by Cisco Systems, and NetStream, which is a proprietary protocol created by Huawei. Industry standards sFlow and IPFIC are other systems that perform the same task.

