AIOps platforms combine IT operations tools with advanced data management systems.
Not every business is the same and so off-the-shelf system management tools often need to be tailored before they work properly, Artificial Intelligence can make those adjustments automatically, making it easier for monitoring and management suppliers to deliver useful services.
Here is our list of the best AIOps platforms:
- ManageEngine Analytics Plus EDITOR’S CHOICE This package provides a data-gathering service that enables performance analysis for capacity planning and service improvement. Available as a SaaS package or for installation on Windows Server or Linux. Get a 30-day free trial.
- ManageEngine OPManager Plus (FREE TRIAL) Combines AIOps with comprehensive network monitoring, making it ideal for businesses of all sizes. Get a 30-day free trial.
- Site24x7 (FREE TRIAL) This SaaS platform provides system monitoring and management modules that include full-stack observability links between units and machine learning thresholds for performance tracking. Start a 30-day free trial.
- Datadog APM A package of IT system monitoring and management tools that include AI-driven system mapping and root cause analysis modules. This is a cloud-based service.
- LogicMonitor A cloud-based monitoring system that maps all hardware and logs all software, creating dependency maps to facilitate AI-based root cause analysis.
- Dynatrace This cloud-based AI-driven monitoring platform is particularly strong at identifying the services that underpin websites and Web services.
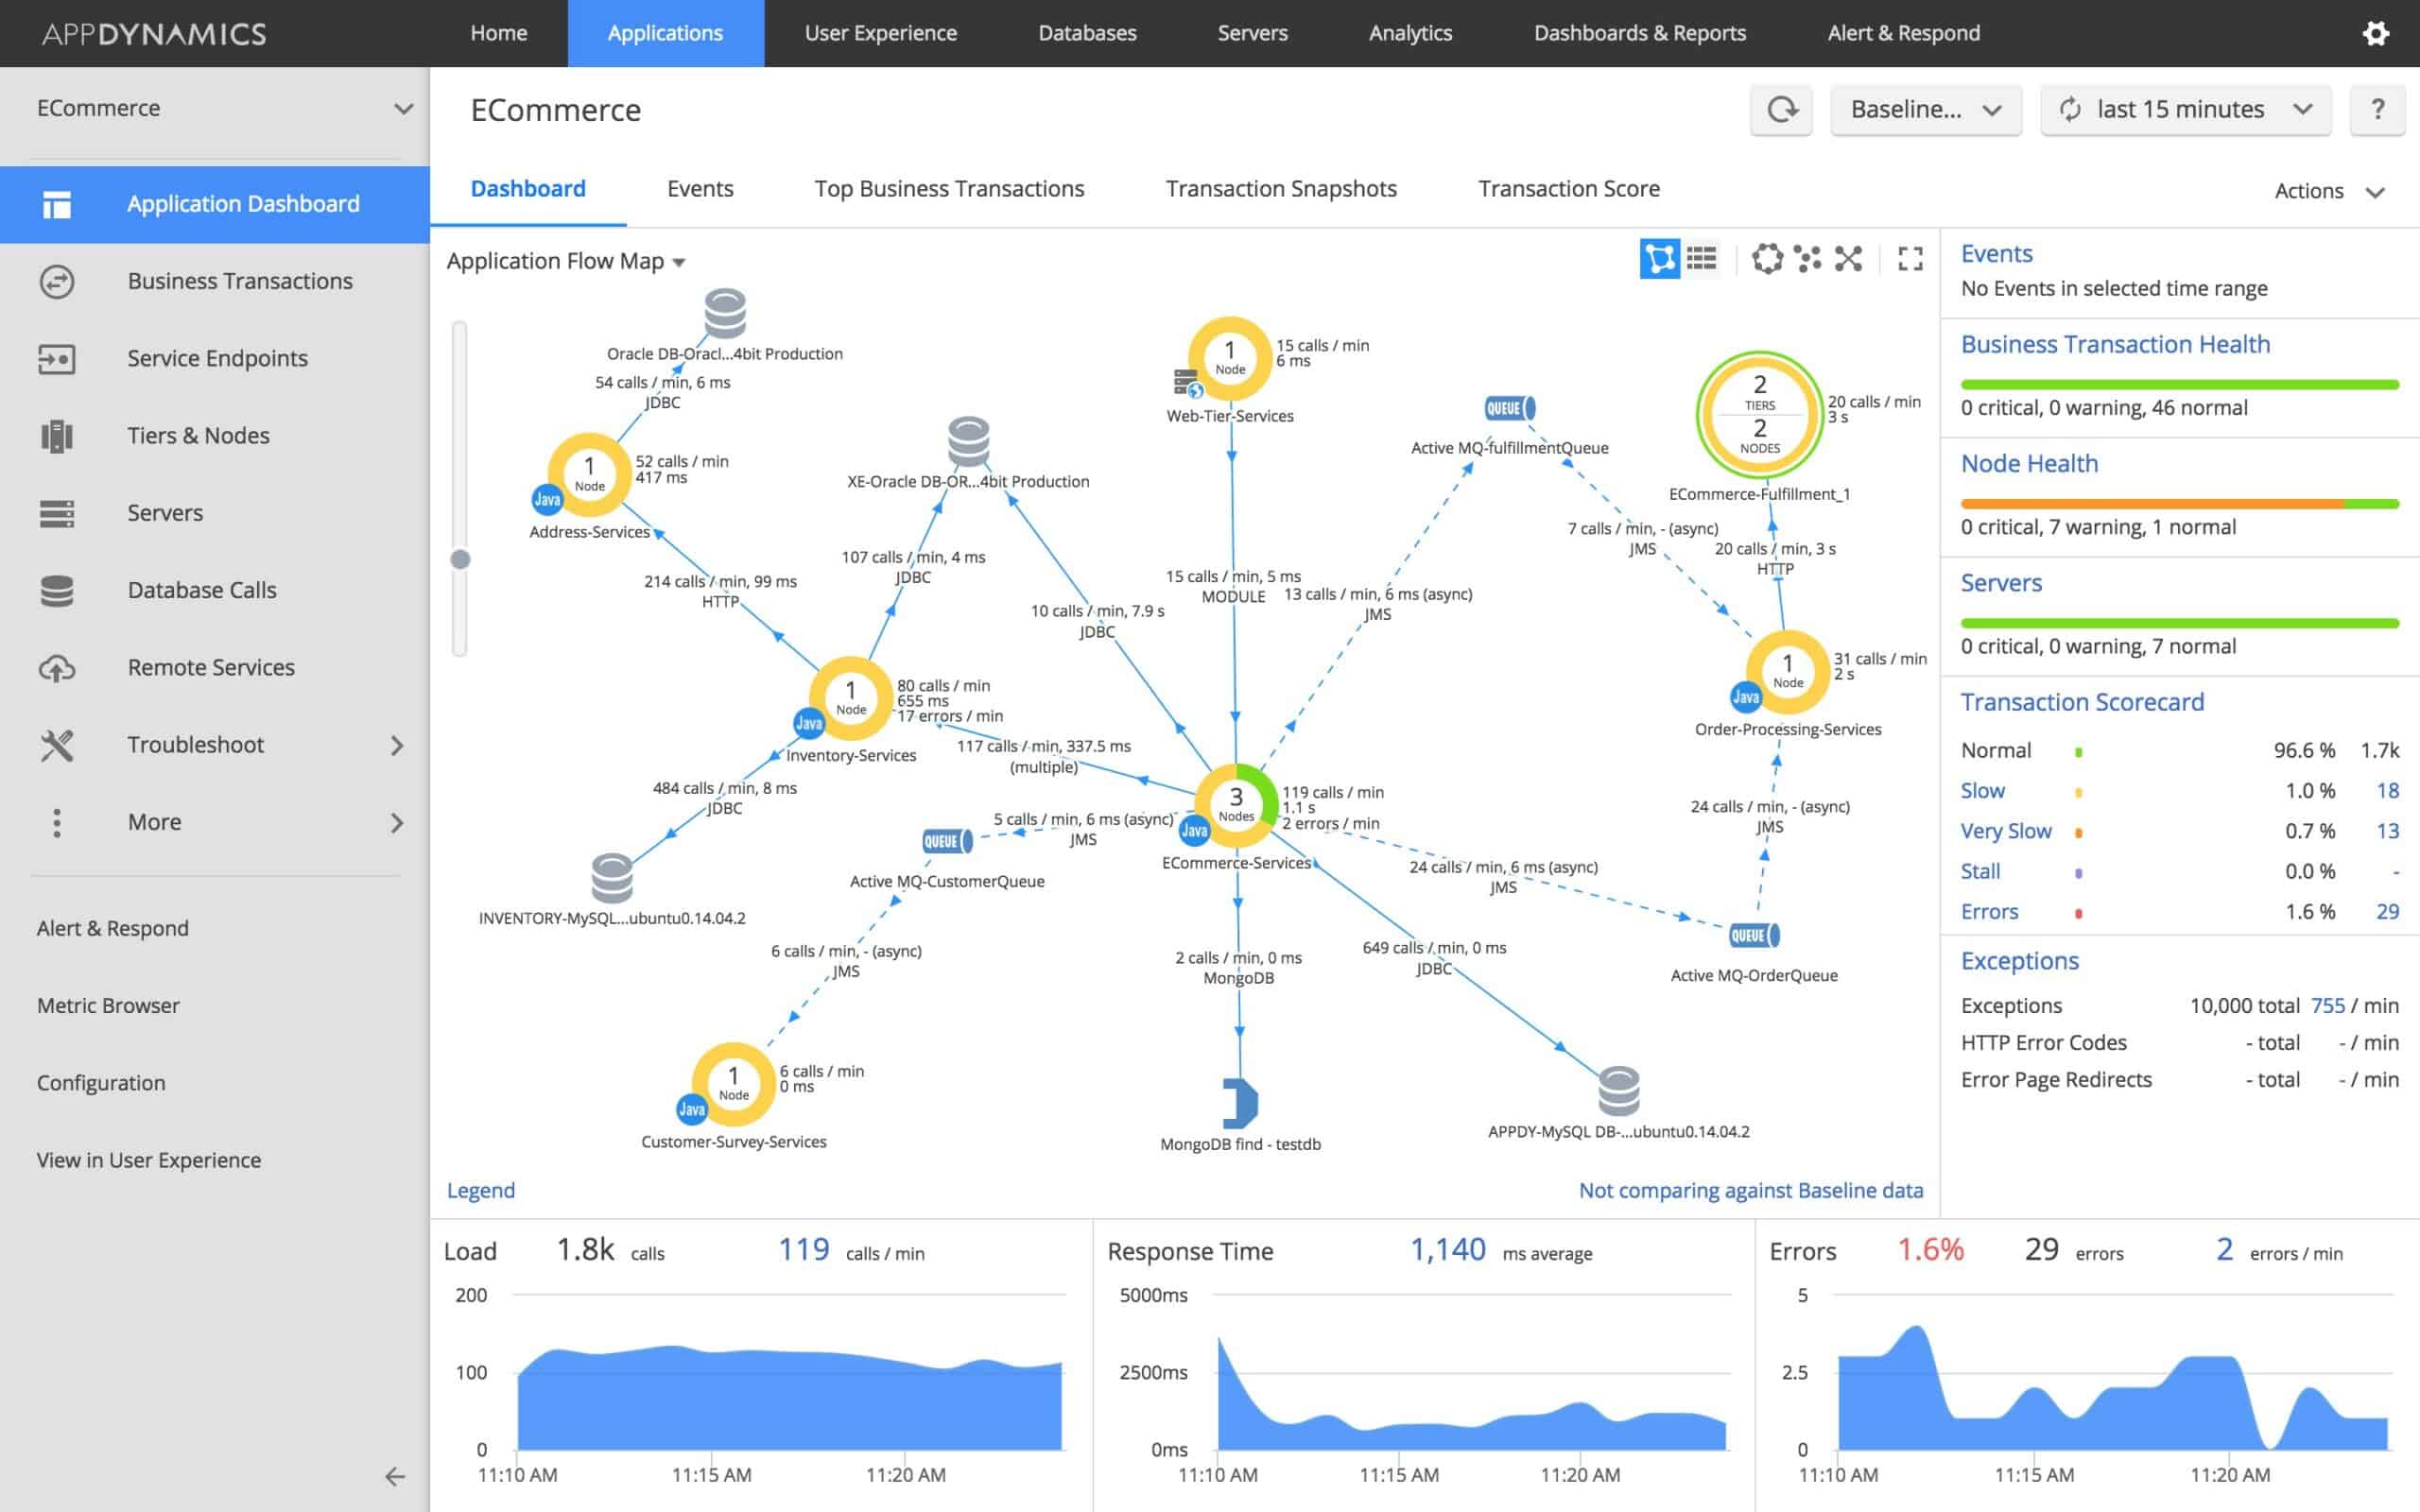
- AppDynamics A cloud-based monitoring platform that tracks activity within a system in order to spot the ripple effect of one problem impacting other system areas.
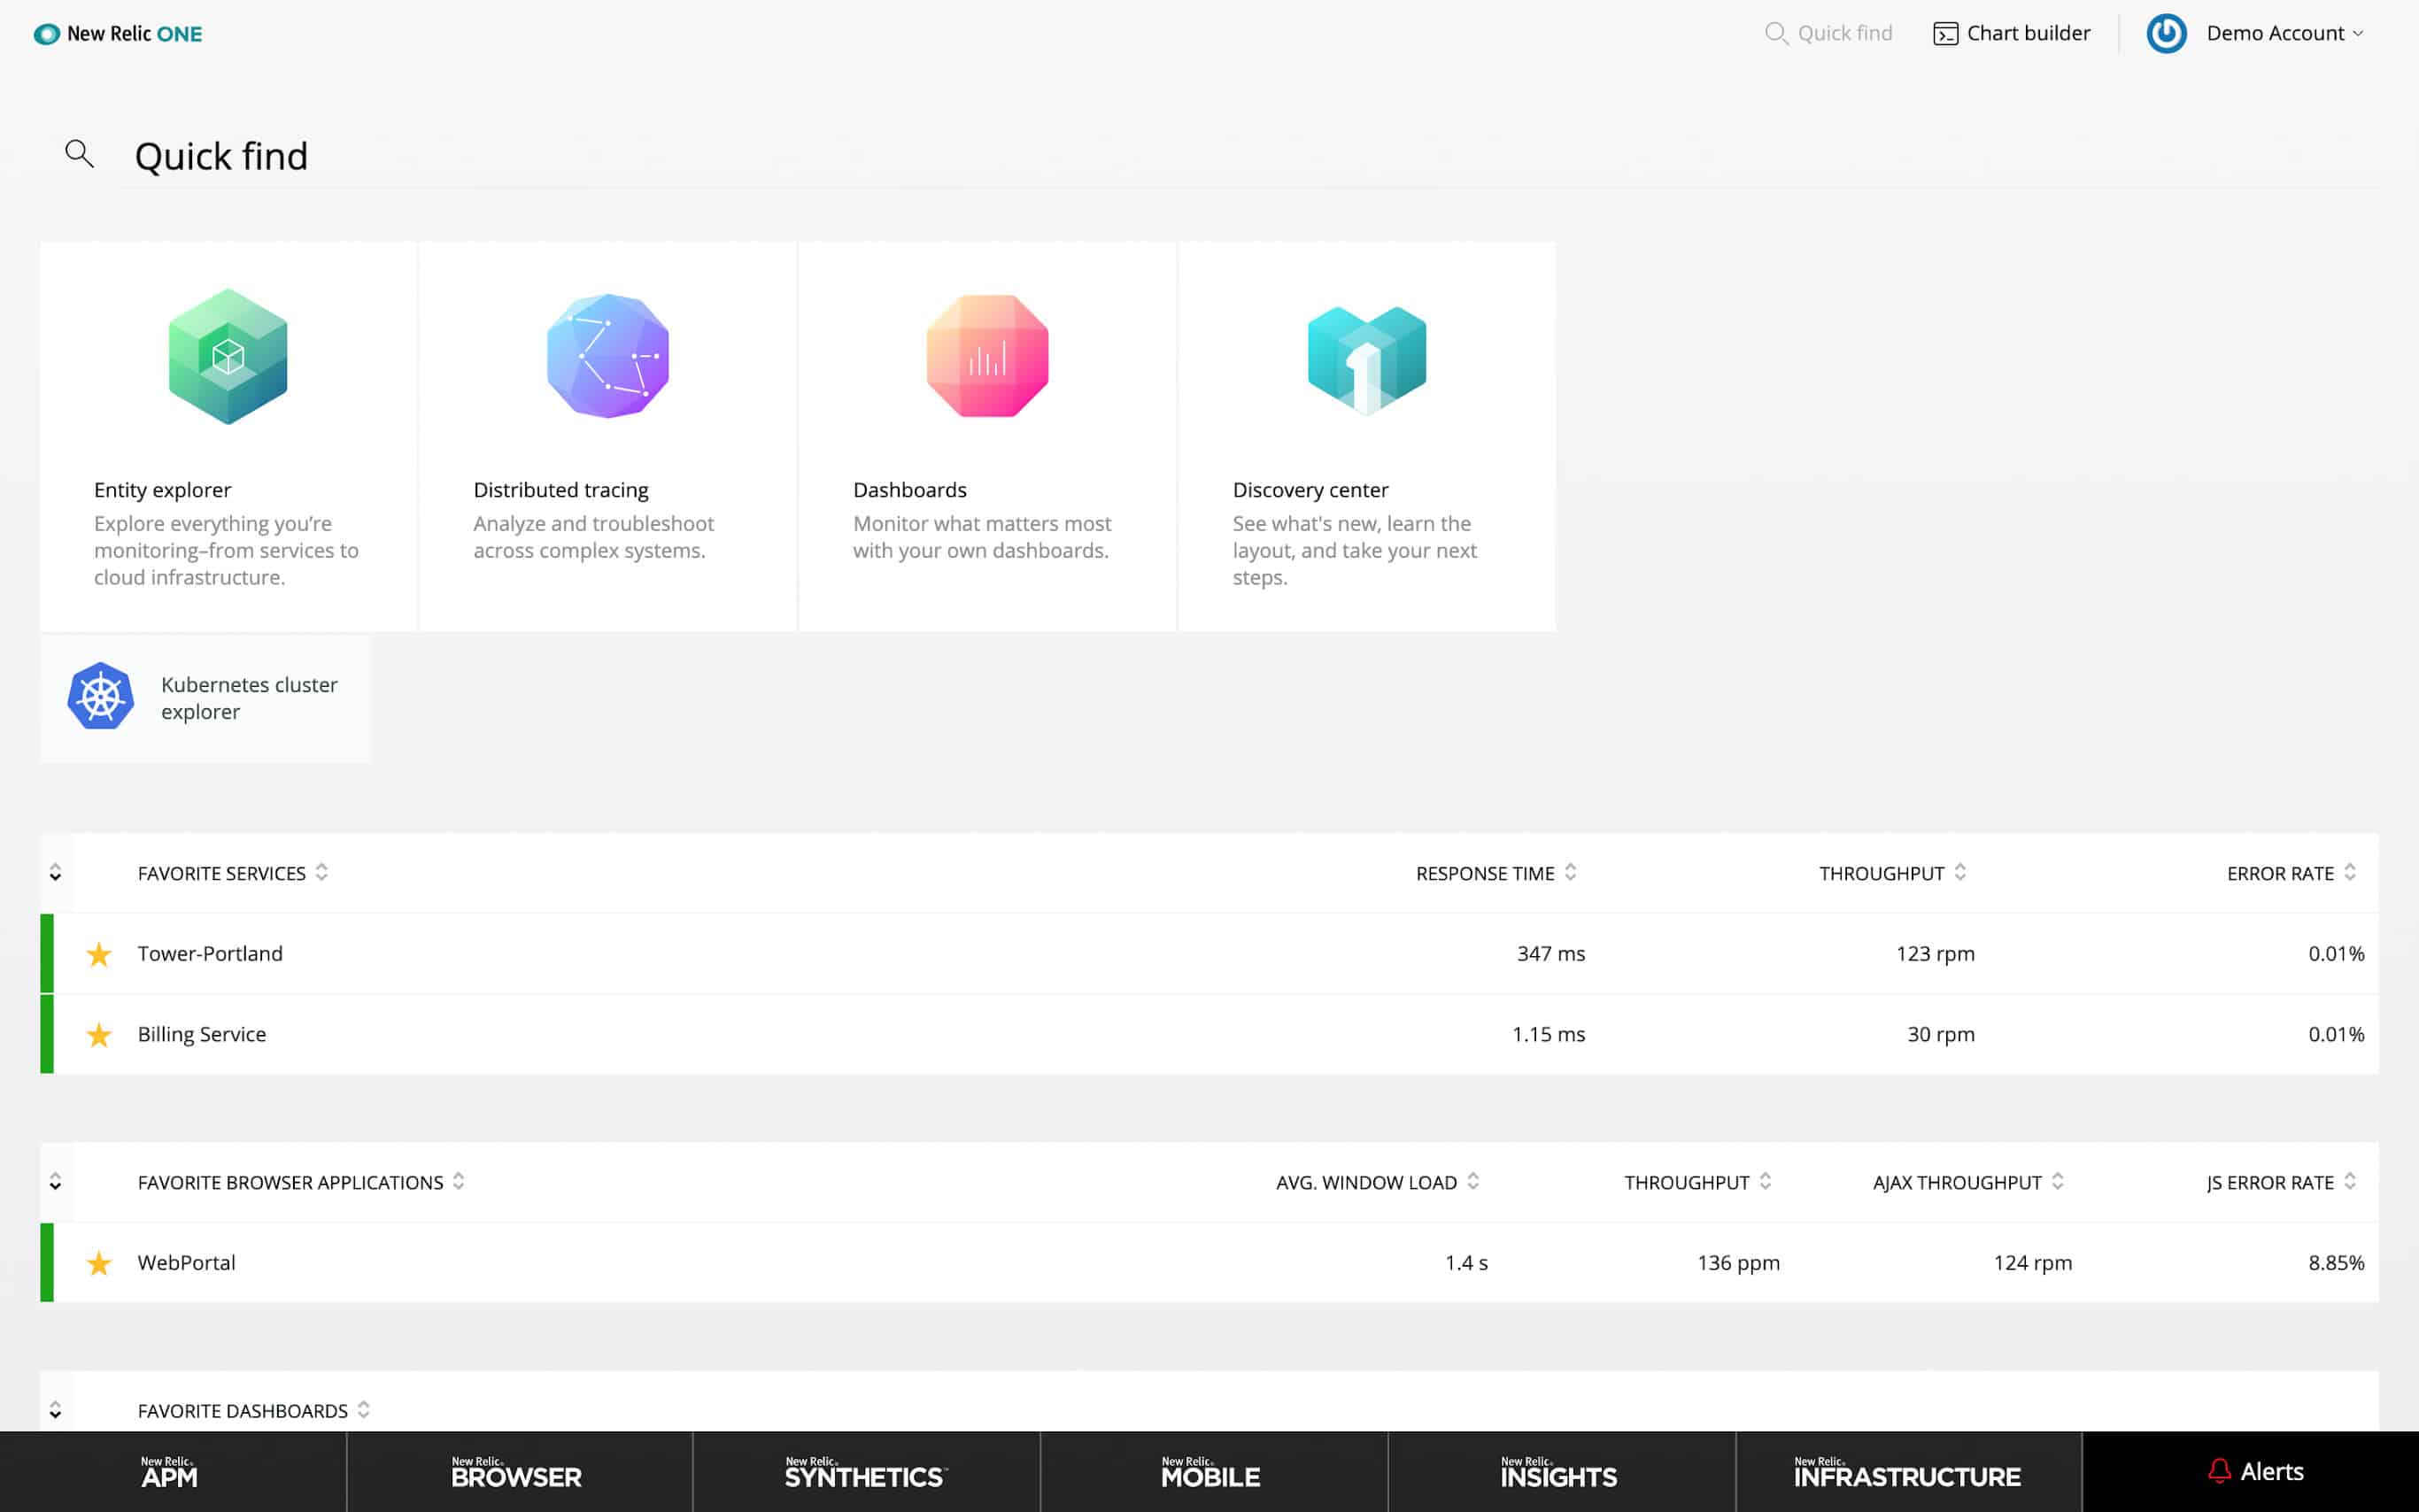
- New Relic This platform deploys AI to create a system monitoring service that is particularly adept at viewing the application stack. This is a cloud-based service.
AIOps Techniques
AI techniques are particularly useful in two areas of IT operations:
- Systems management
- Root cause analysis
Systems management
The interconnection between different IT services can be difficult to track. The knock-on effect of an issue in one area of operations can only become apparent when performance problems arise in a different part of the system.
System management and root cause analysis present the same issues from different perspectives. System management involves spotting system issues when they first arise, preventing them from propagating through to performance problems. Root cause analysis starts at the other end of the pipeline, beginning with a performance problem and chaining through the app stack to identify the true issue.
AIOps for system management not only prevents problems from arising, but it maps systems from software through to hardware components. This lays down paths to investigation. Properly documented systems are much easier to analyze. System mapping services that form part of an AIOps platform speed up problem resolution because the root cause analysis module already has system information available. Thus, it can cut out that first phase of the investigation.
Root cause analysis
Spotting the real cause of a problem can be a hopelessly time-consuming task in modern systems that include so many layers of services. Usually, the component that experiences a problem isn’t necessarily going to be the cause of the problem.
As they are user-facing, software packages will always provoke more complaints about poor performance than underlying services. So, initial reports of performance problems are only starting points for investigation.
Drilling through manually to the real cause of problems is difficult because it requires the full range of system management skills. Troubleshooting ends up being a team effort, requiring skills from many different technical specialists. Unfortunately, highly skilled staff are in short supply and are also very highly paid.
AIOps platforms distill expertise and store possible solutions to a myriad of problems. The fundamental structure of AI programs is a method of heuristics, based on probability. Essentially, the very structure of AI involves exploring decision trees – if A is happening, it could be X (50 percent), Y (40 percent), Z (5 percent), as yet unknown (5 percent). That method of operation maps exactly the question-and-answer format that IT operations technicians go through when investigating problems.
The “as yet unknown” option is a key characteristic of AI systems because it accounts for all situations. The system isn’t useless if it encounters a problem that has never arisen before. It just identifies an area that requires further research. If a system can provide a solution nine times out of ten, it has saved a lot of time and effort. Those unusual events will need human intervention but the results of that investigation can be fed into the AI system so that human involvement won’t be needed if that rare occurrence happens again.
So, AIOps platforms are very beneficial to incident management scenarios because they provide the knowledge base of many specialists to one operator who doesn’t necessarily need to have any technical knowledge in order to solve problems. They also minimize the involvement of specialists down to rare incidents and record the solution for next time.
Taking that provision of expertise one step further, it isn’t even necessary to have that operator there to use an AI-guided analysis service. Proactive monitoring tools, working constantly, can get triggered automatically by performance thresholds and produce recommendations for technician intervention where required. Thus, system management and root cause analysis features in an AIOps platform work together to save time and money.
Characteristics of AIOps platforms
The term “platform” implies more than just a piece of software. A platform is a suite of tools that interact with each other. In many ways, a platform is much like an operating system because many of those tools act as services that aren’t directly accessible. Other tools are interfaces, that select services according to user requests and actions.
An AIOps platform has AI processes running all the way through its stack. An AI-driven interface interacts with AI-based services to provide a solution. Some AIOps platforms provide APIs and plugins for other systems, so the user doesn’t necessarily need to log in to the platform in order to benefit from its services.
There are a number of characteristics that identify AIOps platforms:
- A suite of tools
- Machine learning capabilities
- Shortcuts to processing large volumes of data
- Stored solutions
- Data access interface
- Decision trees
- Natural language querying
- Interfaces to third-party systems
There is now a range of delivery options available for AIOps platforms and their capabilities are varied. There are many cloud platforms available now, so you don’t necessarily need to wonder about which system will run on the operating system of the servers that you have on your site. In fact, if you run an entire virtual system, you might not have your own servers on-site.
AIOps systems also need to be able to explore Cloud-based resources. You might have wireless networks on-site and you might also need to include performance monitoring for more remote sites or devices used by remote workers.
These services are all very similar and so you will need to try them out for yourself in order to decide which is right for your system. We have narrowed down the candidates to a very short list in order to save you assessment time. You can read more about each of these AIOps platforms in the following sections.
The Best AIOps Platforms
What should you look for in an AIOps platform?
We reviewed the market for AI-based system management tools and analyzed the options based on the following criteria:
- Artificial intelligence must be at the core of the system monitoring tool
- A root cause analysis module that enables fast problem identification
- Predictive capacity problem identification to catch issues before they occur
- An application dependency discoverer and mapper
- Alerts for unattended monitoring
- A free trial or a demo offer to enable testing before taking out a subscription
- Value for money, represented by an innovative and cost-saving service at a fair price
Using this set of criteria, we looked for AIOps that can reduce the complexities of managing inter-dependent systems, some of which might be hosted by third-party companies.
1. ManageEngine Analytics Plus (FREE TRIAL)
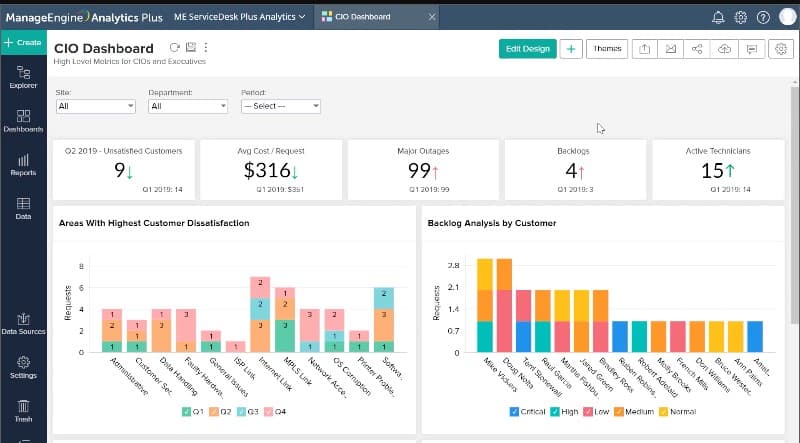
ManageEngine Analytics Plus is a system assessment service that is useful for analyzing capacity requirements, standards compliance, security breaches, and performance problems. Rather than a live monitoring tool, this system is intended to look into what happened and project, with the AI features in the tool, what capacity and services will be needed in the near future.
Key Features:
- Full Stack Observability: Networks, endpoints, software, and cloud platforms
- Service Delivery Assessments: Performance analysis
- Compliance Requirements: Enforces GDPR and HIPAA
- Operation Problems analysis: Alerts for errors
- Capacity Predictions: Assists with infrastructure planning
Why do we recommend it?
ManageEngine Analytics Plus gathers IT operations data into a single access point and then gives you the tools to derive deeper insights through correlation and time series data points. Choose to identify costs, demand, resolution times, or any other operational factor with this tool that has an AI engine behind it.
The analyzer gathers event statistics from your network, endpoints, and applications. This data is refreshed at one-hour intervals and so it is not intended for use as a live monitoring package. The analysis features are intended to provide insights into user demand, system performance, security problems, and asset utilization.
Operations managers and finance teams use this tool to see what budget is going to be needed to expand infrastructure or what existing services are underutilized and can be scaled down. The analyzer is able to assess the usage of cloud services, such as virtual server space, as well as on-premises infrastructure.
This tool integrates with other ManageEngine packages to fully exploit data availability. Monitoring systems that are compatible with Analytics Plus include Service Desk Plus, OpManager, Applications Manager, and Mobile Device Manager Plus. It is possible to specify in the settings of the analyzer if you need to comply with GDPR or HIPAA. This specification will trigger special routines in the package to identify divergence from the chosen standard.
Who is it recommended for?
IT operations managers will need this tool to check on budget targets, plan staffing, or target service level agreements. As such, it would be a particularly handy tool for MSPs so that they can measure their own activities rather than that of their clients. This package is available as a SaaS platform or software for installation on Windows Server or Linux.
Pros:
- Deployment Options: Available as a SaaS package or for an on-premises installation
- Service Level Agreement Management: Conformance analysis
- Compliance Assessments: For HIPAA and GDPR
- Attractive Documentation: Creates presentations and reports
- Useful for Project Planning: Also budgeting and activity tracking
Cons:
- A Large System: Requires a lot of setup to get the best out of the package
ManageEngine provides the Analytics Plus system as a SaaS package on a monthly subscription or you can buy a perpetual license for installation on Windows Server or Linux. Either format is available for a 30-day free trial.
EDITOR'S CHOICE
ManageEngine Analytics Plus is our top pick for an AIOps platform because this comprehensive system provides analytical tools for operations, change management, financial assessments, and marketing specialists. You can get near-live data on all of the operations of a working system, identifying where problems arose either in performance or security. Use this information to plan changes to your service and ensure those issues don’t occur again. Spot where you have over-provisioned on resources and identify demand growth to plan for expansion. The tool is also useful for planning projects and monitoring their progress. Governance and compliance with HIPAA and GDPR can also be enhanced by this tool.
Download: Get 30-day FREE Trial
Official Site: https://www.manageengine.com/analytics-plus/
OS: SaaS, Windows Server, and Linux
2. ManageEngine OPManager Plus (FREE TRIAL)
ManageEngine OPManager Plus enhances IT management with advanced AI and ML algorithms, making operations faster and less complicated. Its AIOps capabilities include data gathering and noise reduction, filtering out irrelevant information to help IT teams detect incidents early and manage alerts efficiently.
Key Features:
- AIOps Integration: Leverages AI to streamline IT operations and enhance performance.
- Comprehensive Network Monitoring: Monitors network devices, servers, and applications from a single interface.
- Customizable Dashboards: Allows for the creation of personalized dashboards to display critical metrics.
- Automated Workflows: Simplifies routine tasks with automated workflows, improving efficiency.
- Root Cause Analysis: Quickly identifies the root causes of network issues using advanced analytics.
Why do we recommend it?
ManageEngine OPManager Plus is highly recommended due to its robust AIOps capabilities, which greatly enhance IT operations. The tool provides AI-driven insights that help prevent issues before they occur, ensuring smoother network performance. Additionally, its automation features streamline routine tasks, saving time and improving efficiency.
Real-time notifications integrate with tools like Slack and Microsoft Teams, reducing downtime and improving network efficiency. The platform also offers root cause analysis and cross-domain correlation, providing deep insights into network performance and enabling quick issue resolution. Additionally, its automated remediation and capacity planning features ensure proactive management and resource optimization.
Who is it recommended for?
ManageEngine OPManager Plus is perfect for IT departments in medium to large enterprises. It offers a comprehensive and scalable network management solution that meets the demands of growing networks. Its advanced AI capabilities make it especially valuable for organizations seeking to improve their IT operations through intelligent automation and predictive analytics.
Pros:
- AI-Driven Insights: Provides intelligent insights and predictions, helping to prevent issues before they occur.
- Scalable Solution: Scales easily with growing network demands, making it suitable for businesses of all sizes.
- User-Friendly Interface: The intuitive design makes navigation and operation straightforward for users.
- Extensive Reporting: Offers detailed reports that help in analyzing network performance and identifying trends.
Cons:
- Steep Learning Curve: Some advanced features may have a steep learning curve for new users.
3. Site24x7 (FREE TRIAL)
Site24x7 is a cloud platform that reaches out to sites and cloud platforms through the installation of agents to implement system monitoring and management services. This entire platform scans, discovers, and maps assets, including networks and application dependencies. This system documentation enables the service to predict potential service bottlenecks and resource shortages, which amounts to an AI-based inference of demand to support IT operations management.
Key Features:
- Predictive Alerts: Forecasts resource needs
- Machine Learning: Identifies demand trends
- Forecasting: Uses dependency mapping
- Bridges the Service Stack: Monitors all IT assets
Why do we recommend it?
Site24x7 is an entire platform providing full stack observability and system management tools that integrate AIOps and MLOps into its processes. The core of the Site24x7 system is its discovery service that creates an asset inventory and network and application dependency maps. These records lay the foundations for predictive alerts and root cause analysis features.
The Site24x7 system provides AI features in many of its functions. The platform provides a mechanism to set up performance expectation thresholds. If the metrics that the sensors upload to the Site24x7 conflict with one of those threshold figures, the monitoring system raises an alert.
The alerts of Site24x7 can be set up to launch as notifications. These can be sent to specific members of staff by voice or SMS message, Slack post, or email. This feature means that you don’t need to watch the dashboard for the system all the time in order to catch evolving problems. This is a time saver and will reduce your staff bill.
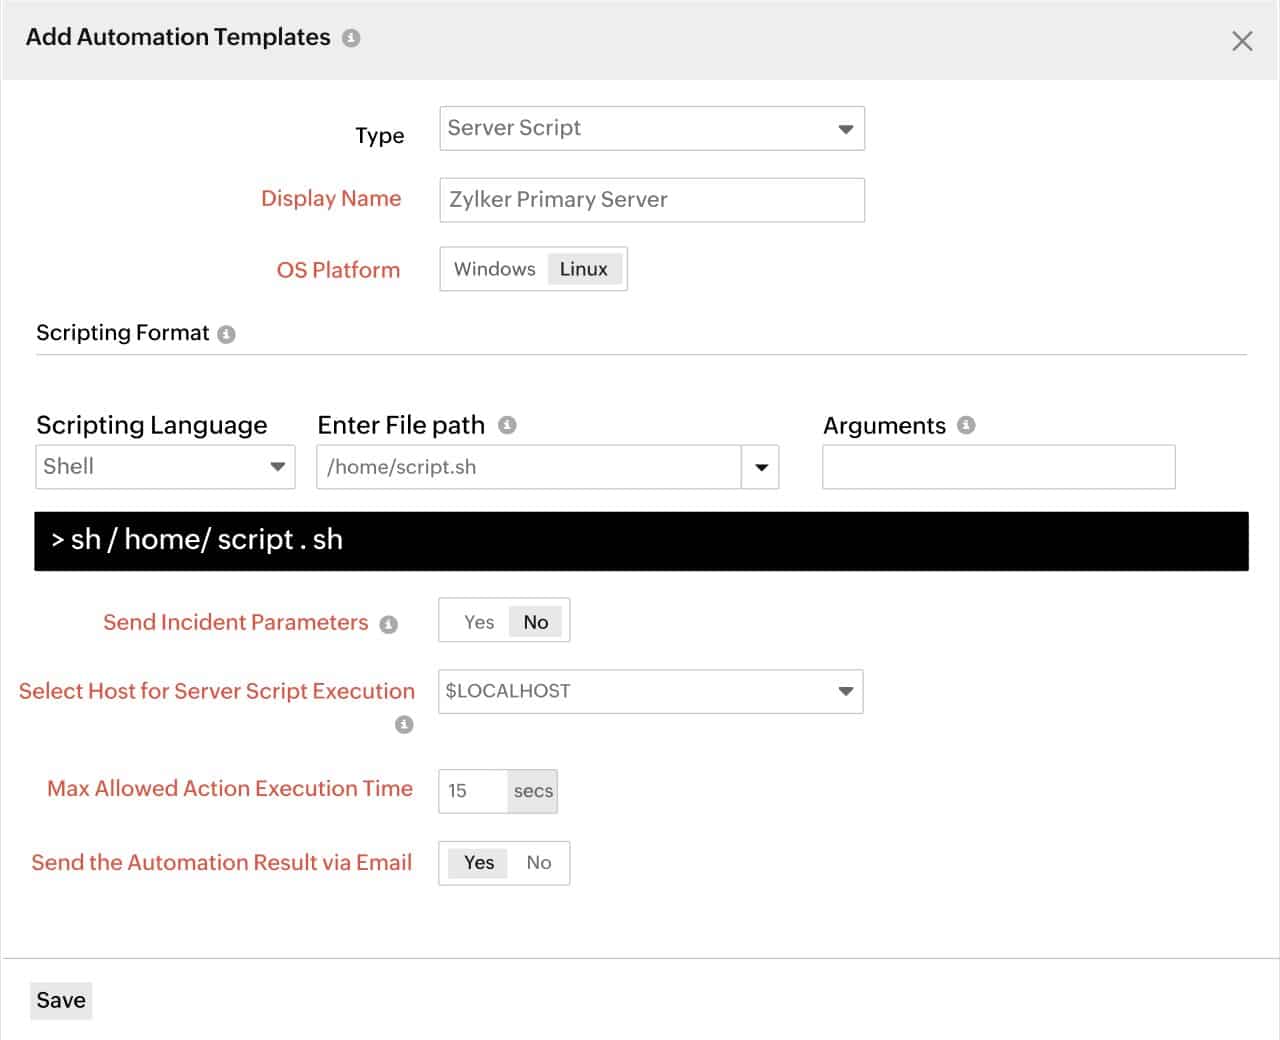
Another cost-saver in the package is the option to set up automated tasks that will be triggered by an alert. These processes could include straightforward tasks, such as clearing out temporary folders or they could be emergency measures such as bouncing a device.
Who is it recommended for?
Site24x7 sizes its plans to be suitable for very small businesses. Most companies will find that they will need to pay for more capacity. For example, the network configuration manager in the plans will cover one device so just about everyone will need to buy an upgrade to manage more.
Pros:
- Identifies Traffic Bottlenecks: Alerts for overloaded links
- Predicts Resource Overloading: Also shows where resources are underused
- Customizable Alerts: In addition to out-of-the-box warning conditions
- Alert Forwarding: Notifications by email, SMS, or Slack message
Cons:
- No On-Premises Option: Only available as a cloud SaaS package
The Site24x7 platform has many modules and it can be expanded further by accessing a library of plug-ins, called integrations. You can get to know the system without paying by accessing the Site24x7 30-day free trial.
4. Datadog APM
Datadog is a cloud-based system monitoring and management platform that has AI processes threaded through it with its Watchdog module. Watchdog operates both as a system monitoring assistant and a root cause analysis tool. In order to fully benefit from the AI services of Datadog, you could add in other plans, such as infrastructure, which monitors networks and servers.
Key Features:
- Application Dependency Mapping: Helps with resource demand predictions
- Performance Alerts: Forwarded by email, Slack, Jira, Teams, PagerDuty, or Webhooks
- Behavioral Analytics: Forecasts demand
Why do we recommend it?
Datadog APM tracks serverless systems that provide the data processing elements in websites and mobile apps. These microservices can be hard to track because they are usually fronted by a simple function call and they are hosted on someone else’s server. This APM tracks down all components and then uses AI to predict possible resource shortages or conflicts.
The APM plan of Datadog includes application, cloud services, and website performance monitoring. The AI functions of the Datadog service apply to all of these individual systems. It links together front-end interface performance to app stack services, down through server services and hardware capacity through to network device performance and traffic patterns.
The Watchdog system is able to thread together application and service dependencies, creating a service map that prepares the monitoring service for automated root cause analysis when issues arise. The artificial intelligence service informs performance monitoring by applying machine learning to baselining, anomaly, and outlier detection in ongoing system monitoring. The application stack map is also available for viewing to support manual system exploration.
The full complement of Datadog services adds up to an AIOps platform. The system includes a performance threshold service with alerts that identify potential problems. These thresholds apply to all components of an IT system and they can be set to trigger notifications. Those notifications can be sent by email, SMS, or Slack post.
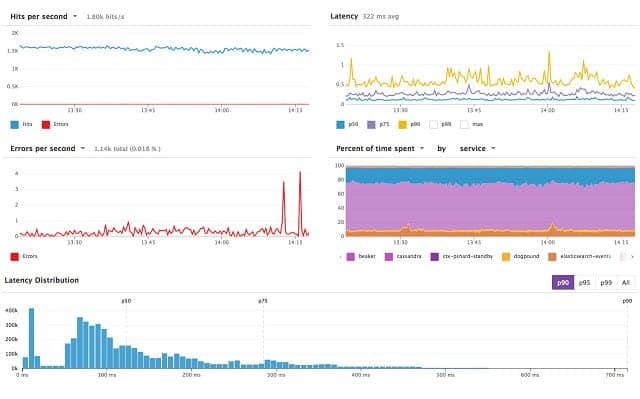
The Datadog APM includes monitoring and management tools for websites and applications that can drill down to the supporting server. The Watchdog element in the platform provides constant performance anomaly detection based on machine learning. This provides AI processes for system maintenance. Watchdog is able to perform root-cause analysis on application performance, relying on system maps laid down by the constant system monitoring services of other Datadog modules. Datadog is able to monitor cloud services and integrate system management for multiple sites.
Who is it recommended for?
Datadog APM is available in three editions and all of them include the AI engine, which is called Watchdog. The base APM package tracks Web application performance and that package would be suitable for the consumers of Web applications and cloud platforms as well as those who supply them. The two higher plans are intended for DevOps teams.
Pros:
- Offers Numerous AIOps Integrations: More than 700 connectors
- Provides Real-Time Feedback: Instant root cause analysis
- Scalable Pricing: Accessible to all sizes of businesses
Cons:
- Would Like to See a Longer Trial Period for Testing: Only 14 days
Datadog APM is a subscription package with a rate per month or per year. You can get the APM on a 14-day free trial.
5. LogicMonitor
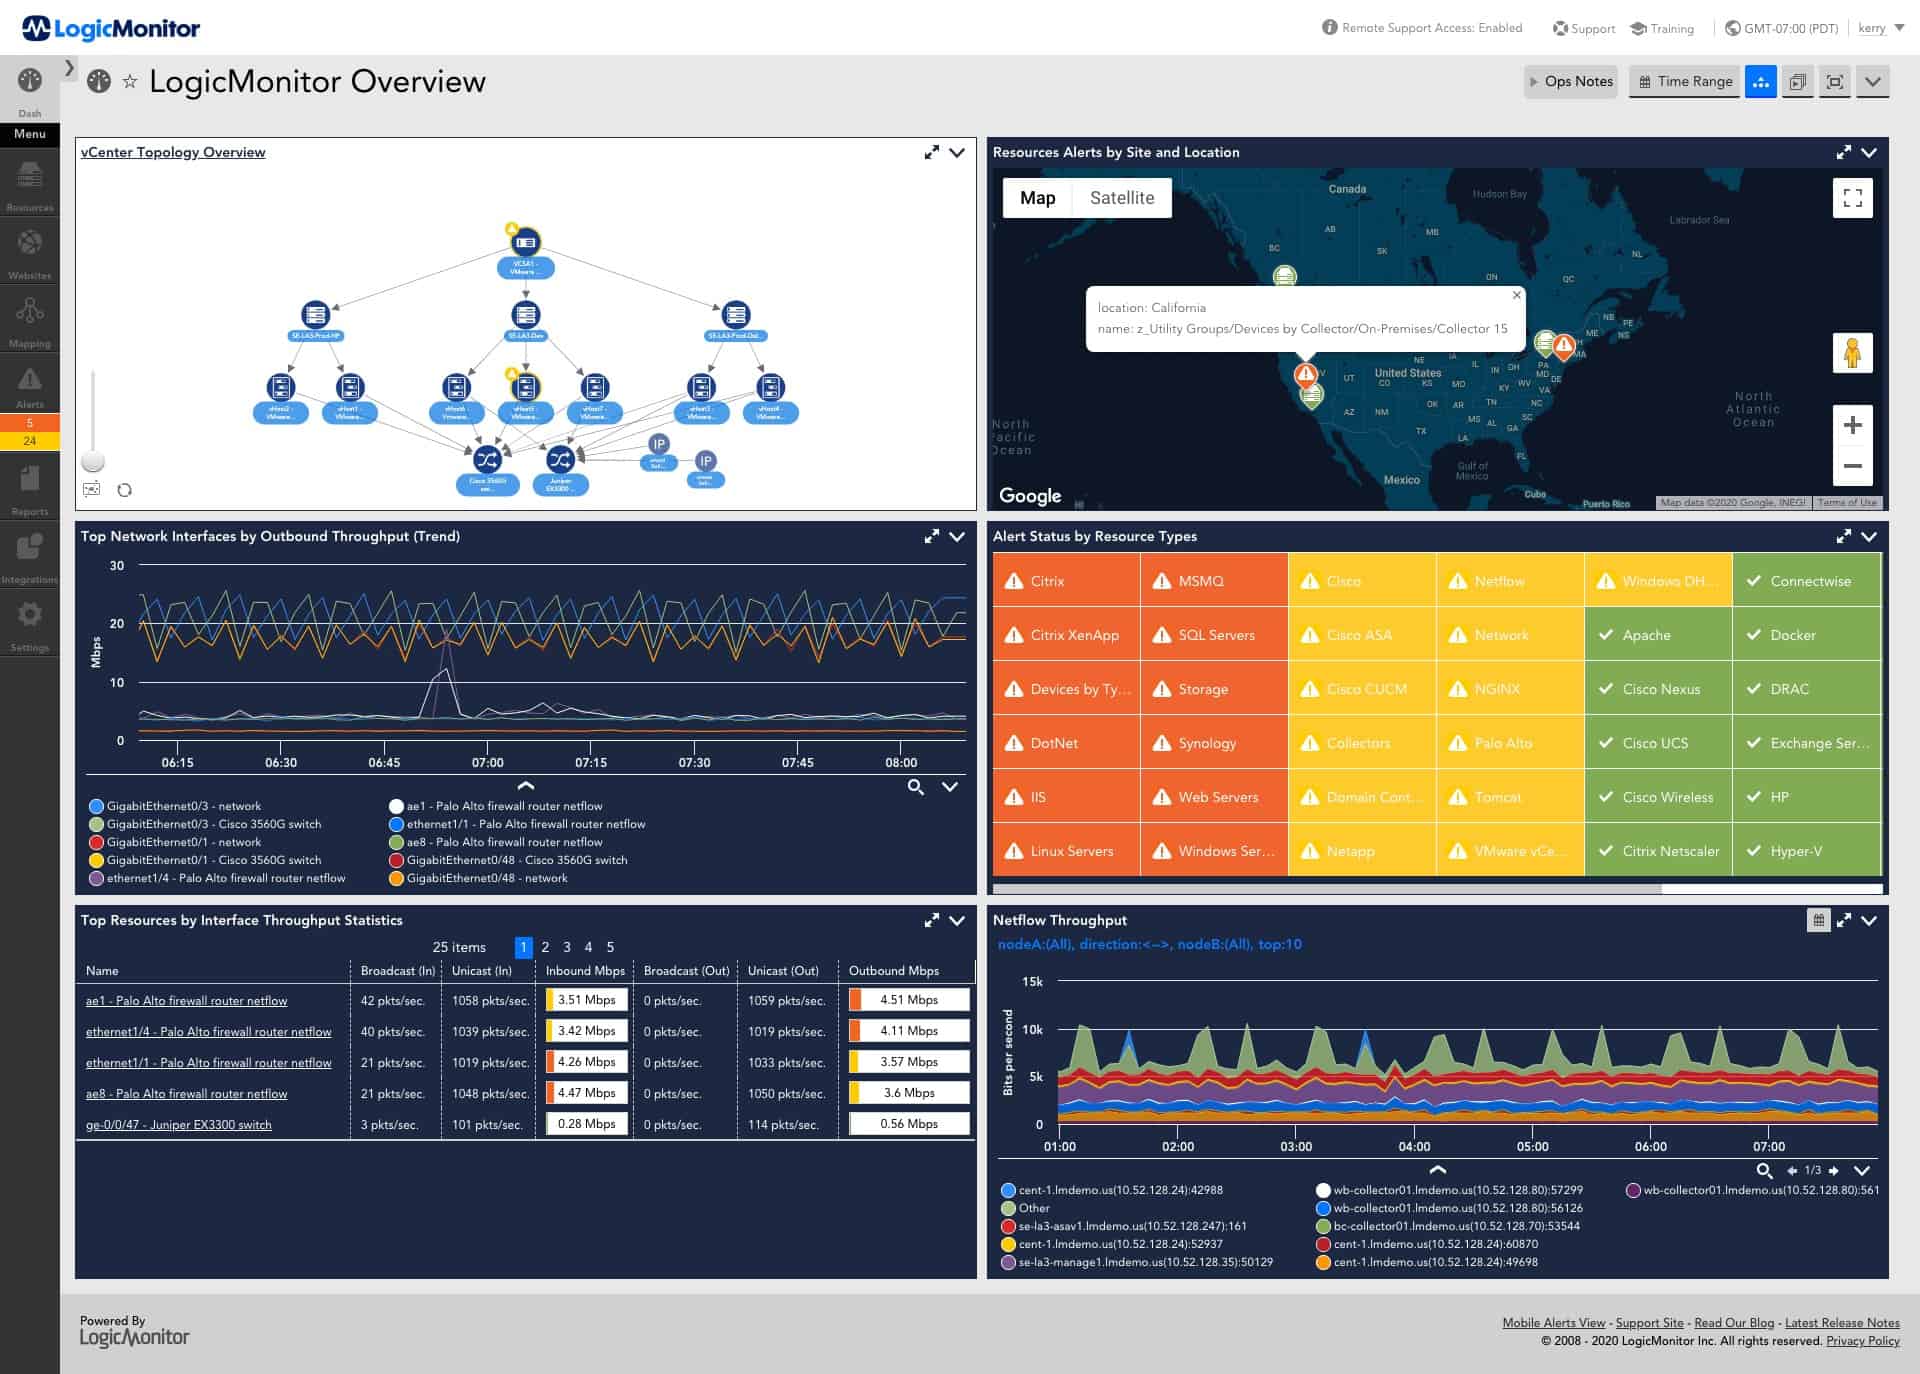
LogicMonitor operates from the cloud and it can monitor your on-premises, remote, and cloud-based infrastructure. The aim of LogicMonitor is to provide as much process automation as possible and it deploys AI in its operations management services to achieve this aim. This makes LogicMonitor an AIOps platform.
Key Features:
- Application Monitoring with AI Tools: Infrastructure monitoring is also available
- Process Automation: Alerts for performance issues
- Machine Learning for Behavior Baselining: Reduces false-positive alerting
Why do we recommend it?
LogicMonitor provides a correlation service for infrastructure data. This is called LM Envision and it is available in three levels. The base package is a network monitor but the AI features of the package are exploited more effectively with the Unified Infrastructure Monitoring edition. This spots potential resource shortages and raises alerts before disaster hits.
LogicMonitor is packaged as Core monitoring and Website monitoring services. The Core platform is available in two editions: Pro and Enterprise. The AI features of LogicMonitor are included in the Enterprise plan.
The Website monitoring package is centered on on-site testing tools. The Core package includes Website monitoring services, so don’t think that the Enterprise plan doesn’t include systems to help you manage Web services and websites. The Enterprise edition also has Cloud monitoring capabilities. The platform includes network and server monitoring, traffic analysis, storage device monitors, and application monitoring services.
The AIOps Early Warning System is one of the AI-driven advantages that the Enterprise plan has over the Pro edition. This is an anomaly detection service that adjusts its behavior baseline with a machine learning process. The anomaly detection that operates on top of this baseline also includes AI services.
Who is it recommended for?
LogicMonitor is able to watch over cloud resources as well as your on-premises systems. This is why the Unified Infrastructure Monitoring is so much bigger than the Network Monitoring plan. Businesses that operate hybrid systems will get the most out of this cloud-based monitoring service.
Pros:
- Monitors Application Performance Via the Cloud: Also examines cloud-based systems
- Can Monitor Assets in Hybrid Cloud Environments: Covers multiple platforms and on-site systems
- Automatically Generates Dependency Map Based on the Environment: Provides root cause analysis
Cons:
- Short Free Trial: The trial is only 14 days
LogicMonitor provides device discovery, application dependency mapping, root cause analysis, and AI-adjusted baselining. This is a thorough AIOps platform for day-to-day system management, demand forecasting, capacity planning, and incidence response. You can check it out for yourself on a 14-day free trial.
6. Dynatrace
Dynatrace is a cloud-based platform that offers infrastructure and application monitoring for on-premises and cloud infrastructure. This service is an AIOps platform that includes application security, performance testing, and business analytics tools as well as everyday system monitoring. The tool uses AI processes to improve anomaly detection and mean time to respond when problems arise.
Key Features:
- AI-Based Cloud Platform: Focuses on application monitoring
- Application Dependency Mapping: Helps with root cause analysis
- Behavior Analytics: Forecasts demand trends
Why do we recommend it?
Dynatrace offers two levels of service for application monitoring and also provides separate specialist services such as real user monitoring for websites. The Infrastructure and Full Stack Monitoring plans are the core of this cloud platform and both have an AI feature. The AIOps service work particularly well for Web application monitoring.
The Dynatrace platform includes an AI engine, called Davis. This service starts by mapping all hardware and software, creating a dependency topology map for all resources. This readies the system for instant root cause analysis in the case of performance issues arising. The performance tracking capabilities of this service do not segment your system by location, so all resources, no matter where they are, are integrated into a hybrid landscape.
Davis watches for anomalies in performance and system usage, spotting shortfalls in capacity and warning of issues before they arise. The system discovery process functions constantly and automatically, so if a new service is added, the dependency map gets updated. This tracking extends through APIs to microservices, so capacity issues can be headed off, even when they are caused by third-party processes.
The Dynatrace service also extends to log management and user experience monitoring. Its services are useful for DevOps environments because it can assist developers and testers in working out whether new code is faulty or just badly served by supporting modules and infrastructure. Operations staff can continue to benefit from Dynatrace AI-based monitoring once that new code goes live.
Who is it recommended for?
Those businesses that design, build, and support Web applications and mobile apps will get the most out of this platform. The Infrastructure plan would be suitable for businesses that just need to monitor the technologies that they use. Both will cross both sites and cloud systems.
Pros:
- Leverages the Latest AI Technology: Predicts performance
- Highly Visual and Customizable Dashboards: Excellent for enterprise NOCs
- Application Uptime Monitoring: Spots broken equipment and services
Cons:
- Designed Specifically for Large Companies: Smaller organizations may find the product overwhelming
As a SaaS system, there is no code to deploy on-site in order to use Dynatrace. The cloud-based console for this service can be accessed through any standard browser, AI features are also active in the self-installation and automatic setup of the Dynatrace service. Dynatrace offers a free trial of its AIOps platform.
7. AppDynamics
AppDynamics is a division of Cisco Systems and it organizes its IT operations support platform as a series of specialized modules which can be subscribed to in bundles. Those modules are Infrastructure Monitoring, Application Performance Monitoring, Database Monitoring, Business Performance Monitoring, and End User Monitoring.
Key Features:
- AI-Adjusted Performance Thresholds: Reduces alert fatigue
- Choice of Plans and Modules: Priced per CPU core
- Units for Infrastructure and Application Monitoring: A special edition for SAP
Why do we recommend it?
AppDynamics is very similar to Dynatrace. This system offers an Infrastructure Monitoring plan and then three editions for its Full Stack Monitoring service. There is also a Real User Monitoring plan. The Infrastructure Monitoring service in AppDynamics is much simpler than that of Dynatrace – it doesn’t include an AI engine, which is in the APM plans.
Infrastructure Monitoring is offered as a standalone module. AppDynamics also offers a bundle of infrastructure, application, and database monitoring services called the Premium edition. The Enterprise edition includes all AppDynamics modules.
Both the Infrastructure Monitoring and Application Performance Monitoring modules map resource dependencies that prepare the operations monitoring system for root cause analysis should things go wrong. Although these monitoring services are delivered from the cloud, they will track the performance of all infrastructure whether it is on your premises or based in the Cloud.
The AI code of AppDynamics is called Cognition Engine. This adjusts performance expectation thresholds with machine learning. It recognizes that the performance of one resource is dependent on others and can calculate the minimum service requirement needed from a supporting service that is necessary to enable a service higher up the stack to meet its performance targets.
The Cognition Engie watches for bottlenecks and raises alerts when capacity issues lower down the stack are building into noticeable performance impairment.
Who is it recommended for?
The big AI features in the AppDynamics platform are reserved for the Business Observability plans, which are heavily geared towards application monitoring. So, businesses that consume We applications would opt for the lower Business Obbservability plan and companies that produce and support them will go for the higher plan.
Pros:
- Tailored for Large-Scale Enterprise Use: Has cloud capacity
- Application Dependency Mapping: Supports troubleshooting
- A Menu of Services: Assemble your ideal system
Cons:
- Limited Presentation Options: Would like to see more reporting and monitoring templates
AppDynamics is a subscription service with a rate per month for each edition. The service is available for a free trial.
8. New Relic
New Relic is a system monitoring service that has AI and machine learning processes built into it for performance threshold setting. This service is available in three editions and the lowest of these, called Standard, allows one user account for free. You get charged for additional users.
Key Features:
- The Original APM: This platform started the practice
- Predicts Resource Shortages: Root cause identification
- A Large Platform of Modules: All plans include all units
Why do we recommend it?
New Relic is a large cloud platform of many monitoring modules but you can just subscribe to one or two of them. New Relic offers all of its modules in one plan. So, many companies might end up taking on a lot of functions that they don’t really need.
This is a cloud-based AIOps platform that covers infrastructure and applications and it also offers digital experience monitoring services for websites. The tool is able to track all services, even those that lie behind APIs and are hosted on third-party servers. It is able to map resource dependencies and offers constant monitoring while also providing a support system for root cause analysis.
Who is it recommended for?
This system is very big and although there is a free plan, it will be too big for small businesses. The platform is a leader in application performance monitoring and so, companies that need to track the performance of Web applications and mobile apps will be particularly drawn to this platform. However, this system also provides infrastructure monitoring.
Pros:
- Focused on Providing AIOps for Websites: Also mobile apps
- Web Service Scanning: Can identify and alert to SSL, JavaScript, load times, and browser issues
- Offers a Completely Free Tier: A level of throughput is free for all
Cons:
- Available Only as a Cloud Service: No on-site option
Higher plans of the New Relic platform add on bigger system test allowances for websites and SLA guarantees. These packages are called Pro and Enterprise. The top plan, Enterprise includes User Management features.
The console for New Relic is hosted in the cloud and accessed through any standard Web browser. The dashboard features live performance statistics and data visualizations, which include maps of service dependencies and hardware topologies. Although the monitor does examine physical systems it is much more geared towards software monitoring. It is particularly strong at tracking the performance of virtualizations, which inhabit a world that spans both physical infrastructure and applications.
New Relic is able to spot potential problems caused by capacity issues and back chain down the stack to identify root causes when the software fails.
AIOps Platforms FAQs
What are AIOps platforms?
AIOps platforms apply artificial intelligence to IT operations tasks. This is useful when monitoring activity with respect to resource availability. Usually, when resources start to run short, the system monitoring tool will raise an alert. However, this strategy often draws the attention of busy technicians with insufficient time to take action that will prevent the system from seizing up. AI processes can predict resource shortages sooner, providing more time to adjust demand and keep the system running smoothly. In virtual systems, resolution can be built into the AIOps system to automatically adjust virtual server space allocations or remap virtual networks.
What is AIOps?
AIOps is short for Artificial Intelligence for IT Operations. Thetis discipline uses AI to search through large amounts of data and identify patterns of activity that can be used to predict demand and either alert technicians to implement solutions or automatically adjust capacity in the resource that is about to run short.
Is AIOps the same as DevOps?
AIOps and DevOps are not the same. DevOps refers to the merger of development teams with IT Operations departments. This strategy exploits the skills of developers to adjust and maintain code as bugs or new requirements are identified. AIOps is concerned only with IT Operations. It applies AI techniques to predict potential resource shortages and also adjust settings of virtual settings to add on more capacity when needed.


