Amazon Web Services (AWS) has revolutionized how organizations manage IT infrastructure, offering scalable, flexible cloud solutions to support applications, storage, and data analytics. With this growing reliance on AWS, effective monitoring has become a cornerstone for maintaining system health, optimizing performance, and controlling costs. AWS monitoring tools empower businesses to track real-time performance metrics, identify system bottlenecks, and ensure resource efficiency while preemptively addressing potential issues.
AWS provides native tools like Amazon CloudWatch, which delivers detailed insights into application performance, system health, and resource utilization. CloudWatch supports metrics and logs from AWS services, enabling customizable dashboards and automated alerts. However, many organizations also deploy third-party solutions for more extensive monitoring capabilities. Tools like Datadog, Site24x7, and ManageEngine Applications Manager integrate seamlessly with AWS, offering advanced features such as cross-platform monitoring, root-cause analysis, and predictive alerts based on machine learning.
These tools provide full-stack observability by monitoring hybrid environments, combining AWS services with on-premises systems and other cloud platforms. They offer granular insights into key AWS components, including EC2 instances, S3 storage, and RDS databases, helping organizations maintain seamless operations and meet performance benchmarks. Additionally, many solutions support cost tracking, ensuring businesses remain within budget by analyzing spending patterns and identifying inefficiencies.
In this article, we explore the top AWS monitoring tools, highlighting their features, strengths, and limitations. Whether you manage a small startup or a complex enterprise environment, selecting the right monitoring solution can significantly enhance your cloud operations. From improving application performance to safeguarding infrastructure against downtime, these tools are indispensable for maintaining a competitive edge in today’s digital landscape.
Here are the best AWS monitoring tools & services:
- Datadog AWS Monitoring EDITOR’S CHOICE Server and application monitoring tools that work well for cloud-based systems, such as AWS. You can consolidate the monitoring of multiple AWS services and also your accounts on other cloud platforms. Start a 14-day free trial.
- eG Enterprise AWS Monitoring (FREE TRIAL) Choose to take this monitoring service as a SaaS service or an on-premises software package. Either way, you will be able to monitor cloud platforms, such as AWS, as well as your on-premises resources. Access a 30-day free trial.
- ManageEngine Applications Manager (FREE TRIAL) A system monitor that runs on Linux or Windows and can monitor AWS and other online services.
- Site24x7 AWS Monitoring (FREE TRIAL) A cloud-based service that can monitoring servers wherever they are. This monitoring capability extends to cloud services, such as AWS. The infrastructure monitor also includes connection supervision.
- Nagios XI popular network monitoring tool that can be extended by plugins to monitor AWS and other cloud-based services.
- Paessler PRTG Network Monitor A combined network, server, and applications monitor that is capable of monitoring cloud-based services, such as AWS.
- Dynatrace An AWS APN Advanced Technology Partner that will monitor E, EBS, ELB, S3, and RDS as well as applications on your on-premises servers.
- AppDynamics Monitor E, ECS, EKS, AWS Lambda, and AWS Fargate with this network monitor.
- Zenoss This system monitoring package is available in a free version, called Zenoss Community Edition, and paid versions that operate on-premises and as a SaaS package. All versions include AWS monitoring via an extension.
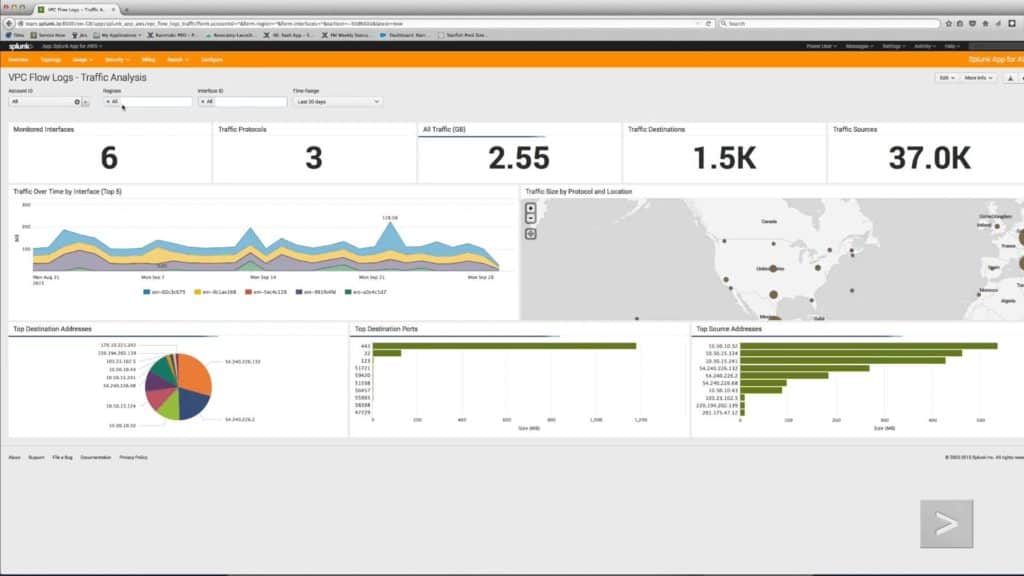
- Splunk A very well-known network analyzer that extends to cloud servers, including AWS.
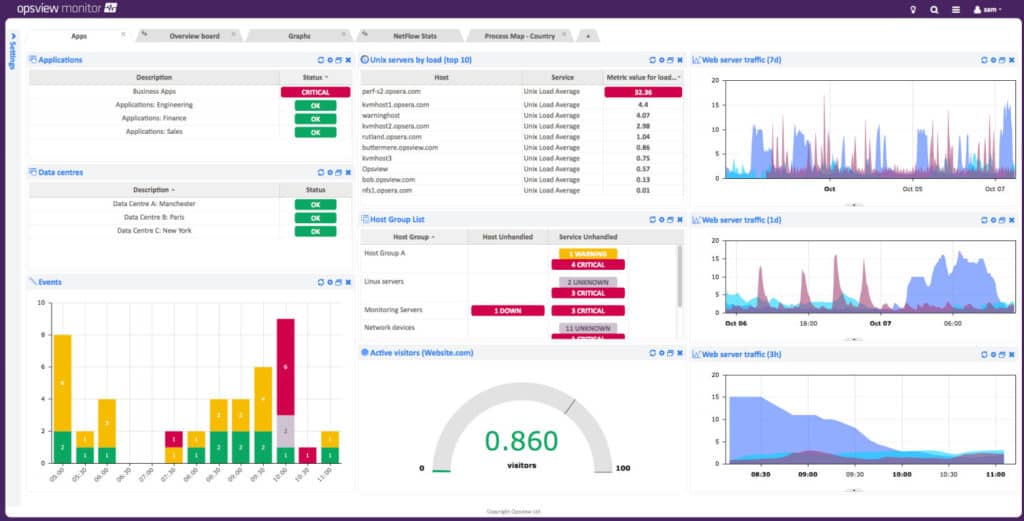
- Opsview An infrastructure monitor that can monitor on-premises, cloud, or hybrid systems and includes AWS monitoring.
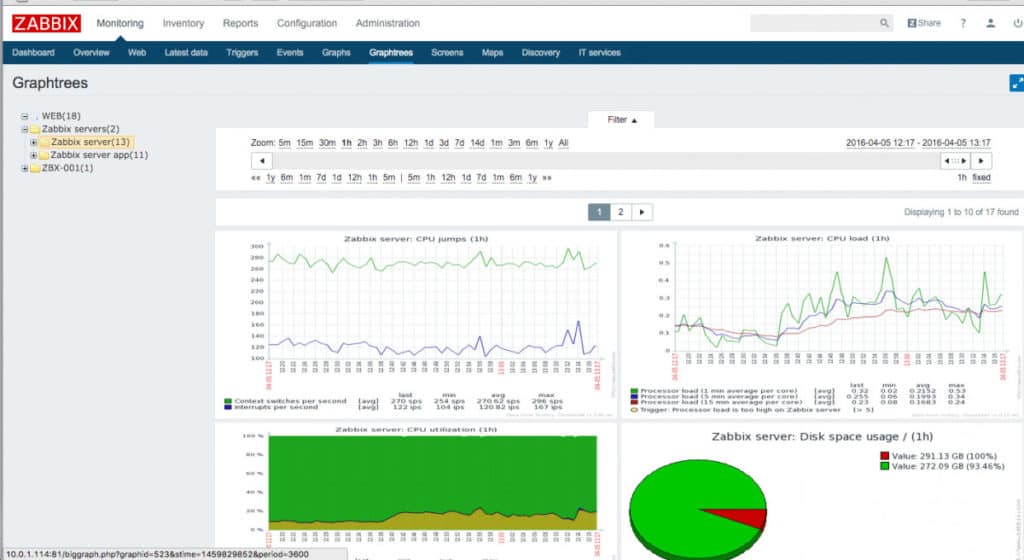
- Zabbix A free infrastructure monitor that runs on Linux and can monitor AWS and other cloud-based resources.
The Best Services & Tools for Monitoring AWS
Our methodology for selecting AWS monitoring tools
We reviewed the market for Amazon Web Services monitoring software and analyzed the options based on the following criteria:
- A monitor for a range of AWS services, not just S3 or EC2
- The ability to mix in AWS monitoring with other application monitoring, including on-site systems
- Live performance monitoring
- Alerts that indicate when expected performance levels drop
- A notification system that forwards alerts by email or SMS
- A free trial for a risk-free assessment period or a money-back guarantee
- Value for money with tools that repay their cost with efficiency
1. Datadog AWS Monitoring (FREE TRIAL)
Amazon Web Services offers a menu of applications as well as virtual servers to run them on. Datadog can monitor both application and server performance on cloud servers, so it is well suited to the task of overseeing the performance of AWS.
Key Features:
- Adaptive AWS Integration: Tailored specifically for AWS products, ensuring comprehensive monitoring.
- Application Tracking: Keeps tabs on application performance on AWS for efficient management.
- Resource Monitoring: In-depth observation of resource usage, enhancing cloud efficiency.
Why do we recommend it?
Datadog AWS Monitoring is part of the Datadog Infrastructure plan, which is a SaaS package. This system tracks the performance of all the services that support user-facing interfaces and this includes the platforms that host all software. This tool is able to monitor all of the AWS services and that includes serverless AWS Fargate systems.
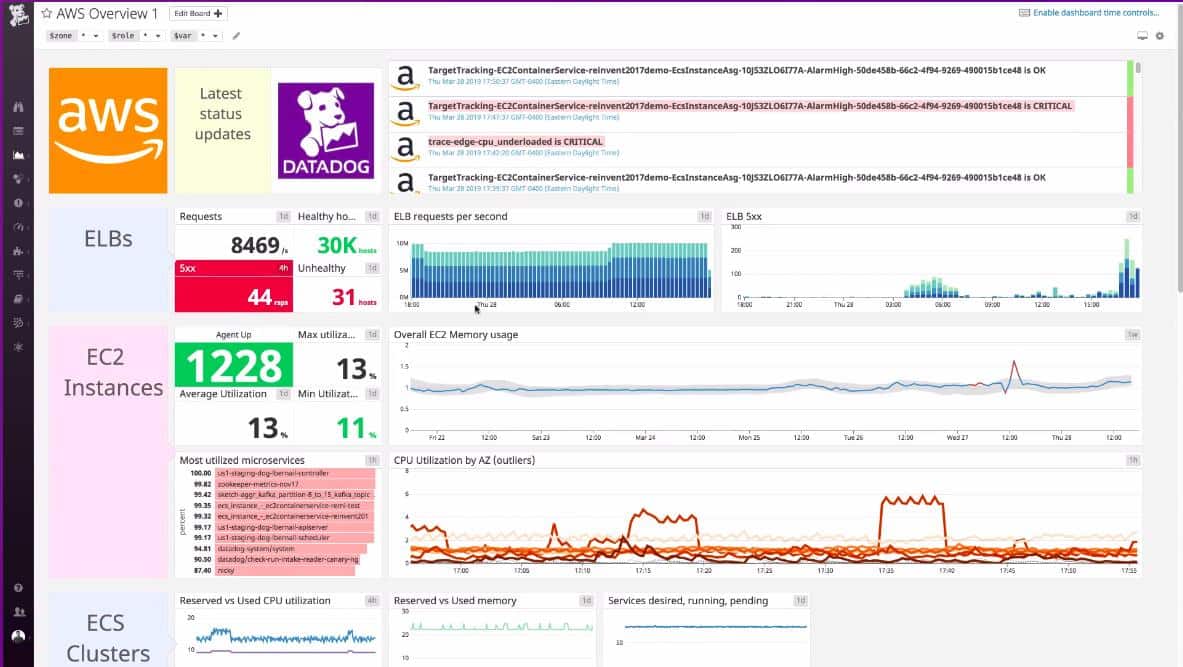
Datadog is a SaaS system and it is paid for by subscription. Buyers can choose from a range of modules, any of these can work as a standalone service or they can be combined. The combination of the Datadog Infrastructure monitoring system and the Datadog APM would fully cover all of the monitoring needs for AWS. Users access the interactive dashboard through a browser and can customize the screens of the system management console.
The Datadog operations and console can be adapted by activating vendor-specific integrations and there is an AWS integration available. This adds extra screens to the console, such as the ELB monitoring screen to track the performance of load balancing.
Datadog Infrastructure provides live performance metrics on the virtual server’s operations and the connections to it from the other elements of your IT system. The APM monitors the delivery of AWS services and the software that you run on your Amazon servers.
Features in the Datadog service include a stack analysis system, which groups together overviews of both software and hardware live statuses. End-to-end delivery is also examined live as are host maps and network topology maps. All of the graphics in the screens are color-coded to make problem recognition a lot faster.
The standard version of Infrastructure, which is called Pro includes an alerting system, so you should be able to spot problems before they become critical. The higher plan, which is called Enterprise, uses AI methods to discover more complicated problems that involve several elements of system performance. Enterprise also gives you AI-based support with a problem root core investigation tool to spot the cause of any problem.
The APM service can trace through code to identify inefficient processing and problems with resource locking. The combination of Infrastructure and APM provides a tracing system that can identify the source and destination of your greatest traffic generators. These analytical insights also extend to software and services running on Amazon cloud servers.
Who is it recommended for?
Datadog infrastructure is charged on a subscription that is levied per host, which makes it a very scaleable plan. A Free plan for small businesses will monitor up to five hosts. This is a SaaS package, so you don’t need to download the software or manage it. The plan also includes storage space for performance metrics.
Limited Trial Period: A longer trial period would be beneficial for thorough testing in diverse environments.
Pros:
- Customizable Dashboards: Offers user-friendly, adaptable dashboards ideal for AWS environments.
- Auto-Discovery: Automatically builds network topology maps, simplifying setup and ongoing maintenance.
- Scalable Pricing Options: Flexible pricing allows businesses of various sizes to find an affordable solution.
-
Cons:
Limited Trial Period: A longer trial period would be beneficial for thorough testing in diverse environments.
Both Infrastructure monitoring and the APM are available for Datadog on a 14-day free trial.
EDITOR'S CHOICE
Datadog Infrastructure is our top pick for an AWS monitoring service because it is able to extract performance data directly from the Amazon Web Services platform for all of the infrastructure package offered by AWS. The tool gives you a single dashboard from which to monitor all performance issues with multiple AWS systems and it can also include accounts from other platforms, unifying the monitoring of all of those diverse services as well. Additionally, this tool can be used to monitor on-premises servers, applications, and services. You can leave Datadog Infrastructure to monitor normal operations of AWS, other cloud platforms, plus on-premises facilities because the package will issue an alert if problems arise, giving you time to return to the dashboard and head off disaster.
Download: Start 14-day FREE Trial
Official Site: https://www.datadoghq.com/free-datadog-trial/
OS: Cloud-based
2. eG Enterprise AWS Monitoring (FREE TRIAL)
The eG Enterprise monitoring package from eG Innovations is an infrastructure and application monitoring system that is fully customizable. You get a library of screens to choose from and all of them drill down through your applications to give you full-stack observability. This provides instant root cause analysis when performance problems arise, letting you know exactly which service is causing delivery issues.
Key Features:
- Full-Stack Observability: Provides complete visibility into the entire stack for thorough monitoring.
- Over 200 Specialized Monitors: Extensive range of specialized monitors for diverse technological needs.
- Instant Root Cause Analysis: Rapidly pinpoints the source of performance issues.
Why do we recommend it?
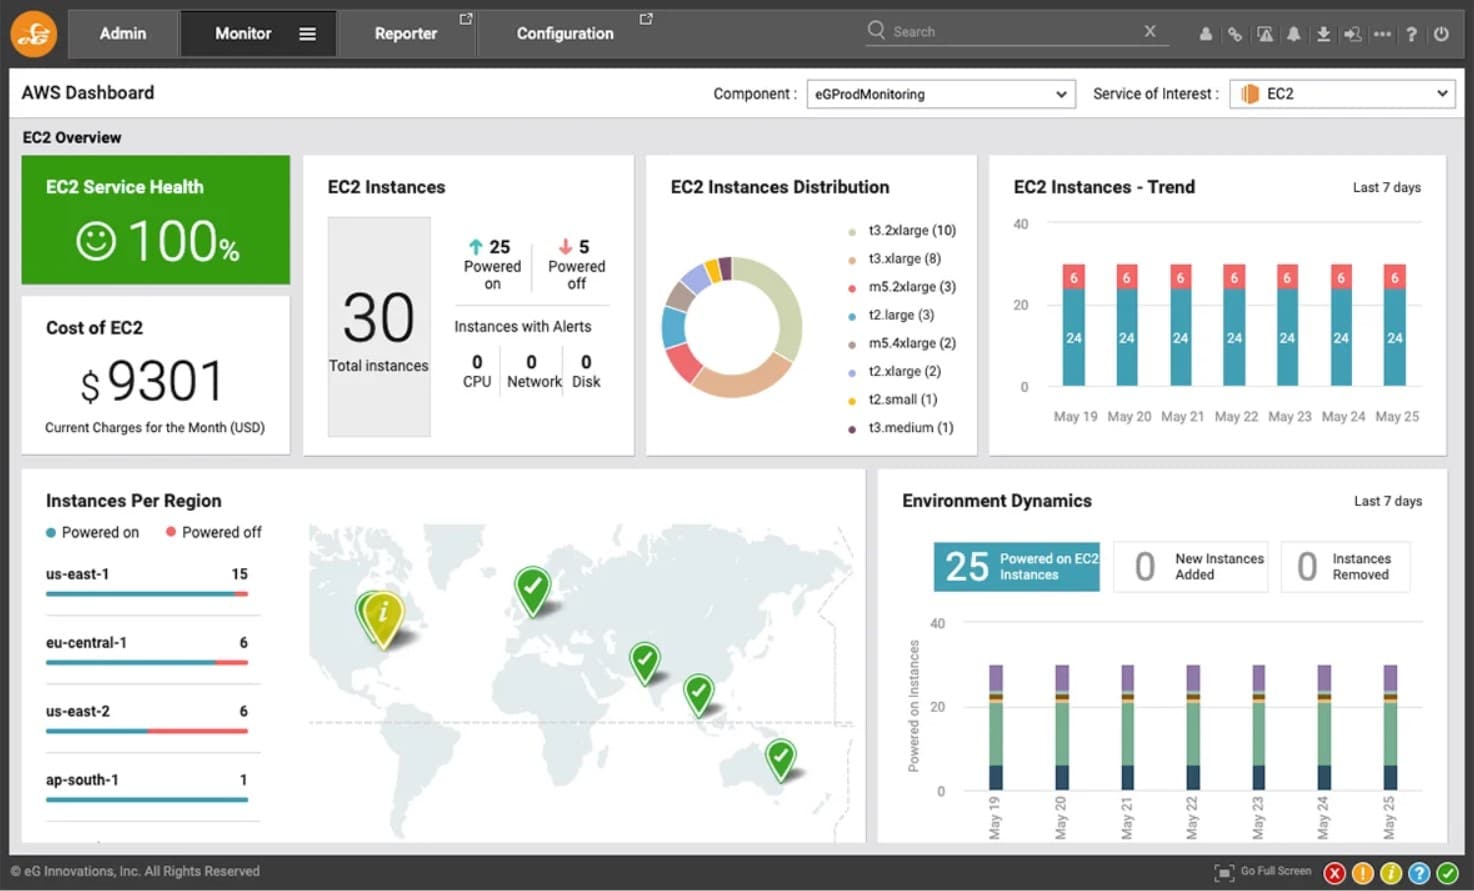
eG Enterprise AWS Monitoring is part of a system-wide monitoring package that is able to look after networks, servers, and applications. The AWS monitoring is part of the tool’s cloud monitoring services, which cover Azure and other platforms as well. This system extracts performance data from AWS Cloudwatch.
The infrastructure monitor is able to watch over the performance of resources on the cloud and on-premises. The eG Enterprise system is very flexible and you need to make decisions about how you want to implement it. The main decision you need to make is whether to take the system as a software package to host yourself or to access the system as a SaaS package.
The eG enterprise system has specialized monitoring services for more than 200 technologies and you probably won’t need all of them. To prevent your menu from being crowded with services that you don’t want, product-specific monitoring screens are provided through a library of plugins.
To get AWS monitoring, you need to activate an integration. This is a free extension that adds on screens to the console and opens up a connection manager to your AWS account.
The eG Innovation website states that the AWS monitoring service is agentless. This is possible because it interfaces to AWS CloudWatch – the monitoring service that is built into the AWS platform. You still need to set up the monitor, however, by giving it the details of your account.
Who is it recommended for?
eG Innovations has created a delivery model that makes the eG Enterprise system suitable for many businesses. It is available as a cloud-based SaaS package and is also offered as a software package, which can be bought outright on a perpetual license or accessed on a subscription. The software package runs on Windows, Linux, and Unix.
Pros:
- Comprehensive Monitoring Range: Monitors a wide array of cloud and on-premises resources.
- Flexible Deployment Options: Available as both a SaaS service and an on-premises software package.
- Alerting and Connection Tests: Offers alerts for performance issues and conducts connection tests for reliability.
Cons:
- Opaque Pricing: Pricing details are not immediately transparent, requiring potential users to request a quote.
The eG Enterprise tool offers a lot more than AWS monitoring, so you really need to check out the system yourself to get a complete picture of its capabilities. If you choose the on-premises option, you can run the software on Windows, Windows Server, Linux, or Unix.
Licensing is evaluated per physical server, which gives you the monitoring capacity for unlimited virtual systems on that platform. The price for the SaaS version starts at $125 per month. You can choose to get the on-premises package on a subscription with a starting price of $100 per month or get a perpetual license for $10,000. Access a 30-day free trial to assess the package.
3. ManageEngine Applications Manager (FREE TRIAL)
Cloud monitoring is an area that ManageEngine Applications Manager is equipped for inside and out. With ManageEngine Applications Manager you can monitor the health of your cloud services including AWS. The program closely monitors Amazon E and RDS instances to assess the cloud performance and utilization metrics of your service. This performance data can then be converted into a graph for closer inspection.
Key Features:
- Cloud and On-Premises Monitoring: Monitors services both in the cloud and on-site for a comprehensive overview.
- AWS-Specific Monitoring: Tailored monitoring routines for AWS services.
- AWS Hosting Capability: Can be hosted directly on AWS for seamless integration.
Why do we recommend it?
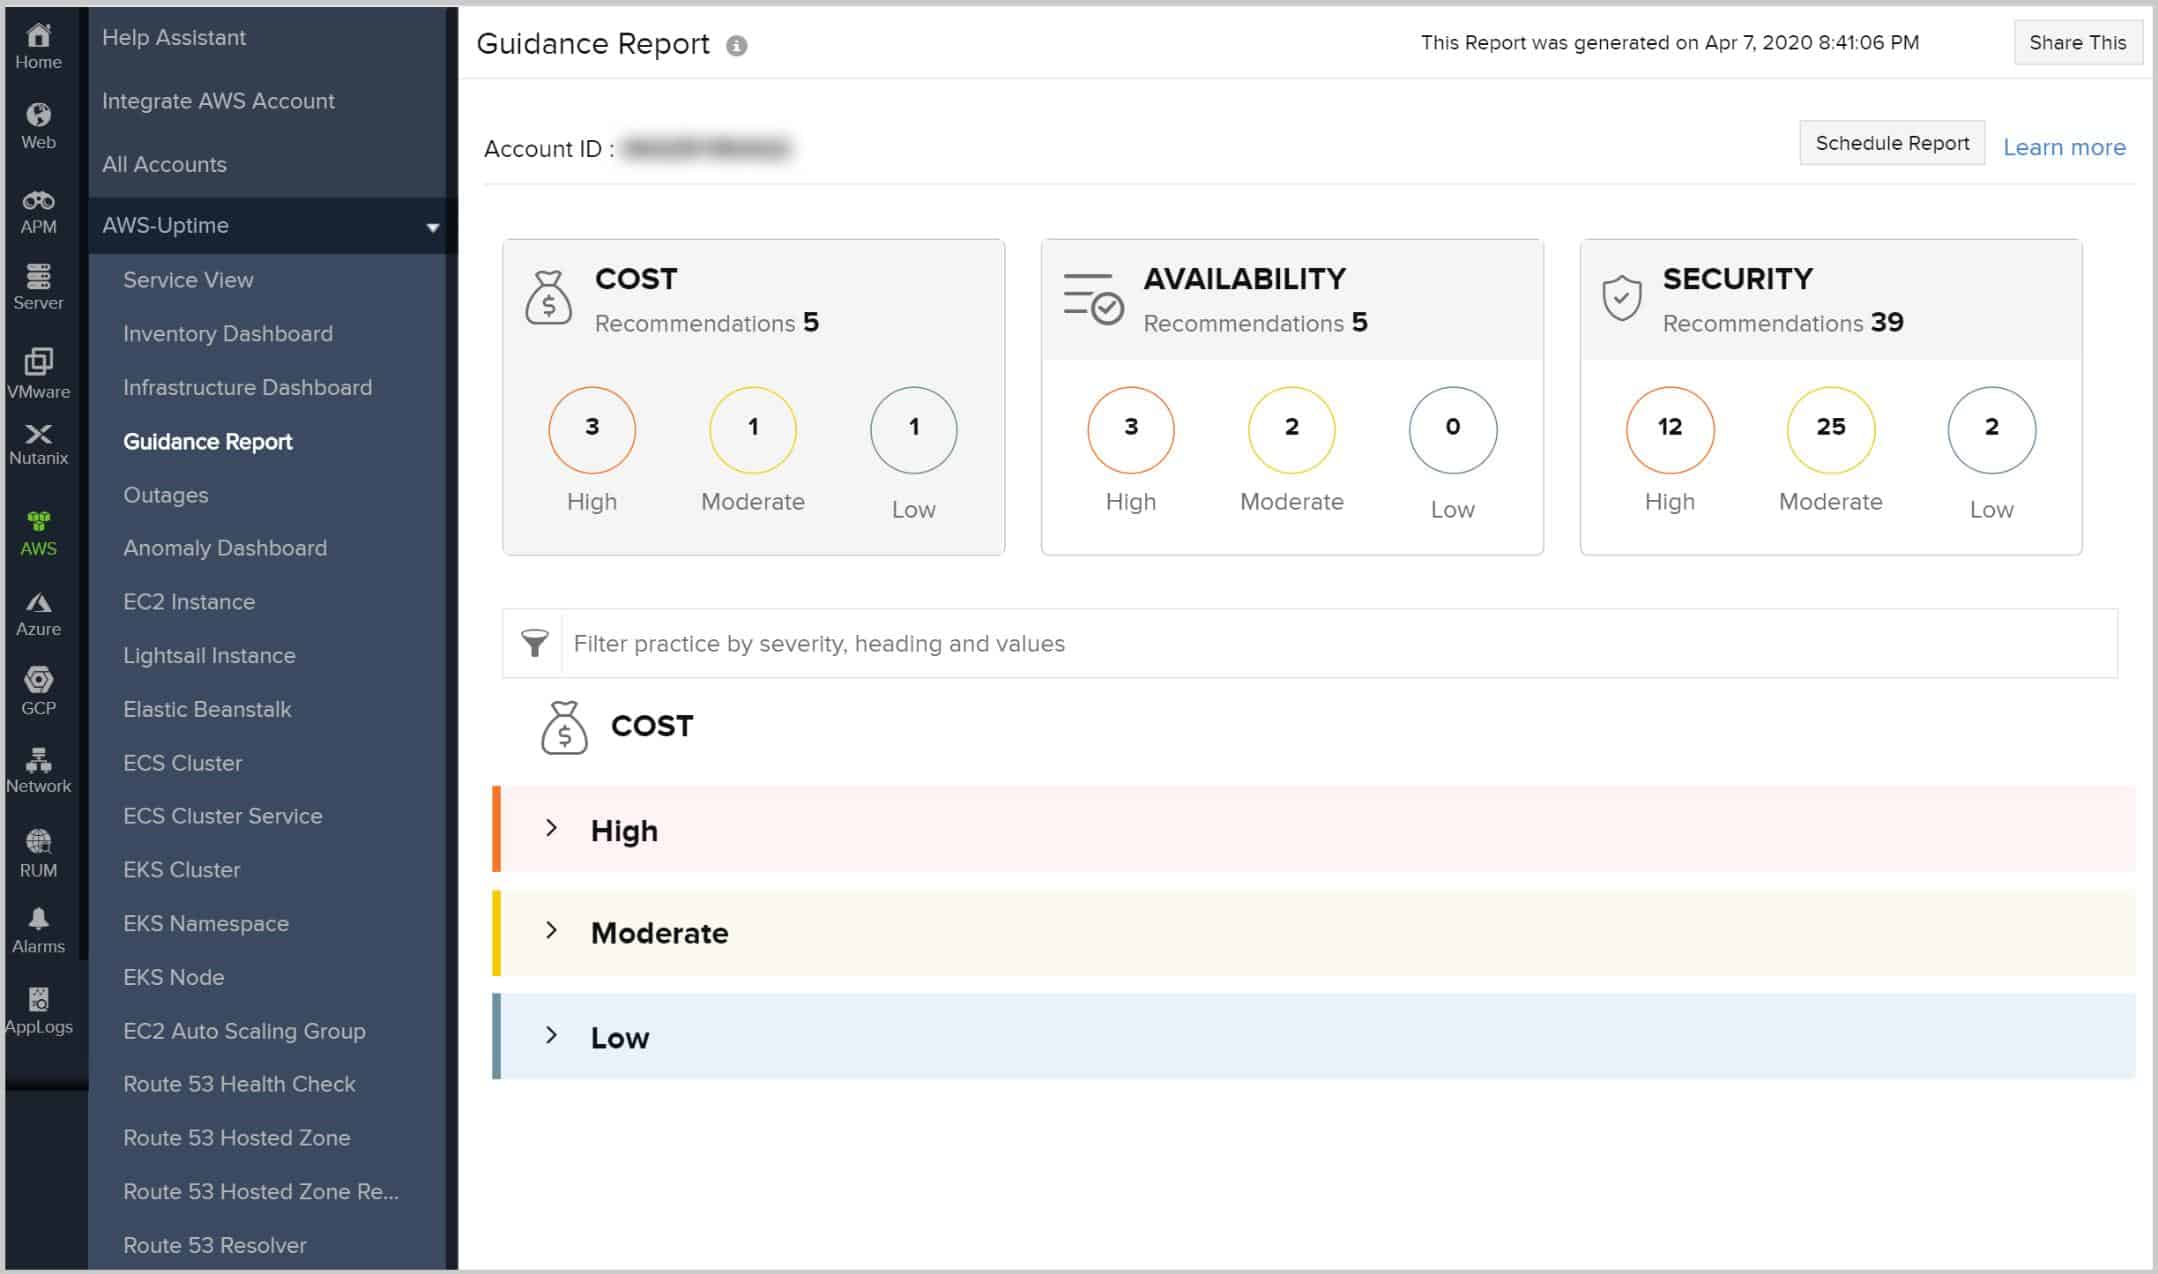
ManageEngine Applications Manager creates an applications dependency map. This discovers all application components, no matter where they are hosted and it will combine the monitoring of software packages, the services they access, and the resources that support them. The tool is able to monitor cloud platforms, such as AWS as well as on-site servers.
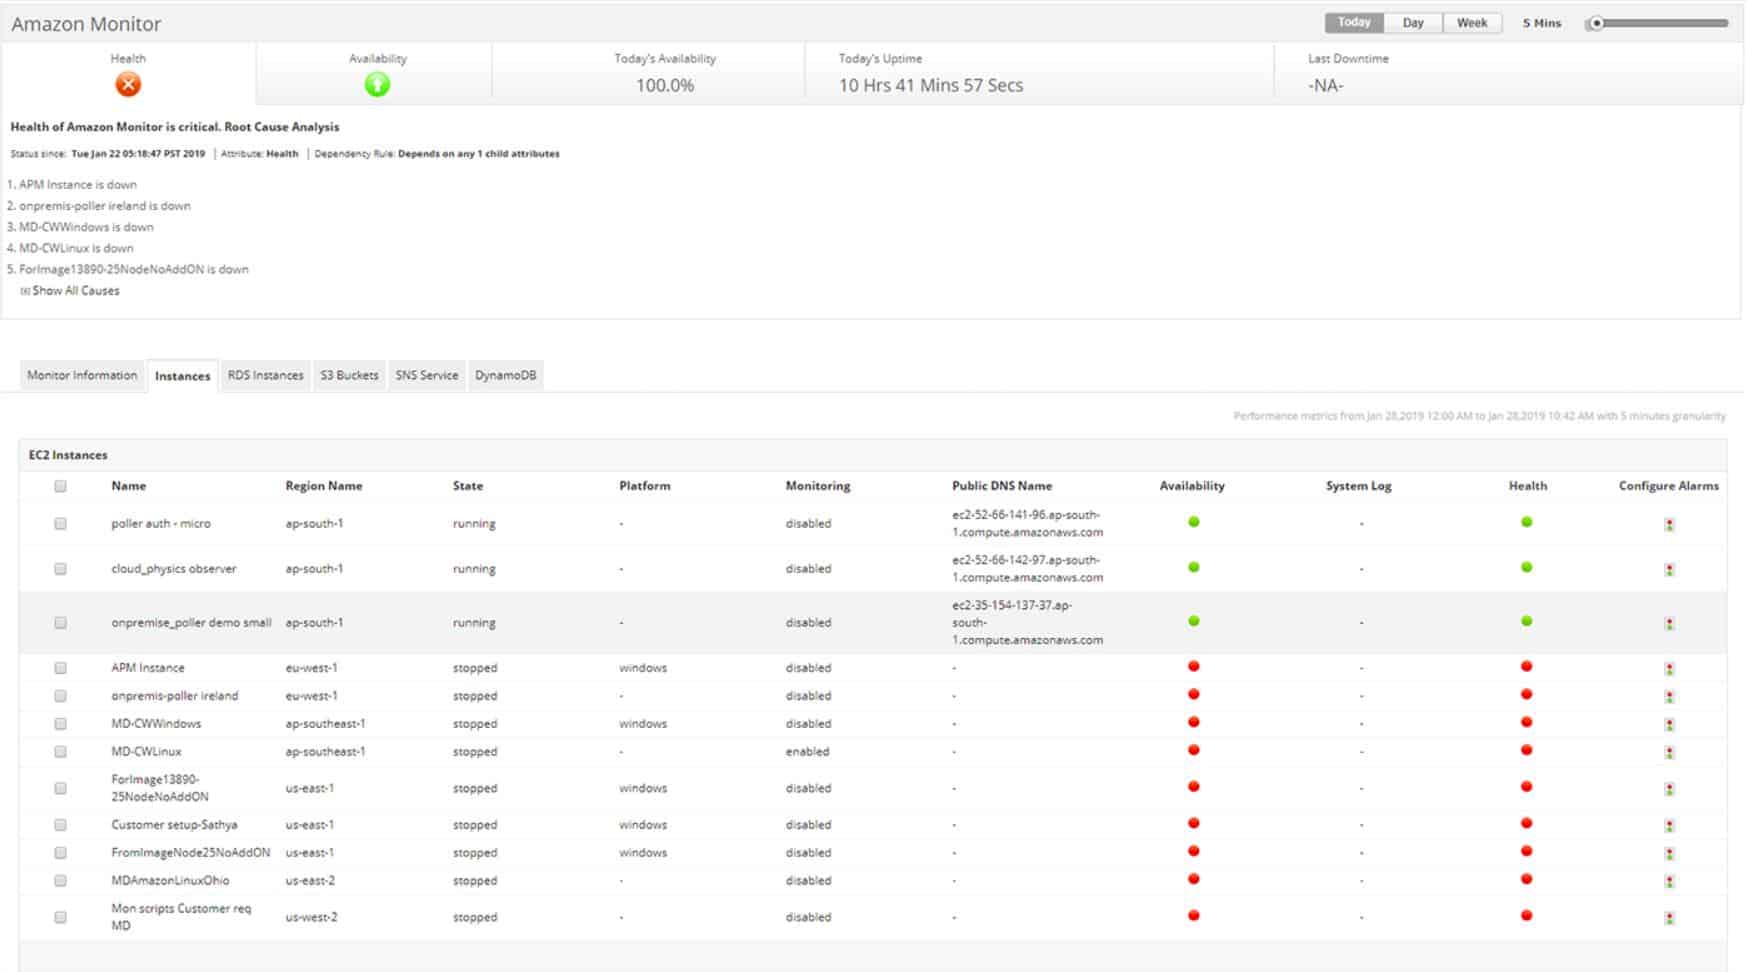
When monitoring E instances you can view data such as instance ID, region name, state, platform, public DNS name, availability, and health. The health section is color-coded so that you can tell from a glance if a service is going down. ELB monitoring tracks the activities of the Application Load Balancers, Network Load Balancers, and Classic Load Balancers provided by Amazon’s Elastic Load Balancing service.
Similarly, ManageEngine Applications Manager’s RDS monitoring allows you to view the CPU utilization, database connections, latency metrics, and traffic of RDS instances.
All of this information is displayed in a clear format without any complex displays. However, if you want to integrate ManageEngine Application Manager with another tool then you can make use of the REST API to pull custom metrics from other monitoring solutions.
Who is it recommended for?
This is a large package and, although it includes a great deal of automation in its monitoring processes, it provides more than a small business needs. However, ManageEngine has produced a Free edition, which accounts for this because it has fewer functions. The paid editions are packaged for a single LAN and for multiple sites.
Pros:
- Extensive Cloud Support: Capable of monitoring AWS environments as well as other cloud and hybrid architectures.
- Real-Time Device Discovery: Automatically detects databases, server hardware, and devices in real-time.
- Application Dependency Mapping: Highlights interdependencies between applications for a clearer operational picture.
Cons:
- Complex Feature Set: The platform’s extensive features may take time to fully explore and utilize.
ManageEngine Applications Manager is worth consideration based on its low-maintenance approach to AWS monitoring. The Professional Edition of ManageEngine Applications Manager starts at $945 (£724) for 25 monitors to 250 monitors for $7,195 (£5,514). The Enterprise Edition starts at $9,595 (£7,353) for 250 monitors to $83,995 (£64,375) for 5000 monitors. There is also a 30-day free trial that you can download for Windows and Linux.
4. Site24x7 AWS Monitoring (FREE TRIAL)
Site24x7 is a suite of systems monitors delivered from the cloud. The service is offered in modules and one of these, Infrastructure, is a network, server, and cloud services monitor. This tool is very good at tracking the performance of AWS and fine-tuning the services settings.
Key Features:
- Integrated AWS Tracking: Seamlessly combines AWS monitoring with other IT infrastructure services.
- Connection Supervision: Monitors the performance and reliability of network connections.
- Comprehensive Cloud Service Monitoring: Extends monitoring capabilities to other platforms and on-site systems.
Why do we recommend it?
Site24x7 AWS Monitoring is delivered as part of a SaaS package. The platform provides monitoring options for Azure as well. The cloud platform monitoring system is delivered together with activity tracking for on-premises servers, networks, and applications. This provides instant root cause analysis if problems arise.
AWS isn’t restricted to monitoring Amazon Web Services. It is also capable of monitoring on-site and remote company-owned servers, so you can integrate the monitoring of AWS into your entire infrastructure monitoring system with one interface to cover a hybrid environment.
AWS includes a very long list of services and many of them are complimentary. It is difficult to see the points of interaction between the different services and coordinate the settings of services effectively. Tying together your different AWS services through the Site24x7 system creates a more manageable front end than Amazon provides for your AWS subscriptions.
Site24x7 has specialist tools and screens for 35 AWS services. These include:
- Elastic Compute Cloud (EC2)
- Lambda
- Elastic Beanstalk
- Elastic Container Service (ECS)
- Elastic Kubernetes Service (EKS)
- Lightsail Instance
- Simple Storage Service (S3)
- S3 Object
- Elastic Block Storage (EBS)
- Elastic File System (EFS)
- Storage Gateway
- Amazon FSx
Database services, load balancers, network systems, CDN services, analytics, and security systems provided by AWS can also be included in Site24x7 Infrastructure monitoring.
The system isn’t cluttered up with features that you don’t need. These services only appear in the dashboard when you add them into the services settings for your account – all of these integrations add-ons are free to access and use.
Who is it recommended for?
The Site24x7 system is delivered in plans that include monitoring for all IT assets, including cloud systems – it can monitor more than 50 AWS services. The basic plans for the subscription service are leveled at the needs of small businesses. Larger businesses pay extra for more capacity.
Pros:
- Holistic Monitoring Approach: Offers a wide-ranging view, covering networks, infrastructure, and real user monitoring in a single platform.
- Dynamic Auto-Discovery: Automatically discovers devices and builds network maps and reports in real-time.
- Intuitive Design: User-friendly interface that requires minimal configuration for effective use.
Cons:
- Complex Platform: Detailed and feature-rich, requiring significant time to fully learn and utilize all its features.
Site24x7 Infrastructure is a subscription service with a base package that is paid for annually. The base plan can be enhanced by extra services, enabling each company to tailor the ideal combination of services. You can get a 30-day free trial of Site24x7 Infrastructure.
5. Nagios XI
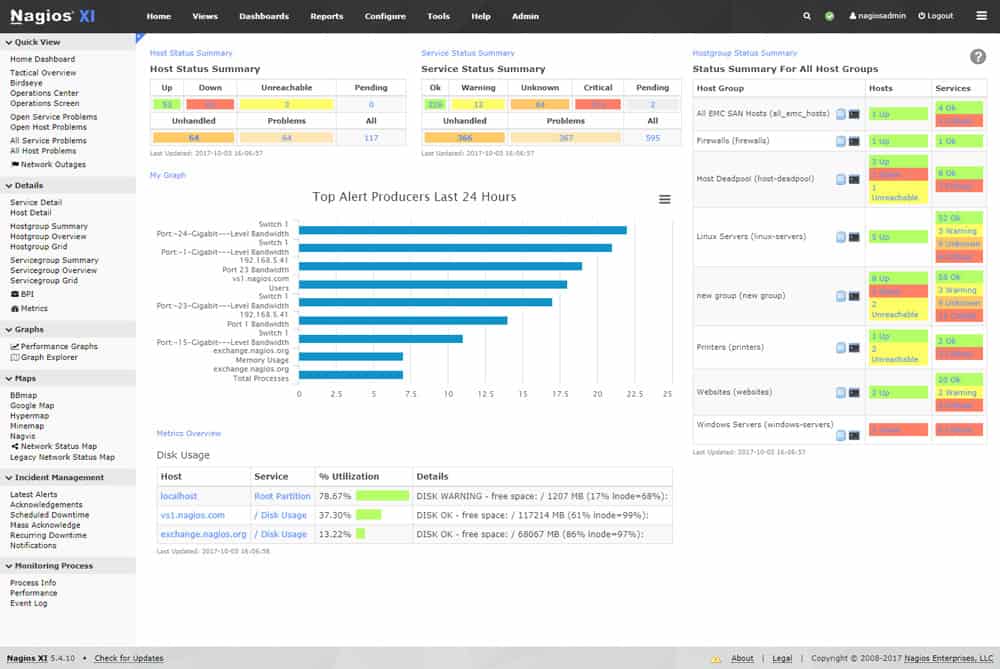
Nagios XI is a network monitoring tool that also offers support for monitoring AWS monitoring. Nagios XI can monitor key AWS components like E. However the main focus of this tool is on measuring the availability of AWS. The moment a service goes down, you’ll know about it. This approach is quite basic, but it does provide you with enough information to know if your service is in jeopardy.
Key Features:
- Versatile Monitoring: Monitors networks, servers, and applications, including AWS services.
- AWS CloudWatch Integration: Utilizes AWS CloudWatch plugins for enhanced AWS monitoring capabilities.
- Availability Focused: Concentrates on the availability and uptime of AWS services.
Why do we recommend it?
Nagios XI provides monitoring for networks, servers, and applications. The package includes cloud monitoring capabilities but these can be deepened by the installation of plug-ins. There are thousands of free plug-ins available from the Nagios Exchange. Extending the system with an AWS Cloudewatch plug-in gets activity data for all AWS services.
What makes Nagios XI great for AWS monitoring is its use of additional plugins. There are a variety of different free plugins that can be downloaded specifically for monitoring AWS. One of the most significant is AWS Cloudwatch Metrics. AWS Cloudwatch Metrics is a plugin that has been designed to pull information, such as S3 storage statuses and ELB load balancing activities, straight from AWS CloudWatch.
Once this information has been pulled by the plugin, it can then be used for monitoring and can even produce alerts to notify you when something changes. Nagios XI’s alerts system notifies you when metrics exceed specific thresholds. This means that you’re not under pressure to catch everything, as the system will notify you automatically when you need to take action.
Who is it recommended for?
Nagios XI is designed for use by mid-sized and large organizations. There is a free version called Nagios Core that might interest small businesses more. However, that edition doesn’t have a proper front end and needs to be paired up with an interface, such as Kibana. The AWS plug-ins also work with Nagios Core.
Pros:
- Extensive Plugin Support: Offers a variety of AWS-related templates and plugins for customized monitoring.
- Cross-Platform Availability: Compatible with both Windows and Linux operating systems.
- Open-Source Transparency: Provides a clear and transparent tool with community support.
Cons:
- Limited Support for Free Version: The open-source version lacks the level of professional support found in paid products.
Nagios XI is available on CentOS and Redhat Enterprise Linux. It can be purchased as a license. The cheapest license is the Standard Edition which costs $1,995 (£1,529) and includes configuration wizards and reporting. The next version is the Enterprise edition which costs $3,495 (£2,678) and also provides web-based server console access and audit logging. You can download the free trial of Nagios XI.
6. Paessler PRTG Network Monitor
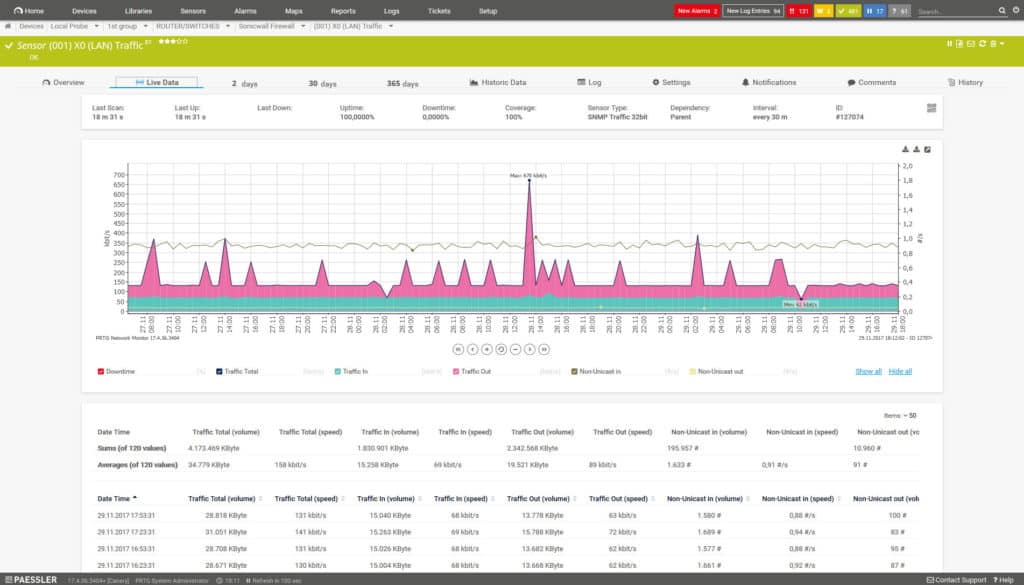
Paessler PRTG Network Monitor is a tool that has incorporated its own slant on AWS monitoring. Touting “all-in-one monitoring for your Amazon Cloud infrastructure“, it is free for users who need less than 100 sensors to monitor with, which makes it ideal for SMBs.
Key Features:
- AWS and Multi-Platform Monitoring: Monitors AWS alongside other platforms for a unified approach.
- Comprehensive Connection Monitoring: Observes connections as well as server resources for thorough analysis.
- Customizable Monitoring: Tailors monitoring to specific needs, avoiding unnecessary overhead.
Why do we recommend it?
Paessler PRTG Network Monitor has a misleading name because it also monitors servers and applications. It isn’t limited to monitoring on-premises servers because it can also extract activity data from cloud platforms, including AWS. The system is customizable, so you only pay for the monitoring capabilities that you need.
PRTG Network Monitor can use Amazon Web Service CloudWatch data to provide you with performance metrics on your Amazon Cloud service. The PRTG Network Monitor model is based on transparency targeted towards AWS and has its own CloudWatch sensors available out of the box. The CloudWatch sensors supported by PRTG Network Monitor include:
- Amazon CloudWatch Alarm Sensor
- Amazon CloudWatch EBS Sensor
- Amazon CloudWatch E Sensor
- Amazon CloudWatch ElastiCache Sensor
- Amazon CloudWatch ELB Sensor
- Amazon CloudWatch RDS Sensor
- Amazon CloudWatch SNS Sensor
- Amazon CloudWatch SQS Sensor
Each of these sensors has its own unique metrics that it uses to monitor the performance of your cloud service.
For instance, if you were using the AWS Elastic Cloud Computing (E) service then you would use the Amazon CloudWatch E Sensor. This sensor would tell you the CPU utilization, disk I/O, network load, status, and read and write speed. If you wanted to monitor load balancing provided by the Network Load, Balancer, the Application Load Balancer, or the Classic Load Balancer, you would activate the Amazon CloudWatch ELB Sensor of PRTG. All of this information is provided as numerical values in a table below as a range of larger dials for easy reading.
Who is it recommended for?
PRTG is available for on-premises installation on Windows Server. If you don’t have any servers running Windows, you can access the system as a SaaS package. The service is suitable for businesses of all sizes because you only pay for the sensors that you activate. If you only need 100, the package is free to use.
Pros:
- AWS-Specific Sensors: Pre-built sensors designed for AWS, providing targeted monitoring.
- Customizable Dashboard: Offers a user-friendly and adaptable interface with widget options.
- Free Version for Small Setups: A completely free version available for setups requiring less than 100 sensors.
Cons:
- Complex Interface: The feature-rich platform may require significant time investment to fully master.
PRTG Network Monitor is a tool that is most suited for those looking for a general network monitoring solution with AWS server monitoring capabilities. The paid versions of PRTG Network Monitor start from $1,600 (£1,226) for 500 sensors. The largest version of PRTG is PRTG XL1 which costs $14,500 (£11,112) and provides you with unlimited sensors. You can also download a 30-day free trial.
8. Dynatrace
Dynatrace is a network monitoring solution that allows you to thoroughly examine the performance of your AWS resources. If your service is experiencing poor performance then Dynatrace will be able to tell you. You can view the performance data and health status of your AWS resource. It is interesting to note that Dynatrace is actually affiliated with AWS as an AWS APN Advanced Technology Partner.
Key Features:
- Advanced AI Monitoring: Leverages AI for insightful analysis and problem detection on AWS.
- Integrated AWS Support: Offers deep integrations with various AWS services for comprehensive monitoring.
- Resource Optimization: Maps out resource requirements for efficient usage and allocation.
Why do we recommend it?
Dynatrace excels at identifying the resource demands of applications. The tool uses machine learning to calculate the requirements of all applications so it can spot when server resource availability is insufficient. It is able to track AWS and other cloud platforms as well as on-premises servers.
Machine learning is a feature that separates Dynatrace from other run-of-the-mill network monitoring products. Dynatrace uses machine learning to monitor AWS services and detect abnormal behavior. Whether you’re using E, EBS, ELB, S3, or RDS, Dynatrace has you covered and can point to the root cause of most performance issues. This is invaluable when troubleshooting the service (particularly when transparency over AWS is so hard to come by!).
There is also considerable support for larger organizations that want to concentrate on optimizing resource usage. Dynatrace has its own Smartscape visualization system which shows you how much of your resource is being dedicated to each service. This allows you to see if there are ways you could optimize how your resources are being used.
Who is it recommended for?
The Dynatrace package can be downloaded but it only runs on Linux. So, if you only have servers running Windows, you should opt for the SaaS platform version. This tool is particularly interesting for businesses that have complicated applications that source components from many locations, such as microservices.
Pros:
Visual Dashboards: Highly visual and customizable dashboards suitable for enterprise monitoring.
Cloud-Agnostic: Operates independently of platforms, providing flexible monitoring solutions.
AI-Assisted Troubleshooting: Utilizes AI for baseline analysis and aids in problem-solving.
Cons:
- Limited Trial Period: A longer trial period would be more beneficial for comprehensive testing.
- Complexity for Smaller Networks: Features may be too advanced for the needs of smaller businesses.
As an AWS monitoring product, Dynatrace is top notch. Its use of machine learning and its close partnership with Amazon make it one of the most natural solutions for monitoring AWS resources. Dynatrace is available as an on-premises installation, SaaS package, or a license. However, you’ll need to contact the company directly to receive a price quote. You can download a 15-day free trial of Dynatrace.
9. AppDynamics
AppDynamics is a network monitoring provider that delivers a full-stack performance monitoring experience for AWS. With AppDynamics you can monitor AWS like Amazon E, Amazon ECS, Amazon EKS, AWS Lambda, and AWS Fargate. This product can also automatically discover resources connected to your network.
Key Features:
- Automated Resource Discovery: Automatically discovers and monitors networked devices and applications.
- Detailed Dependency Mapping: Provides clear visualization of network and application dependencies.
- AWS-Specific Monitoring: Offers specialized monitoring capabilities for various AWS services.
Why do we recommend it?
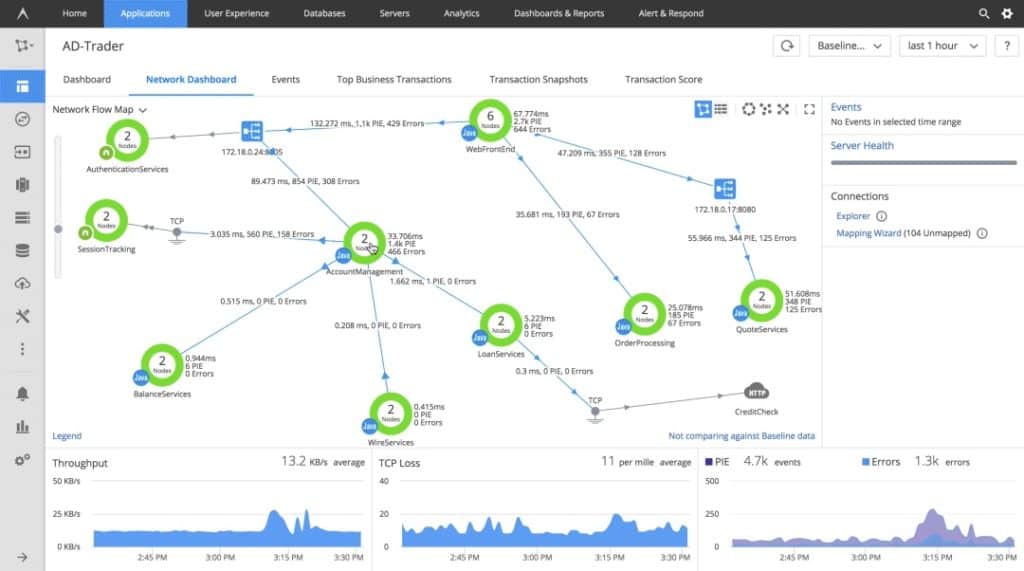
AppDynamics provides infrastructure and application monitoring. The tracking of cloud platforms, such as AWS is part of the Infrastructure Monitoring module. The package is able to collect activity data on all AWS services by connecting to AWS CloudWatch. The application monitoring module includes a discovery service. It creates an application dependency map, which identifies system resource demand.
The main reason to use AppDynamics is its user interface. The user interface provides you with a real-time perspective of your cloud resources which allows you to look specifically at resource utilization. This is important for AWS monitoring because it ensures you’re always making the best use of your resources.
However, you aren’t limited to AppDynamic’s core AWS monitoring experience. You also have a variety of extensions designed specifically to support AWS resource monitoring. For instance you can use an AWS SQS Monitoring Extension, AWS ElasticCache Monitoring Extension, and AWS S3 Monitoring Extension. The AWS ElasticCache extension is used to take data straight from Amazon CloudWatch and display it within AppDynamic’s Metric Browser. The AWS ELB Monitoring Extension also operates through CloudWatch to gather statistics on load balancing with the Network Load Balance, the Application Load =, Balancer, and the Classic Load Balancer of ELB.
Who is it recommended for?
AppDynamics is a SaaS package that is charged on a subscription model with a rate per CPU core. That structure makes the tool accessible to all businesses although the higher plans that include application monitoring are a little pricey. Smaller businesses that use AWS services would be interested in the affordable Infrastructure Monitoring Edition.
Pros:
Ideal for Large-Scale Enterprises: Tailored for complex and extensive enterprise environments.
Comprehensive AWS Support: Monitors multiple Amazon products like EKS, Lambda, ECS, and more.
Advanced Visualizations: Offers detailed dependency maps and visualizations for effective troubleshooting.
Cons:
- Higher Suitability for Complex Deployments: More beneficial for complex AWS deployments and hybrid cloud setups.
- Trial Period Limitation: A longer trial period would allow for more thorough evaluation in diverse environments.
If you’re looking for a state-of-the-art AWS monitoring experience then look no further than AppDynamics. To view the price for AppDynamics Application Performance Management you’ll need to contact the sales team (though the price is reported to be considerably higher than many other products on this list). That being said, there is also a free trial which you can download.
10. Zenoss
Zenoss started as a free, open-source project, called Zenoass Core. That version is now called the Zenoss Community Edition, while the system has evolved into a more comprehensive paid service.
Key Features:
- AWS ZenPack Extension: Adds AWS monitoring capabilities to Zenoss through a specialized extension.
- Full Stack Monitoring: Provides a complete overview of IT infrastructure, including AWS services.
- Performance Alerting: Notifies users of performance issues, aiding in prompt resolution.
Why do we recommend it?
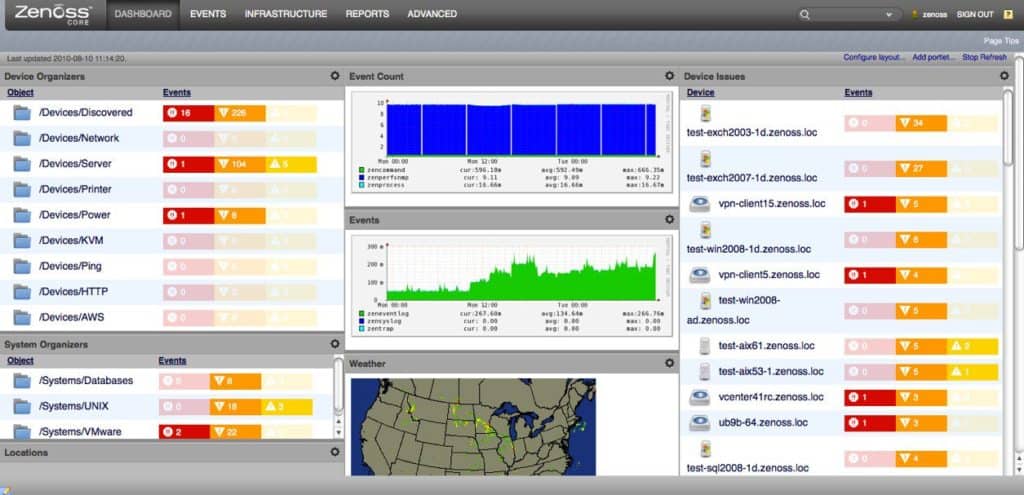
Zenoss is a good general monitoring package for IT systems but its Zenpack extensions make it a very interesting system for monitoring AWS services. The extension accesses AWS Cloudwatch data to provide live activity information in the Zenoss console. The package simultaneously monitors all of your other assets.
Zenoss has its own Amazon Web Services ZenPack designed for AWS monitoring. This Zenpack is available for free for all versions of Zenoss and it offers an extensive range of ways to monitor how AWS resources perform. You can monitor Amazon E, Amazon VPC, ELB load balancing, and Amazon S3 services. You can also monitor the estimated costs of your AWS resources.
Who is it recommended for?
The survival of the original free version of Zenoss provides a good option for small businesses. The capacity limits on the package indicate the size of business that should upgrade to the paid system. Zenpacks are available for all versions of the tool and the paid version is offered in SaaS and on-premises versions.
Pros:
Open-Source Community Edition: Offers a free, open-source version alongside paid options.
Automated Network Discovery: Automatically monitors new assets, simplifying network management.
Multi-Site Support: Capable of supporting complex networks encompassing both LAN and WAN.
Cons:
- Support Limited to Paid Tiers: Free version lacks the extensive support available in paid versions.
- Device Limitations in Free Version: The free version is restricted to monitoring a limited number of devices.
Zenoss Community Edition is recommended for those who want a free open-source monitoring package that has AWS monitoring capabilities. You can download Zenoss Comunity Edition for Windows, Linux, macOS, and Unix from Sourceforge. There are two versions of the paid Zenoss: Zenoss On-premises and Zenoss Cloud. The on-premises software runs on the same operating systems as the Community Edition. You’ll need to contact the sales team to receive a price quote. You can request a demo of Zenoss for free.
11. Splunk
Splunk is another well-respected name within the network monitoring space that includes a range of AWS monitoring capabilities. With Splunk you can view information on AWS instance changes, audit activity, security group violations, and unauthorized users. All of this information can be read through clear dashboard displays that stand with the very best on the market.
Key Features:
- Comprehensive AWS Resource Mapping: Provides detailed maps and overviews of AWS resources.
- Real-Time AWS Monitoring: Offers live monitoring capabilities for immediate insights into AWS performance.
- Advanced Data Visualizations: Features graphs and alerts for a clearer understanding of AWS metrics.
Why do we recommend it?
Splunk is a flexible data analysis tool. The producers of the system have also created a series of packages that provide pre-built applications on top of the Splunk system, such as the Infrastructure Monitoring package that is able to combine monitoring for AWS and other cloud platforms along with on-premises systems.
When it comes to the raw data, Splunk delivers an experience that provides you with everything you need to know. You are provided with utilization metrics, usage data, traffic volumes, load balancing activities, and latency data so that you can tell how your AWS cloud resource is performing. These metrics can be displayed in a variety of visualizations driven by account, region and time.
One of the most useful features offered by Splunk is a visual display of your AWS resources. There is a Topology view that shows you a map of your AWS cloud resources. You also have the option to view additional information and resources by region, account, VPC, and time. For instance, you can go back to an earlier point in time to see how your resources were structured in the past.
Who is it recommended for?
Splunk can be adapted to many data analysis tasks, not just system monitoring. You can save money by building your own analysis searches. However, there is no longer a free version of Splunk. Buying the Splunk Infrastructure Monitoring package is a great time saver.
Pros:
Behavioral Analysis Capabilities: Detects misconfigurations, performance trends, and potential security threats.
Highly Customizable Interface: Offers a user-friendly and adaptable dashboard with extensive customization options.
Cross-Platform Compatibility: Available for both Linux and Windows, catering to diverse IT environments.
Cons:
- Pricing Transparency: Requires direct contact with sales for pricing information.
- Complexity for Small Businesses: Some features may be too advanced for smaller network needs.
There are two versions of Splunk: Splunk Enterprise for on-premises installation and Splunk Cloud, which is a SaaS plan. The price for both systems is calculated through a formula. You can get a 14-day free trial of Splunk Cloud or a 60-day free trial of Splunk Enterprise.
12. Opsview
Opsview has its own fully-featured AWS monitoring capabilities. This tool allows you to view the performance of AWS instances through a high-quality display. In particular, you can view the current availability of your AWS service. Dashboards are completely customizable so that you can choose exactly how to monitor your cloud resources.
Key Features:
- AWS Performance Monitoring: Provides live monitoring of AWS services with customizable alerting.
- Flexible Dashboard Customization: Allows for tailored monitoring experiences with customizable screens.
- Graphical Data Representation: Offers a range of graphs and charts for an intuitive view of AWS metrics.
Why do we recommend it?
Opsview provides AWS monitoring along with its other infrastructure and application monitoring features. This service is able to keep track of your AWS account usage, raising an alert if the accumulated usage reaches your maximum budget for the month. The system can also monitor Azure and other cloud platforms.
The Opsview platform has notifications to keep you up-to-speed. Notifications can be sent via Slack, Amazon SNS, Twilio Voice, or Twilio Text. This helps you to stay up-to-date with changes affecting your resource performance. These notifications work on a range of filters that you can easily apply to AWS metrics. If you need more information you can generate reports based on historical AWS data.
Who is it recommended for?
Opsview is available in SaaS and self-hosting versions. The SaaS option, Opsview Cloud, is twice the price of the self-hosted Opsview Enterprise. In both cases, charges are levied as a subscription with a rate per monitored host. Opsview Enterprise runs on Linux, Hyper-V, or AWS EC2. There are MSP and SMB editions of both versions.
Pros:
- AWS and SNS Notifications: Supports AWS monitoring with notification capabilities via Amazon SNS.
- User-Friendly Interface: Features a clean and easy-to-navigate interface.
- Free and Paid Versions: Offers both a free version for smaller setups and a comprehensive paid version for larger networks.
Cons:
- Integration Features: Could benefit from additional integration capabilities with other IT management tools.
There is a free version of Opsview which covers up to 25 hosts on Linux and Windows. The first paid version is the SMB plan which costs $2 (£1.53) a host per month for up to 300 hosts. The next plan is the Enterprise Plan which costs $4.50 (£3.45) per host per month which offers up to 20,000 hosts. You can download Opsview for free.
13. Zabbix
Finally, we have Zabbix, an open-source network monitoring solution with over 300,000 installations worldwide. Zabbix has a range of cloud monitoring features and can monitor AWS services with ease. This tool has a traditional widget-based monitoring experience and the ability to convert metrics into graphs for further analysis.
Key Features:
- No-Cost Monitoring Solution: A completely free, open-source network monitoring solution with AWS capabilities.
- AWS-Specific Monitoring Templates: Offers specialized screens and templates for enhanced AWS monitoring.
- Expandable with Free Templates: Allows for the addition of new monitoring capabilities through free templates.
Why do we recommend it?
Zabbix is an on-premises system that provides full stack monitoring. This is a completely free system – there is no paid version. The system’s extensions are called templates and there is one available that connects to AWS CloudWatch.
Zabbix has a full-featured alerts system. You can customize alert messages to different recipients and even escalate automatically if the first point of contact doesn’t respond. This means that if something changes in your AWS environment then the alert will be passed to the next available staff member. You can also customize message content so that the recipient has all the information needed to do further troubleshooting.
Who is it recommended for?
Zabbix is attractive for small businesses that don’t want to pay for monitoring software. However, the tool has an impressive list of large organizations that use the system, so it is suitable for businesses of all sizes. The software for Zabbix installs on Linux.
Pros:
Open-Source Transparency: Offers complete transparency as an open-source tool.
Customized AWS Monitoring: Ideal for organizations seeking tailored AWS monitoring solutions.
Robust Notification System: Supports a variety of notification methods including SMS, email, and webhook.
Cons:
- Professional Support Costs: Access to professional support requires additional fees.
- Device Monitoring Limitations: The free version has limitations on the number of devices that can be monitored.
Organizations in need of a free tool for AWS monitoring would be well advised to download Zabbix. It has the core design to function well within an SME or large organization environment. Zabbix is available on CentOs, Oracle Linux, Red Hat Enterprise Linux, and Ubuntu. You can download Zabbix for free.
Fact: AWS has developed a name as the single most dominant cloud service provider globally. Right now, AWS makes up an astonishing 41.5% of application workloads in the public cloud.
Choosing an AWS Monitoring Tool
That concludes our look at the best Amazon Web Services monitoring tools. In the interests of keeping your monitoring simple, we recommend you choose a tool like ManageEngine Applications Manager.
In most cases, these application monitoring tools don’t have AWS monitoring screens included with them automatically. However, with a simple activation button in the settings screens, AWS monitoring becomes available.
Integrations add on monitoring of the AWS environment and any extra services, such as the Network Load Balancers, Applications Load Balancers, or Classic Load Balances of ELB. In other monitoring tools, AWS monitoring is provided by add-ons or plugins. This is the case with Nagios, Zenoss, ServerDensity, and AppDynamics.
AWS Monitoring Tools & Services FAQs
What is the main benefit of CloudFront?
Amazon CloudFront is a content delivery network (CDN). This type of service stores copies of web content on several servers around the globe. The two main benefits of this strategy are that it cuts down delivery times to website visitors who are located far away from the original web server and that content will still be available globally if the main web server goes offline. If one CDN server goes offline another can take over the responsibility of delivering the content to the region that it covered.
What are the basic security settings we need to monitor while using AWS?
The biggest security setting that you need to watch on your AWS account is the user account credentials. Anyone who can get into your account with administrator privileges will have the ability to steal data, lock you out, destroy the site, or insert malware to attack others.
What is AWS detailed monitoring?
AWS has a monitoring system called CloudWatch. Basic monitoring in CloudWatch samples performance metrics for an instance every five minutes. This level of supervision can be upgraded to detailed monitoring. The detailed monitoring plan samples statuses every minute and enables statistics on several instances to be aggregated into a summary, removing the need to relaunch the service for each instance to check on performance.
See also: Best Security Information and Event Management (SIEM) Tools

