Today there is an abundance of apps designed to fulfill almost any business process you can think of. Modern networks are increasingly reliant on applications to interact with customers and to run day-to-day operations. All of these applications need to be monitored and maintained to keep the end-user experience high for customers. Application performance management has arisen as the answer to this challenge.
Application Performance Management (APM) is being used to monitor applications, cloud services, and virtualized services to ensure that the customer enjoys the best user experience possible. In this article, we’re going to look at what Application Performance Management is, and what the fundamentals of APM are.
Here is our list of the best application performance management tools:
- Site24x7 Application Performance Monitoring (EDITOR’S CHOICE) This package of tools from a cloud platform is particularly strong at monitoring serverless systems for Web applications. Start a 30-day free trial.
- Paessler PRTG (FREE TRIAL) This flexible package provides monitoring tools for networks, servers, and applications. It is very strong with on-premises systems. Available for Windows Server or as a SaaS platform. Start a 30-day free trial.
- Datadog APM (FREE TRIAL) This cloud service focuses on monitoring Web applications and a companion module, called Infrastructure offers monitoring for traditional applications. Start a 14-day free trial.
- AppDynamics This package uses AI to track applications by watching process flows and it then creates an interdependency map.
- SolarWinds Server & Application Monitor This on-premises package provides monitoring for servers, cloud platforms, services, and applications. It can monitor systems based on the cloud as well as on-premises applications. Runs on Windows Server.
What is Application Performance Management?
Application Performance Management is the name given to the practice of managing the performance and availability of software applications. There are many ways this can be done but most of the time this is done through an application performance monitor. Application performance monitors are used to monitor application performance, code processes, dependencies, and transaction times. Application Performance Management seeks to provide end users with the best experience possible. This is achieved by keeping a close eye on performance issues as they occur.
Popular application performance monitoring solution providers include SolarWinds, Paessler, AppDynamics, and New Relic. These tools have established themselves as key application performance management solutions. Features offered by these tools include real-time user monitoring, root-time cause analysis, and web performance monitoring to stay on top of performance concerns as they occur.
It is important to note that there is no universally accepted definition of what Application Performance Management is. If you asked several administrators they would each have a slightly different answer. However, in principle, Application Performance Management comes down to performance monitoring to ensure the best end-user experience for customers.
How does Application Performance Management Work?
As a practice, application performance management places more emphasis on response times than availability. In order to deliver a good experience to the end user, application response times need to be kept to an absolute minimum. To do this, Application Performance Management needs to have these three components:
- Digital Experience Monitoring
- Application Discovery Tracing and Diagnostics
- Artificial Intelligence for IT Operations
Each of these comes together to provide a complete Application Performance Management strategy. Digital experience monitoring is a mixture of real user monitoring and transaction monitoring. Application discovery, tracing, and diagnostics combines application discovery and analysis of application transactions to find performance issues. Finally, artificial intelligence for IT operations is used for combined root cause analysis and alerts to respond to issues quickly.
Our methodology for selecting Application Performance Management and Monitoring Solution Providers
We’ve broken down our analysis for you based on these key criteria:
- Ease of Use: We evaluated how user-friendly and intuitive the interface is for both technical and non-technical users.
- Feature Set: The range and depth of features offered, including monitoring, alerts, and analytics capabilities.
- Scalability: How well the solution scales with growing business needs, including support for both small and large enterprises.
- Integration: The ability to integrate with various applications, platforms, and services, enhancing overall functionality.
- Cost-Effectiveness: The value provided for the price, considering both upfront and ongoing costs.
Application Performance Management and Monitoring Solution Providers
1. Site24x7 Application Performance Monitoring (FREE TRIAL)
Site24x7 Application Performance Monitoring is a collection of tools on the Site24x7 cloud platform rather than a single unit. The Site24x7 system is offered in plans that combine just about all the modules on the platform and there is an APM plan available. The edition provides server, network, and infrastructure monitoring as well as application management features.
Key Features:
- Distributed Tracing: Tracks requests across various services for better insight.
- Code Profiling: Analyzes code performance and identifies bottlenecks.
- Application Dependency Mapping: Visualizes interdependencies between components.
- Serverless Monitoring: Monitors activities on serverless accounts.
Why do we recommend it?
The duties of an APM have shifted over the past few years and Site24x7 Application Performance Monitoring has moved along with that definition. While databases email systems, and web servers are considered to be applications, these are now categorized as “infrastructure” for the purposes of monitoring and the APM focuses on the intricacies of web applications, which are composed of microservices.
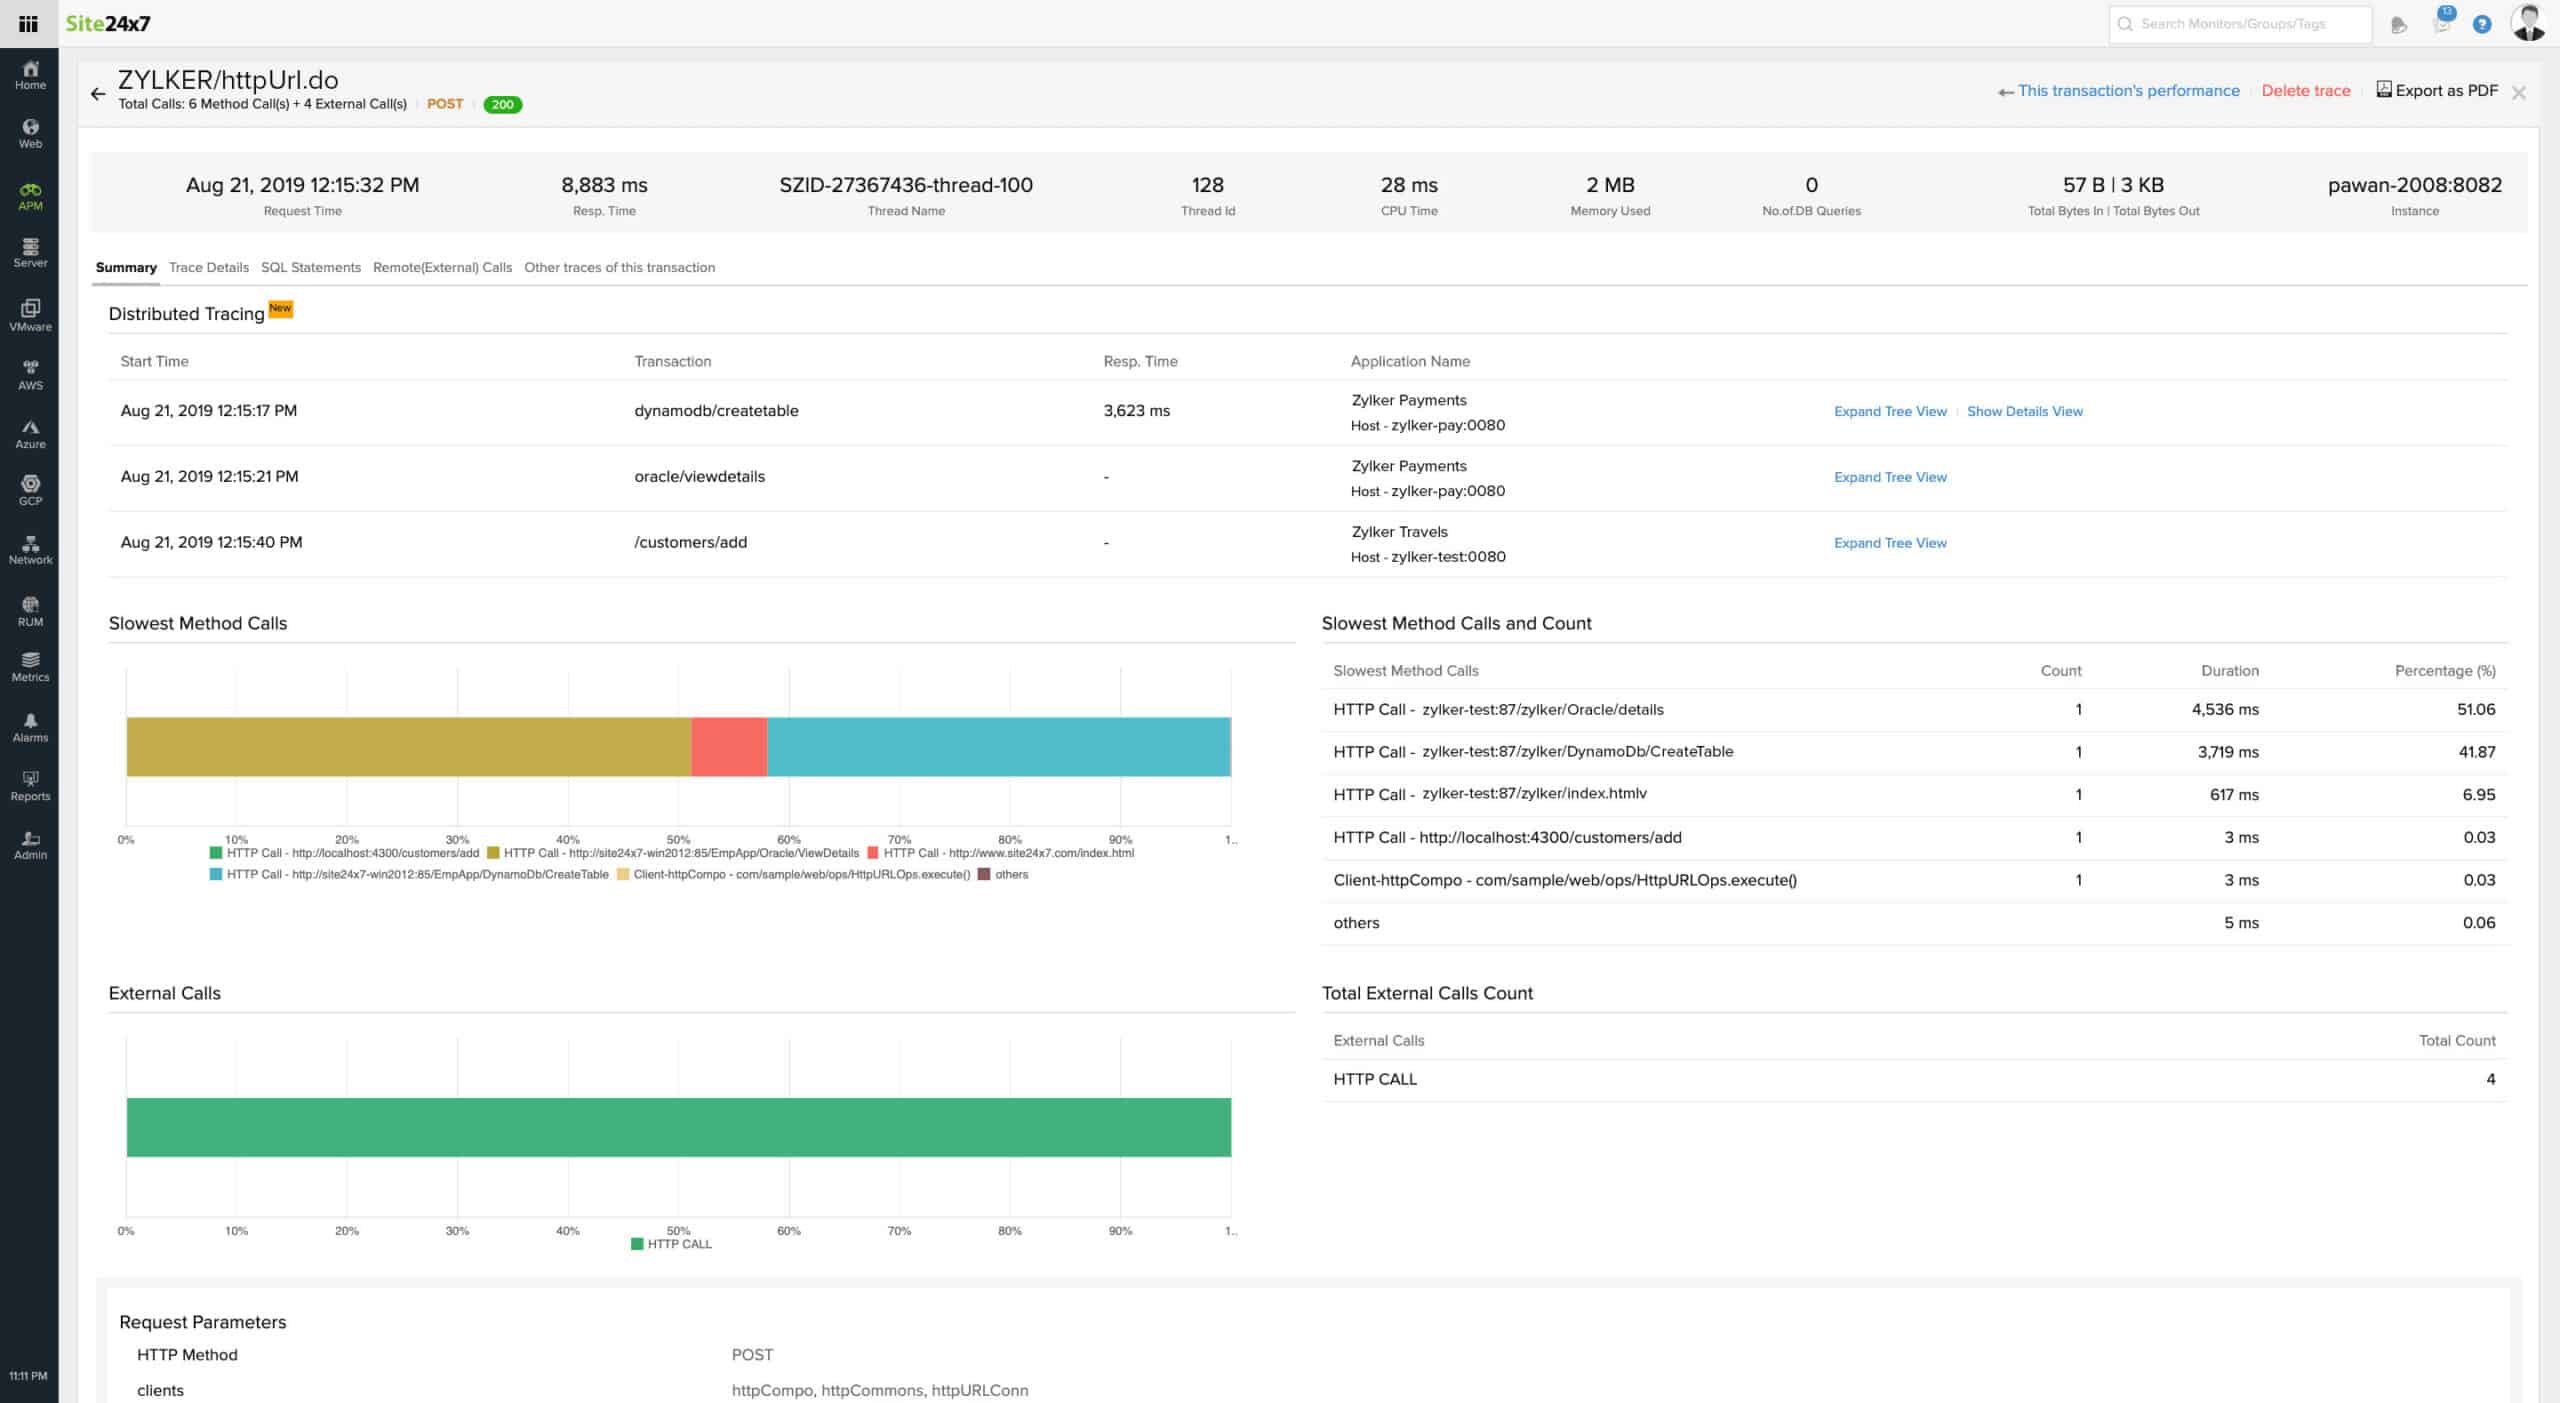
The core facilities in the Site24x7 APM deal are its distributed tracing and code profiling utilities. These, together with server monitoring, which can also track the activity on serverless accounts, cater to web application monitoring needs. The system will thread together an application dependency map so troubleshooting administrators can see the root cause of any problem as soon as it emerges.
The APM edition includes network device and traffic monitoring features. It also looks at the resource utilization on servers and cloud accounts. These factors are important when considering application performance because it could be that the network is failing or the server is overloaded and there is nothing fundamentally wrong with your application code. So, getting a full stack view of application delivery issues cuts out the time wasted looking in the wrong place for a fast solution to performance problems.
Who is it recommended for?
Businesses that don’t deploy web applications won’t need the full suite of utilities offered for application performance monitoring by Site24x7. Instead, they should look at the Infrastructure plan. However, as both these plans contain the same modules in different configurations, the difference between the plans is just a matter of fine-tuning.
Pros:
- Real-Time Code Execution Visibility: Shows scripting code in action, providing valuable insights.
- Comprehensive Issue Correlation: Correlates performance issues across the entire technology stack.
- Cloud-Based Solution: Hosted in the cloud with cloud storage for easy access to metrics.
- Live and Historical Analysis: Offers both live activity tracking and historical performance analysis.
Cons:
- Costly for Large Enterprises: Expensive for large companies due to capacity expansion costs.
The Site24x7 system is a subscription service and although there are many plans to choose from, all of them contain almost identical modules. So, it doesn’t really matter whether you opt for the APM or the Infrastructure plan because both are able to simultaneously track hosted applications and Web applications that are run on serverless accounts. You can work out exactly which units you need to activate on the Site24x7 platform by requesting a 30-day free trial.
2. Paessler PRTG (FREE TRIAL)
Of the free and paid application monitoring experiences available to you, Paessler PRTG Network Monitor has to be one of the most comprehensive on the market. PRTG Network Monitor is a performance monitoring platform that can monitor applications whether they’re virtualized or hosted in the cloud.
Key Features:
- Customizable Package: Tailor the monitoring system to your needs by activating specific sensors.
- Full Stack Observability: Offers a comprehensive view of the entire application stack.
- Demand Correlation: Links performance metrics to demand, aiding in troubleshooting.
Why do we recommend it?
Paessler PRTG is a very large package of monitoring systems. No one will ever need all of those tools and so they are delivered and switched off. Buyers look through the list to find those sensors that relate to the assets that they use. By activating only those relevant sensors, each butter customizes the package.
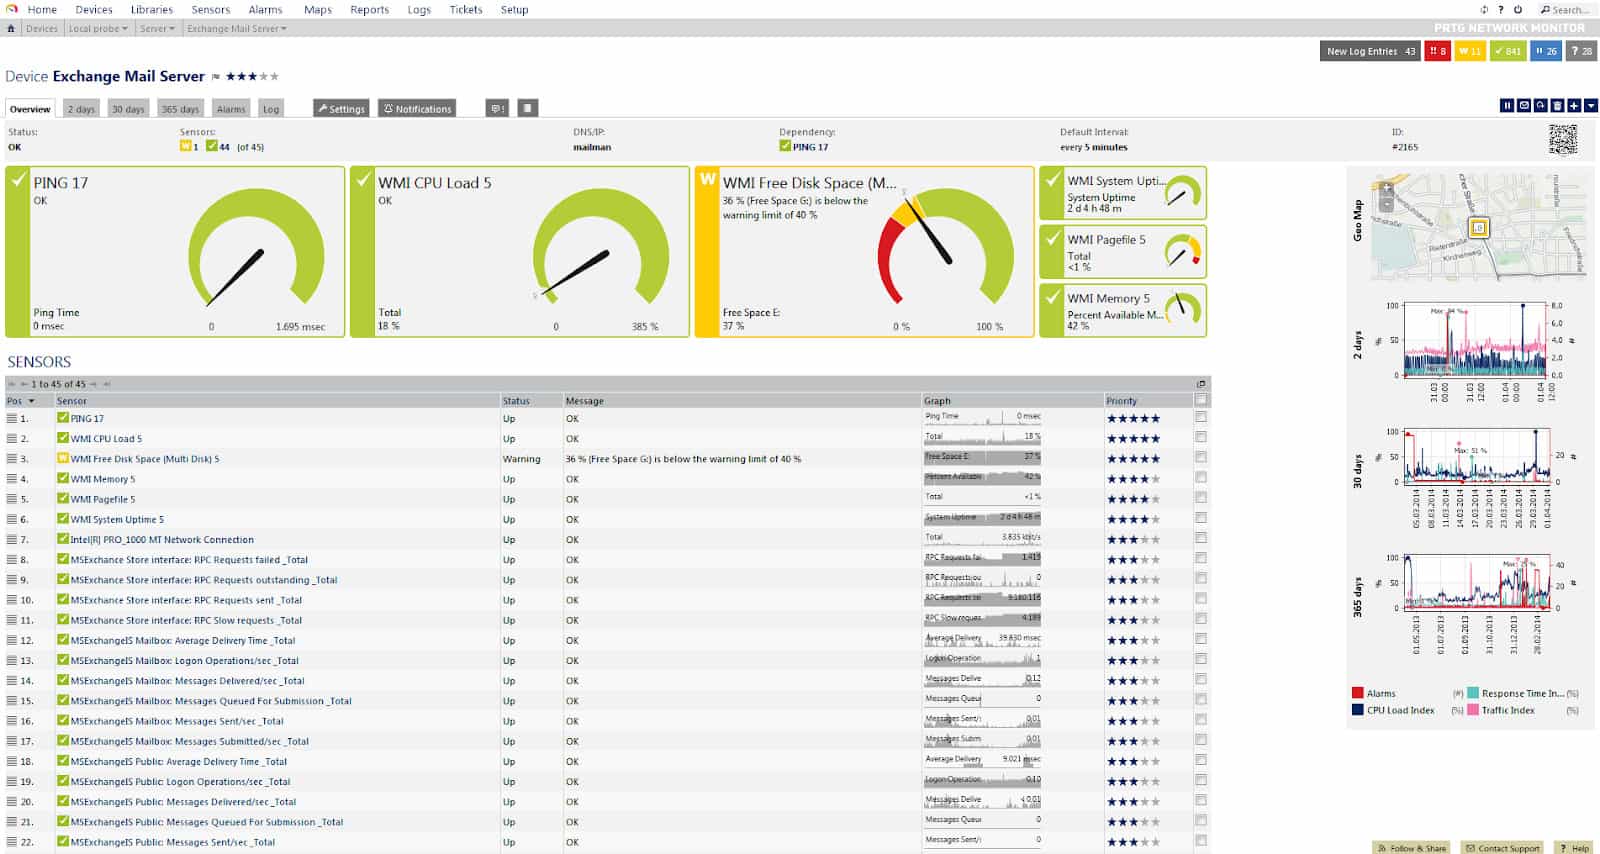
Paessler PRTG Network Monitor combines standard application management and individual web application management to provide you with an overview of every application being used within your network. The performance of all connected applications is shown to you through a color-coded dashboard view which shows you whether applications are up or down.
Some of the monitoring capabilities that PRTG Network Monitor offers the user include SQL Server monitoring, mail server monitoring, and web server monitoring. These provide small to medium-sized enterprises with everything needed to monitor application performance effectively.
Paessler PRTG Network Monitor is also a suitable solution for those who want to take more of a back seat approach to network monitoring. PRTG Network Monitor has an alerts system which notifies you when an application’s performance drops below a certain standard.
Who is it recommended for?
PRTG appeal to a wide market because it is available as an on-premises package for Windows Server and as a SaaS platform. However, it doesn’t include distributed tracing for microservices and so it isn’t strong on tracking web applications. It is strong at monitoring server-based applications, the servers that host them, virtualizations and containers, and networks.
Pros:
- Versatile Monitoring Techniques: Uses packet sniffing, WMI, and SNMP to report network performance and discover new devices.
- Real-Time Autodiscovery: Instantly updates inventory to reflect the latest changes.
- User-Friendly Interface: Drag-and-drop editor simplifies building custom views and reports.
- Flexible Alert System: Supports alerts via SMS, email, and third-party integrations.
Cons:
- Steep Learning Curve: The comprehensive nature and numerous features require significant time to master.
This makes sure that you never miss out on any information that could help you to get an application back on track. Paessler has made the PRTG Network Monitor available on a free trial for evaluation.
See also: Paessler PRTG Network Monitor Review
3. Datadog APM (FREE TRIAL)
Datadog has two modules that can trace applications. Over the years, this cloud-based platform has focused its APM service more on distributed tracing for microservices. Straightforward, hosted, and visible applications, such as databases or web servers, are monitored by the company’s Infrastructure package.
Key Features:
- Distributed Tracing: Monitors the performance of microservices.
- Code Profiling: Analyzes code execution to pinpoint issues.
- Container Examination: Examines the performance of containerized applications.
- Cloud Platform Scanning: Scans and monitors cloud platforms for performance.
Why do we recommend it?
Datadog APM keeps evolving and so it has new services coming online regularly. This system is now offered in three plans and all of them include application discovery and dependency mapping. As well as implementing live activity monitoring with alerts for performance problems, the system stores metrics for historical analysis.
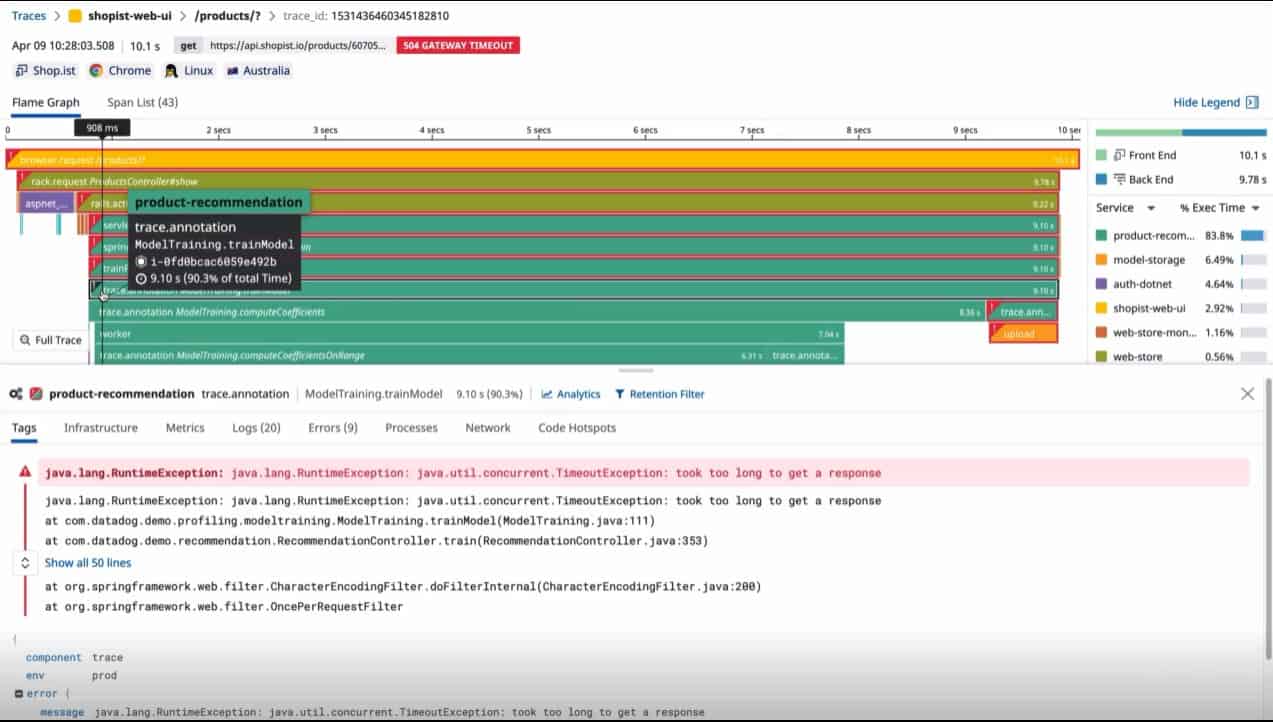
The Datadog APM service uses service mapping to identify all supporting functions and then implements distributed tracing to watch how each module performs. A higher plan of the APM service includes a continuous profiler, which will walk through all the lines of code for the discovered microservices. The profiler can also be run on demand to step through lines of code and watch their impact on system resources.
Combining the APM package with other modules available from Datadog brings greater insights. Good examples of modules that work well with the APM are the Infrastructure monitoring system, the Synthetic Monitoring service, and the Real-user Monitoring package.
Who is it recommended for?
The APM originally looked after all applications. Now, it is focused on web applications, while platformed services, such as databases and email servers are taken care of by the Infrastructure Monitoring module. So, if you have both server-based and serverless systems to look after you will need both of those modules.
Pros:
- Comprehensive Function Discovery: Tracks functions behind APIs and frameworks through a robust discovery process.
- Dependency Mapping: Provides clear visualizations of service dependencies.
- Distributed Tracing Monitoring: Identifies performance issues across distributed systems.
Cons:
- Extra Cost for Code Profiler: The continuous code profiler incurs additional costs.
Datadog offers a 14-day free trial of all of its modules.
4. AppDynamics
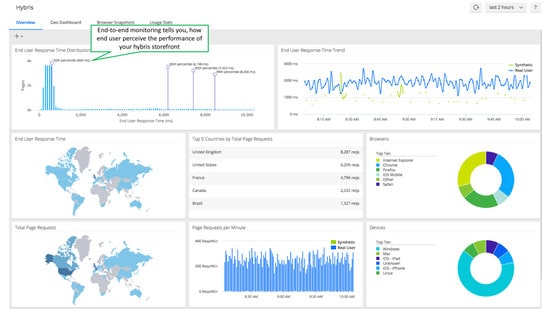
AppDynamics is a textbook application performance monitoring tool used for measuring application performance. Through one platform you can automatically discover applications and monitor applications right down to a single line of code. Every transaction and user interaction can be monitored and measured to provide the best service possible.
Key Features:
- Application Monitoring Plans: Offers two plan levels for monitoring applications.
- Infrastructure Monitoring: Monitors infrastructure alongside applications.
- SAP Monitoring Option: Provides a specialized option for SAP system monitoring.
Why do we recommend it?
AppDynamics follows process flows to link together related applications. This gives the service an application dependency map that extended down to server and cloud platform resources. Links can cross platforms, even from on-premises servers to cloud services. These relationships inform performance monitoring by tracking impending demand on server resources.
To assist the process of Application Performance Management, AppDynamics has put in place machine learning to detect performance anomalies. AppDynamics can recognize the normal patterns of a well-performing device and identify when an application is being adversely affected. This means the moment that an application starts to experience poor response times the user is shown an alert and the machine learning solution will help to point out the source of the fault at the code level. Finding the piece of fault code is invaluable for pinning down what is behind the poor performance.
Who is it recommended for?
This package is particularly necessary for businesses that operate hybrid systems. There are many applications now that rely on elements on both servers and cloud systems. While these systems, in the past, were difficult to keep track of, AppDynamics and monitoring services like it are now making hybrid systems manageable.
Pros:
- Enterprise-Grade Solution: Tailored specifically for large-scale enterprise use.
- Advanced Dependency Mapping: Offers excellent visualizations for troubleshooting complex application systems.
- Root Cause Analysis: Identifies the root cause of performance issues efficiently.
Cons:
- Higher Pricing: More expensive compared to similar tools on the market.
- Complex for Small Networks: Can be overly complex for smaller networks looking for straightforward application performance management.
Learn more about AppDynamics and how it compares to Splunk.
See also: The 10 Best Application Performance Management and Monitoring tools
5. SolarWinds SAM
SolarWinds are a company that is well-known for creating some of the leading network monitoring products and this is true in the realm of application performance management as well. SolarWinds Server & Application Monitor has been designed specifically to monitor application performance and conduct in-depth diagnostics.
Key Features:
- Windows Server Compatibility: Runs efficiently on Windows Server.
- Server Resource Monitoring: Records and analyzes server resource capacities.
- Process Tracking: Monitors and follows running processes.
- Service Dependency Mapping: Generates maps to illustrate service dependencies.
- Resource Shortage Identification: Identifies and alerts on resource shortages.
Why do we recommend it?
SolarWinds Server & Application Monitor records all servers and scans each to record all resources and their capacities. The tool then watches running processes to see which applications run on each server and then chains through spawned processes to identify application dependencies. The tool is then able to forecast server resource requirements.
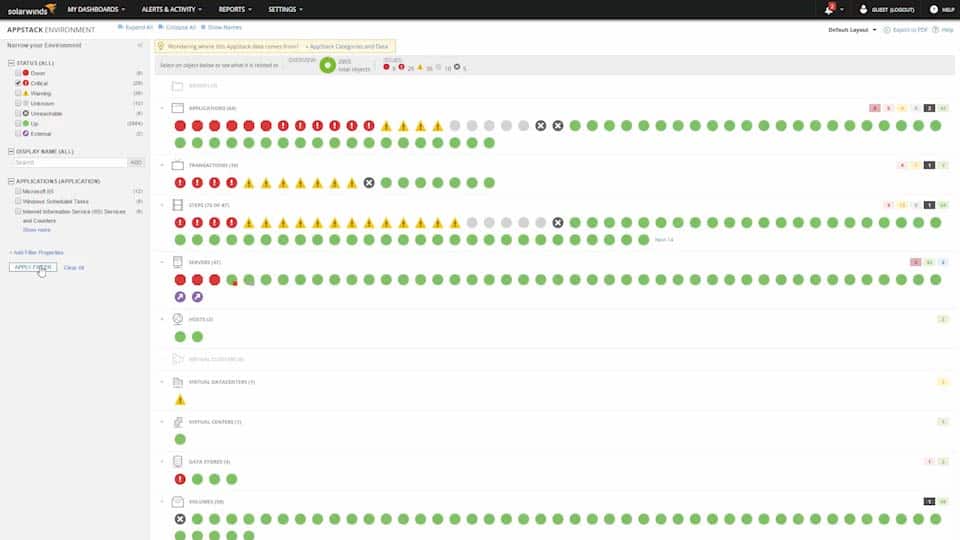
Application performance can be managed through the program’s dashboard where you are shown a summary of connected applications and an overview of application health. The performance of applications is denoted as Up, Critical, Warning, Down, Unknown or Other. Each status is color-coded so that you can identify performance issues from a glance.
One particularly useful feature offered by SolarWinds Server & and Application Monitor is that of monitoring templates. There are preconfigured monitoring templates for popular applications like IIS, Active Directory, Java, and Oracle. These templates help you to customize your performance monitoring approach according to the program that you are using.
Who is it recommended for?
This package is particularly useful for businesses that have many servers. Such a setup would be impossible to track manually, so the automated monitoring services of the Server & Application Monitor save effort and covers all possibilities. This system is delivered as a software package for Windows Server.
Pros:
- Enterprise-Focused Design: Tailored for large and enterprise networks, offering robust features.
- Real-Time Auto-Discovery: Automatically builds network topology maps and inventory lists as new devices are added.
- Preconfigured Templates: Provides extensive templates for quick and easy setup, enhancing immediate value.
- Comprehensive Monitoring: Supports both SNMP monitoring and packet analysis for detailed control.
- Customizable Dashboard: Allows customization with drag-and-drop widgets for a personalized interface.
Cons:
- Technical User Requirement: Geared towards IT professionals, making it less suitable for non-technical users.
On the whole SolarWinds Server & Application Monitor is a great option because it embraces an autodiscovery feature to locate connected applications. Using auto-discovering applications means that you don’t have to find them manually. In addition, the tool will also calculate baseline thresholds that determine when you will receive performance alerts.
See also: SolarWinds Server & Application Monitor Review
The Difference Between Application Performance Management and Application Performance Monitoring
Application Performance Management and Application Performance Monitoring are two different concepts. Application Performance Monitoring is the process of using a software platform to monitor end user experience, application architecture modeling, transaction analysis, analytics, and application-driven monitoring. In Application Performance Monitoring the focus is on the end user experience of the application stack.
Application Performance Management takes a step back and places the main emphasis on resource utilization. The performance of applications and the end-user is integral to this model. However, this mode is more about the bigger picture for the end-user rather than the more targeted focus of Application Performance Monitoring. The latter of which is used to make incremental improvements to the user experience piece by piece.
The clearest way to see the difference is to think of Application Performance Management as looking at all applications in one go, whereas Application Performance Monitoring is monitoring the minutiae of an individual application. In many ways, the difference between the two of them can be thought of as scale.
What is the purpose of Application Performance Monitoring?
The purpose of Application Performance Monitoring is to maintain the performance of an application by diagnosing small problems. Tools like AppDynamics and Dynatrace have a deep dive approach to this that lets you view application performance right down to lines of code to deal with small issues that can have an adverse impact on the end-user experience.
Metric-wise, an Application Performance Monitoring solution will pull metrics and transaction data from an application in an attempt to solve performance issues. More specifically this information is used for root cause analysis so that small faults can be located and addressed. On a larger scale, application performance management takes care of managing larger metrics like CPU and memory usage. This can point to a root cause in its own right.
What is the End Goal of Application Performance Management and Application Performance Monitoring?
These two models also differ in their goals. Application Performance Management is preoccupied with concerns over endpoints and end-users. The performance of every application must be taken into account to have a balanced perspective of the end user’s experience. After all, the user experience isn’t impacted by one application but multiple applications.
Application Performance Monitoring’s ultimate goal is to assess how one application is performing. If the performance of the application is satisfactory, then the goal is complete. However, if individual processes are slow then it is the job of this model to get to the bottom of what the problem is.
Application Performance Management Tools Characteristics
Application Performance Management tools come in many different shapes and sizes but there are a number of key characteristics that each has. These are as follows:
- Application Discovery
- Key Performance Indicators (KPIs)
- Alerts and Notifications
- Code Level Performance Analysis
- Custom Dashboards
- Reporting
- Application Support
- Application Log Data
Application Discovery
Applications can be a tricky entity to pin down without an autodiscovery feature. Almost all Application Performance Management tools incorporate application discovery features to find connected applications and servers automatically. Once applications are discovered they are added to your monitoring environment so that you can keep track of their performance.
Autodiscovery is advantageous because it maps out your applications for you. This is true not only during the initial setup process but also for when you add new applications for your network. Having all of your applications added to your environment automatically allows you to focus on analyzing rather than configurations.
Key Performance Indicators (KPIs)
It goes without saying that it is next to impossible to monitor the performance of applications if you don’t have the right metrics. Application Performance Management tools incorporate a range of KPIs that are used to measure the performance of an application. KPIs include CPU utilization, disk utilization, error states, requests per minute, and response times. These metrics are essential for seeing how well your applications are functioning.
Alerts and Notifications
One of the most important features of application performance management tools is that of alerts and notifications. No platform would be complete without the ability to notify you when application performance takes a nosedive. Many performance management tools allow you to configure your own alert thresholds so that you receive notifications to keep you up-to-speed with current developments.
This is the bare minimum present on most application performance management tools. However, to ensure that you don’t fall behind performance issues you need to be able to execute automated responses. For example, you could configure your platform to automatically restart a virtual machine when an alert is raised.
Code Level Performance Analysis
The only way to get a complete perspective of an application’s performance is by analyzing it at the code level. Performance analysis at the code level is a prerequisite for making sure that every application is functioning properly. When an application is buggy and slow, cutting down to the code level provides you with a way to get the insights you need to find a solution.
If the application is providing a poor user experience to the end user you will be able to point to the root of the problem. For instance, you’ll know the exact reason why a web request has failed. This will be invaluable for getting the application’s performance back on track for the user.
Custom Dashboards
The effectiveness of the application monitoring experience rests on how much visibility you have over your network infrastructure. A dashboard that displays all the core metrics and performance data is the only way to put all of this information into a format that the user can easily understand. This is particularly true for organizations attempting to manage hundreds of different apps.
Application performance management dashboards will provide you with data on server availability, infrastructure status, alerts, and graphs. The dashboard should provide you with a broad view which allows you to narrow down smaller problematic issues which you can address to improve the end user experience.
Reporting
Dashboards are great for catching the general trends, but there are many occasions where you’ll need to take a more prolonged look at long-term trends. Generating reports periodically is the only way to do this. Most Application Performance Management solutions allow users to create reports to check up at how performance is maintained over the long-term.
Many tools can use past usage data to predict the future performance of your applications. Many tools allow you to check server utilization over time. This is useful because it allows you to plan for your future needs and ensure that infrastructure is upgraded before you run into any issues.
Application Support
One of the key characteristics of Application Performance Management solutions is their wide-ranging support for a variety of different applications. Depending on your organization, you’re likely to be using a custom application to manage your network infrastructure. As a result, is always a good idea to use an Application Performance Management solution that has the ability to monitor your custom application. Most Application Performance Management solutions provide you with the opportunity to do this.
Application Log Data
Every Application Performance Management solution worth its salt allows the user to access application log data. Application log data is one of the most valuable resources available to developers when addressing performance issues. Being able to access log data through one platform provides you with much more control over the end performance of your devices.
See also: Improving Java Application Performance
Application Performance Management Challenges
Given the variety of applications in use within modern networks, it is important to recognize that Application Performance Management is no simple task. Performance issues can rear their ugly heads in hundreds of different ways. In this section, we’re going to take a look at some of the main challenges that Application Performance Management brings to the table.
Overemphasizing Troubleshooting
One of the biggest pitfalls that organizations run into with Application Performance Management tools is that they place too much emphasis on troubleshooting. Focusing on troubleshooting puts an enterprise into a reactive state. The user is merely responding to performance issues as they occur rather than taking the steps to address potential issues down the line.
The key to Application Performance Management is to be proactive and to anticipate your performance needs over time. Using predictive features and reports can help to navigate this challenge by providing you with an idea of what is happening over the long term. Failure to do so can place you into a state where you’re constantly playing catch up to fulfill the needs of your applications.
Alert Timeframe
Although almost every Application Performance Management solution uses alerts in one form or another, there is a big difference in the effectiveness depending on how fast alerts respond. In the world of applications, a lot can change in a few minutes. As such, platforms that take over five minutes to send an alert to your team can leave you significantly behind performance problems.
This is compounded by the fact that the end user and customers are going to be finding out these issues before you’ve even had a chance to register the problem. The lower the alert time frame the more quickly you can take steps to get your application back to peak performance. The earlier you discover performance problems the sooner you can provide your end users with the services they require.
Chasing Errors and Not Root Causes
Though many solutions have root cause detection solutions it is still very easy to fall into the trap of chasing errors rather than the root cause of errors. For instance, you may be able to identify that a bottleneck is causing poor performance within the application. However, you now need to be able to delve much deeper to find out why this is.
Analyzing at the code level can help to address this challenge because it allows you to take a look at the minutiae of the performance. Tools like AppDynamics have their own root cause detection features which allow you to pinpoint the segment of code that is causing the problem.
Using Application Performance Management Analytics
The secret to staying on top of future developments is to make use of Application Performance Management analytics. Analytics can analyze the performance of applications and automatically detect performance anomalies. This makes sure that the platform recognizes performance concerns before they take root.
Application Performance Management analytics can be a problem for many organizations because they don’t have these in place. Without analytics, you’re forced to rely on less battle-tested means to detect performance anomalies. Inevitably this allows some performance issues to slip through the net.
Application Performance Management and the Future
The more organizations incorporate applications into their network, the more need there is to adopt Application Performance Management to provide the best possible performance of applications. As the real-time experience of end users continues to be important Application Performance Management as a practice will be here to stay.
However, there appears to be a push towards User Experience Management (UXM). UXM has a slightly different emphasis than Application Performance Management and focuses on trying to maximize the end user experience of customers. Application Performance Management is increasingly moving towards preemptively managing user experience concerns.
Meticulously monitoring application performance allows you to make sure that you can spot performance issues and get to the root cause to minimize disruption to the end user. In many cases, you may even be able to use these tools to intercede before the end user even notices.
While User Experience Management seems similar to Application Performance Management, the two are apart in terms of standards. User Experience Management has much higher expectations of application performance and isn’t just seeking to ensure that performance issues are dealt with but also to optimize performance.

