When it comes to application performance monitoring (APM), two names stand out as industry leaders: AppDynamics and Dynatrace. Both platforms have earned widespread recognition for their ability to provide in-depth visibility into application performance and business transaction health across complex infrastructures. Organizations seeking to optimize their applications rely on these tools to identify performance bottlenecks, reduce downtime, and enhance user experiences.
Why Application Performance Management is Essential
APM tools like AppDynamics and Dynatrace are invaluable for maintaining high-performing applications in today’s fast-paced digital environments. These tools monitor application metrics such as response times, error rates, and resource usage in real-time.
Both of these APMs offer actionable insights into how applications interact with underlying hardware, software, and network layers. By proactively identifying performance issues, APM tools ensure consistent application delivery, improve end-user satisfaction and help align IT performance with business objectives.
Cloud-Based vs. On-Premises Solutions
One of the key differentiators between application performance monitoring solutions is how they are hosted. Both cloud-based and on-premises solutions have their relative advantages.
Cloud-based monitoring tools, such as the hosted versions of AppDynamics and Dynatrace, offer flexibility, scalability, and ease of deployment. These solutions are particularly suited for organizations with dynamic environments or hybrid infrastructures, as they eliminate the need for significant hardware investments and allow seamless updates.
On the other hand, on-premises solutions provide greater control over data, making them a preferred choice for organizations with strict security or compliance requirements. Hosting the software locally allows companies to maintain full control over sensitive performance data while tailoring configurations to their unique environments.
Assessing Two Options
When buying new software, it is always better to gather together information on several candidates so that you can perform a comparison. If you are looking for an APM, it may well be that your choice comes down to AppDynamics and Dynatrace.
This comparison of AppDynamics vs. Dynatrace explores the features, strengths, and weaknesses of these platforms to help you determine which APM solution best fits your needs. Both remain top-tier choices in the world of application performance management.
AppDynamics
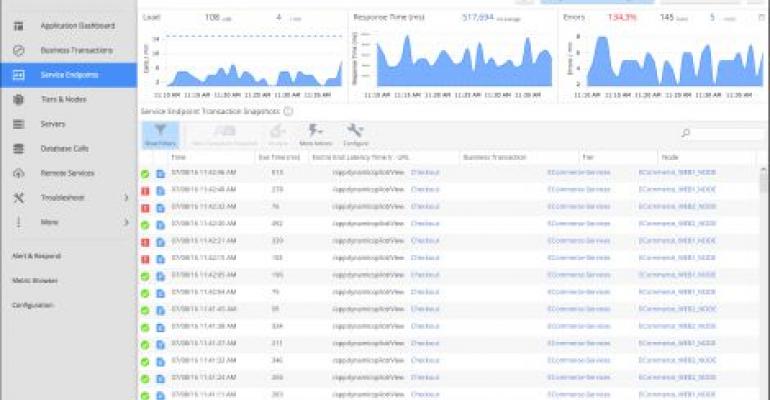
AppDynamics is an application performance monitoring solution that combines use monitoring and business performance monitoring to provide the best service to users. With AppDynamics you can view your business transaction and application performance in real-time via the dashboard. The platform also incorporates machine learning so that you are sent alerts when poor performance is recognized (this is discussed in more detail further below).
Key Features:
- Cisco Cloud Observability: It lets you see everything happening in your cloud world, from the big applications to the tiny details of your technology; hence, you can easily spot any issues and fix them quickly, making your cloud journey smoother and more enjoyable.
- Cloud Migration: you can migrate your data to the cloud while keeping track of everything to ensure there is a secure end-to-end delivery.
- AWS Monitoring: AWS monitoring is like that map but for your Amazon-powered services. It helps you see how well everything is working together and what areas need attention so you can focus on what matters most and keep your business running smoothly.
- Continuous Delivery: this tool reminds you about important things before they happen. It sends smart alerts that help you understand how your releases affect.
Dynatrace
Dynatrace is an application monitoring solution that has its own AI solution built in. With Dynatrace you can monitor your applications in real-time, as well as hybrid, multi-cloud environments, microservices, containers, and user experience. The end goal of monitoring through Dynatrace is to provide users with as an efficient an experience as possible.
Key Features:
- Unified Observability and Security: Dynatrace is powered by smart AI that helps users understand and improve cloud setup faster and makes it more secure.
- Artificial Intelligence and Machine Learning: It learns how your apps usually work and spot any strange behavior. If something weird happens, it sends you a message so you can fix it quickly.
- Security Protection: With this feature, it’s like having a super-guardian for your digital fortress. It finds and protects you from all sorts of digital bad guys, both the ones you know about and the sneaky ones you don’t. It’s like having a digital security system that never sleeps.
- Business Analytics: it collects all the important data without bothering your apps and then combines it with IT stuff to give you super-accurate answers about your business. It’s like having a super-smart business advisor helping you make the best decisions.
It is with this goal in mind that Dynatrace has the ability to monitor almost every user and business journey in your environment. It has been so successful in this endeavour that it has acquired a range of established names amongst its clientele. In fact, Dynatrace is the solution of choice for 72 of the Fortune 100!
AppDynamics vs Dynatrace APM: Head to Head!
| Feature | AppDynamics | Dynatrace |
|---|---|---|
| Application performance monitoring | Yes | Yes |
| Cloud Monitoring | Yes | Yes |
| AI | Yes | Yes |
| Alerts | Yes (Preconfigured and Custom) | Yes (Preconfigured and Custom) |
| APIS | Controller API, Analytics Events API, Standalone Machine Agent API, Database Agent API, Application Agent instrumentation API, and Cloud Connector API | Dynatrace Problems API, Events API, Topology and Smartscape API, JavaScript API, and the Log Analytics API. |
| Plugins | Yes (custom and third-party) | Extensions (custom 130+) |
| Third Party Support and Tech support | Yes including Oracle, Google CLoud, IBM Cloud, .NET, Amazon Web Services, Java, Cloud Foundry, PagerDuty, and Azure virtual machines. | Yes including Amazon Web Services, Google Cloud, IBM Cloud, Docker, Cloud Foundry, Mesosphere, Microsoft Azure, Red Hat Enterprise Linux, Pivotal, and SAP. |
| Pricing | $3,600 (£2,739) per unit, per year | $10,000 (£7,609) per year subscription |
Application Performance Monitoring
Based on the design of the products, it is clear that Application performance monitoring is the bread and butter of both of these providers. AppDynamics application monitoring abilities include application mapping, dynamic baselining and code-level diagnostics. Baseline performance monitoring means that every agent monitoring business transaction feeds data back to the controller. AppDynamics then uses machine learning to create a baseline for each metric.
According to AppDynamics, a baseline is a prevailing performance characteristic of an application. Baseline metrics can be applied to metrics like application response times and conversions. This provides you with a much clearer reference point than estimating yourself. In other words, baselines help you to see clearly when performance issues are impacting your applications significantly.
Dynatrace also provides an extensive application monitoring experience, that provides visibility from core infrastructure right to cloud services. You can monitor real-time metrics on application performance to ensure that all services are up and running. In the event that performance concerns are identified, the platform’s artificial intelligence capabilities help you to take action and point to the root cause.
The Dynatrace AI engine does this by analyzing metrics taken straight from the Dynatrace OneAgent and third-party tools. The Dynatrace AI engine can identify anomalies and performance issues and identify the cause of the problem. This is all done automatically and you don’t need to configure anything.
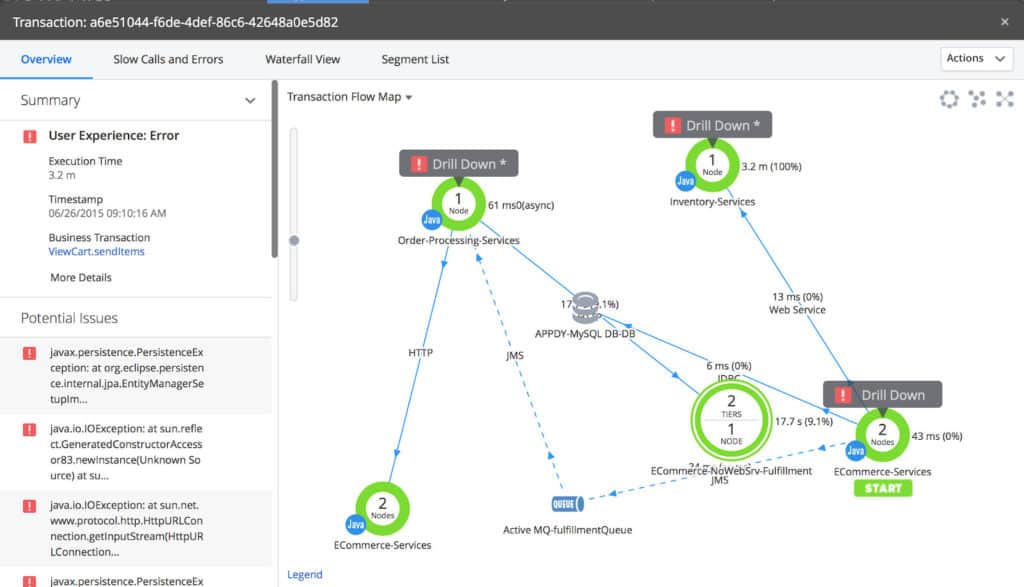
These two are very close in terms of application monitoring capabilities but AppDynamics has a slight edge in terms of how easy it is to use. Features like the topology map help to sift through disparate applications and retain complete visibility over your environment.
Application Discovery
Application discovery is one of the most useful features for monitoring diverse ranges of applications because it eliminates the need to manually configure everything from scratch. It also helps you to connect the dots between sparse cloud services so that you can retain some semblance of visibility. Both AppDynamics and Dynatrace can be used to autodiscover applications throughout your stack.
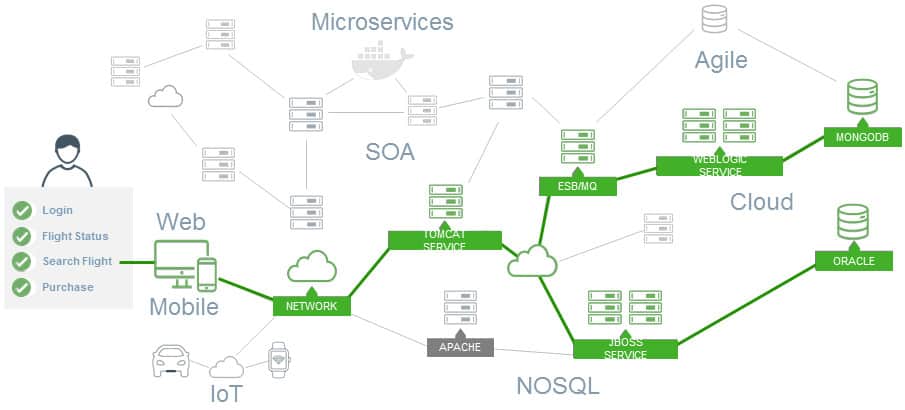
AppDynamics has an autodiscovery feature that is designed to automatically discover infrastructure so that you can view the customer journey that occurs within each device. You can see the entirety of the customer journey from logins to more detailed information like user profiles. Having all of this information at your fingertips makes sure that you don’t miss anything that could hinder the customer experience. All of this information is displayed in the form of a topology map.
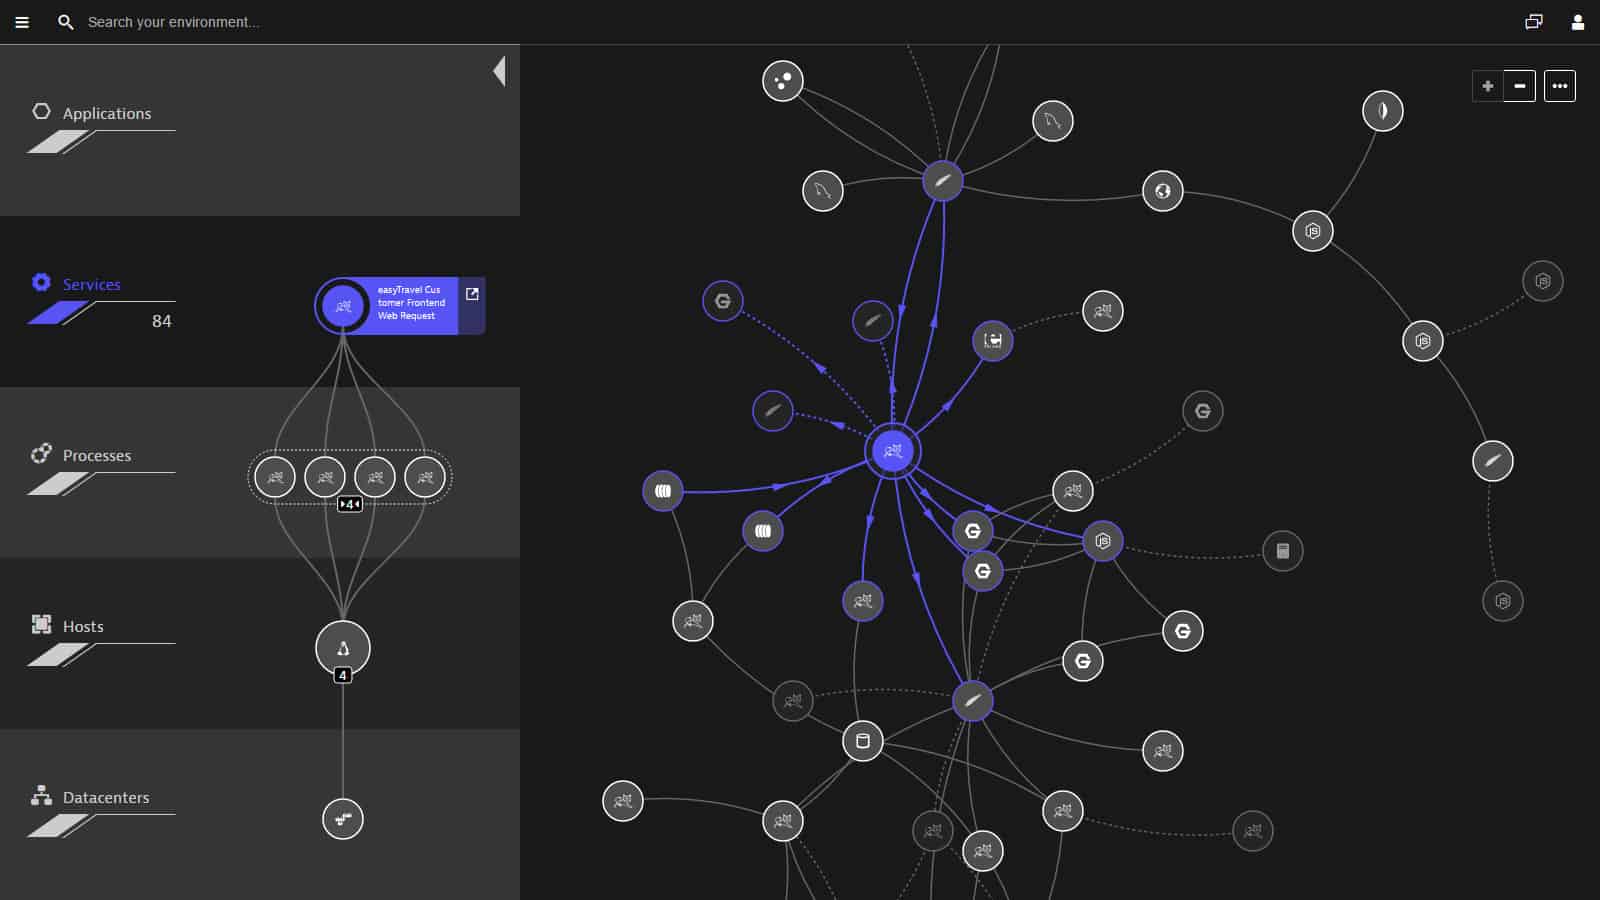
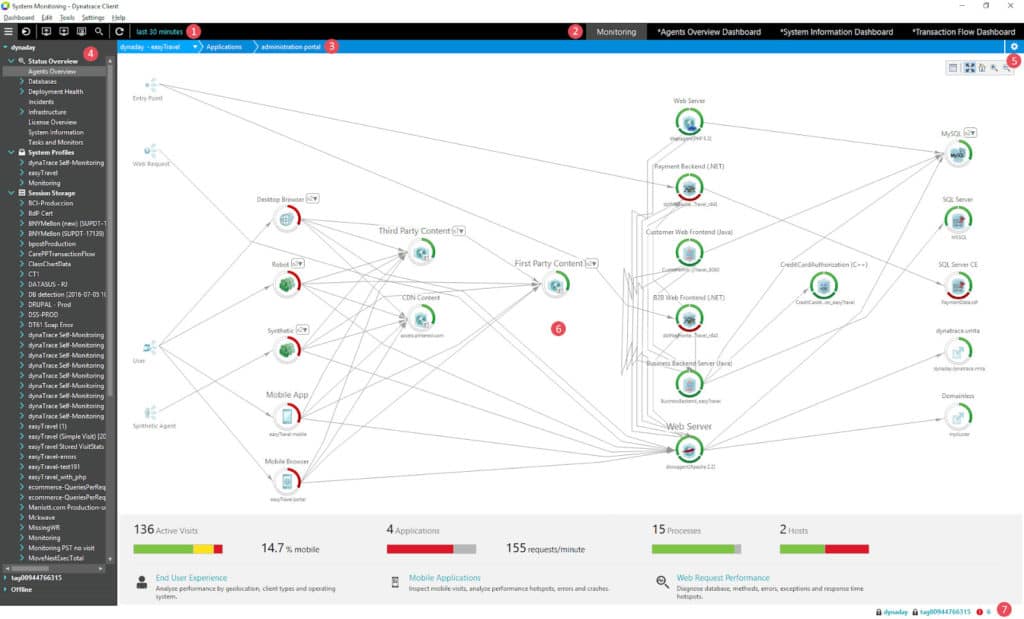
The Dynatrace autodiscovery feature is particularly fast-moving and allows you to map your physical and virtual infrastructure in less than five minutes. Dynatrace’s Smartscape technology can detect websites, applications, services, processes, cloud services, hosts, and networks automatically. This information is then displayed as a state of the art topology map. This is a close comparison but the advantage goes to AppDynamics based on the clarity of the display and how the topology map displays all the information you need.
Cloud Monitoring
Given the centrality of cloud services to modern network environments, getting visibility over cloud services has become extremely important. As two premium-priced solutions, it is no surprise that AppDynamics and Dynatrace have the potential to monitor cloud services with complete visibility. With AppDynamics you can monitor the application performance and business transactions of cloud services in real-time just as you would with a virtual application.
By viewing cloud business transactions you can see how your application responds to customers when they conduct searches, add products to a shopping cart, or check out. One of the most useful features in terms of cloud visibility is the autodiscovery feature. The autodiscovery can work with cloud services to find business transactions and show you a topology map of traffic moving across your service. This provides you with a clear perspective of how a cloud service is performing.
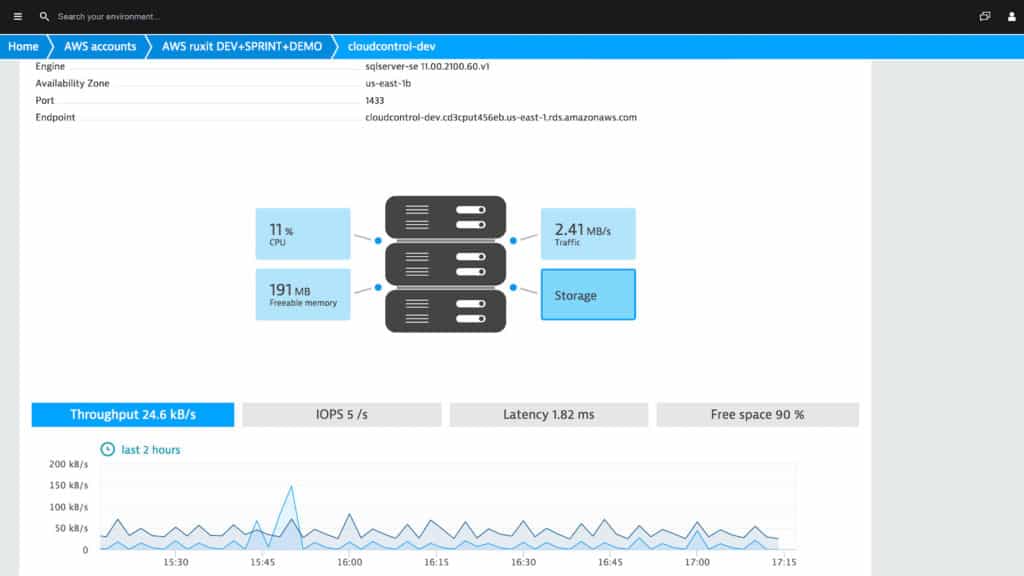
Dynatrace allows users to view the performance of popular cloud services in real time. These include infrastructure health metrics. Dynatrace supports a range of cloud platforms including Amazon Web Services, Google Cloud, Microsoft Azure, Cloud Foundry, Kubernetes, RedHat OpenShift, and Heroku. What makes Dynatrace a good platform for cloud monitoring is its use of AI.
The platform’s AI solution is able to keep up with the change in dependencies that traditionally makes cloud services so hard to manage. The AI solution supports automatic detection of performance issues in real-time in a way that can’t be replicated manually. This allows users to navigate their way around the traditional limitations of monitoring opaque cloud services.
Artificial Intelligence and Machine Learning
Artificial intelligence and machine learning have turned the traditional model of application management upon its head. AppDynamics and Dynatrace have embraced this new model by wholeheartedly using machine learning capabilities to detect performance anomalies. As mentioned above, AppDynamics uses machine learning to automatically calculate performance baselines and detect anomalous behavior.
Once anomalous behavior is identified an alert is sent to the user. When it comes to fault resolution the AI system speeds up the troubleshooting process by searching for anomalies based on average response time. The AI can get right down to the line of code that’s causing the issue. This is excellent for making sure that your customers enjoy the best user experience.
Dynatrace’s AI is designed to recognise performance issues throughout your application stack. The platform uses predictive analytics and baselining to detect anomalous behavior on applications and notify you when you need to take action. This AI solution even has the ability to determine whether a triggered threshold is a problem that impacts the customer experience. In essence, the AI helps to prioritize performance concerns automatically and ignores the trivial issues to cut down on excessive alerts.
Alerts
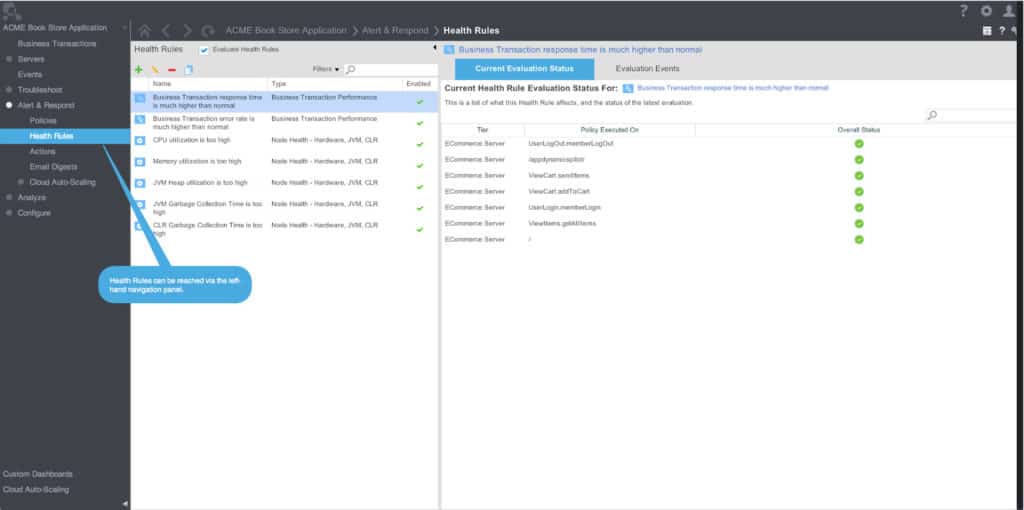
The AppDynamics alerts system is based on Health Rules, these are rules that you configure to determine when alerts are triggered. However, AppDynamics does come with a number of preconfigured health rules for you to start with. Once you’ve got the hang of the system then you can start to branch out and create your own custom alerts.
The interesting thing about the alerts system is that you can not only send a notification but you can also automate a reaction in response. You can run reactions such as diagnostics, remediation, HTTP requests, cloud auto-scaling, and even custom actions. AppDynamics thus provides you with a level of automation that isn’t provided in the same way by Dynatrace.
Dynatrace’s platform uses artificial intelligence to identify performance issues throughout your environment. Whenever an issue is detected an alert is sent out to notify you of the problem. Each alert includes information to help you get down to the root cause. If you need to, you can create your own alert conditions by defining alert thresholds.
All you need to do is create an alert name, scope type, and metric, and then dictate an alert value to act as the trigger condition. For example, you could configure an alert to notify you if disk available is found to below 23 GB. All live alerts are displayed in the problems feed so that you can respond promptly to performance issues as they emerge.
APIS
There are a range of Dynatrace APIs including the Dynatrace Problems API, Events API, Topology and Smartscape API, JavaScript API, and the Log Analytics API. The Events API generates a global feed of uncorrelated events, view parameters of individual events, and push external events onwards to your monitoring environment.
It is important to note that API access is limited to Dynatrace users. You can only have up to 50 requests a minute with Dynatrace in a SaaS environment. You can, however, monitor up to 100 custom metrics a month for free with the Dynatrace API.
AppDynamics also has its own API that allows the user to build custom applications and add new metrics to the monitoring environment. AppDynamics also offers users multiple APIs to customize the monitoring platform. These include the Controller API, Analytics Events API, Standalone Machine Agent API, Database Agent API, Application Agent Instrumentation API, and Cloud Connector API. For example, the Controller API is used to manage and configure the Controller alongside query metrics.
Plugins
Building a monitoring environment around your organization is next to impossible if you don’t have the available plugins and extensions to customize your experience. There are new services released all the time, so plugins give you an opportunity to update your monitoring environment and stay up-to-speed with current developments across the market.
Dynatrace allows you to create your own plugins based on the needs of your enterprise. To create plugins you need to code in Python and create a JSON file that determines how the metrics will be displayed. Once you’ve created custom metrics they will be shown alongside the OneAgent performance metrics you see out of the box. There are a number of third-party providers who have created plugins for Dynatrace, such as the Jenkins Dynatrace Application Monitoring Plugin.
With AppDynamics you can not only create your own plugins but also download other third-party plugins as well. AppDynamics has a section of its website dedicated to the AppDynamics Exchange, which includes a range of extensions. There are over 130 extensions on the AppDynamics Exchange Website for you to download and incorporate into your monitoring environment.
Extensions include the AppDynamics Monitor Extension for use with Apache. This plugin allows the user to take metrics from an Apache web server and view them within the AppDynamics Metric Browser. Of the two providers, AppDynamics has the better plugins setup because you need only go to the AppDynamics Exchange to view a list of existing plugins. With Dynatrace you have to search around on other sites to see what is available to you.
Third-Party Support and Technology Support
Both of these products support a massive range of different technologies. There are so many that we’re not going to list them all here, but we will take a look at some of the key ones. Dynatrace is partnered with lots of other well-known technology providers such as Amazon Web Services, Google Cloud, IBM Cloud, Docker, Cloud Foundry, Mesosphere, Microsoft Azure, Red Hat Enterprise Linux, Pivotal, and SAP.
Similarly, AppDynamics offers support for Oracle, Google Cloud, IBM Cloud, .NET, Amazon Web Services, Java, Cloud Foundry, PagerDuty, and Azure virtual machines. This is an area where AppDynamics and Dynatrace are evenly-matched based on sheer volume alone.
Community Support
When it comes to getting the most out of your application monitoring tool, after-purchase community support is an invaluable resource of information. AppDynamics has its own community site that includes forums and a knowledge base. On the forums, you can converse with other members of the community and ask technical questions as you have them. Though this forum isn’t filled with people there are enough active members for you to gain some valuable insights.
Dynatrace also has its own community site. On the community site, you can visit forums, view product documentation, and contact support. It appears that AppDynamics has the more active forum of the two providers so if you’re looking for an active community following, then you’re better off with AppDynamics.
Pros & Cons
AppDynamics
Pros:
- Effective decision-making: By linking how well your apps work to how happy your customers are, you can quickly figure out what needs fixing first, making sure your customers stay happy.
- Great collaboration: With this tool, everyone in your team can work together smoothly, even when things are changing fast. It helps you avoid confusion and get things done faster.
- Detailed data visualization: Imagine having colorful pictures that show exactly what’s happening in your apps. This tool gives you those pictures, making it easier to spot problems and make things better.
- Supports smart code instrumentation: it includes smart code instrumentation that helps you make your apps work better without slowing them down. You can set everything up super quickly and it adapts to changes in your apps automatically.
Cons:
- Technical challenges: Getting everything set up perfectly might be tricky, especially if your apps are really complex or if you’re not very familiar with how it all works.
Dynatrace
Pros:
- Automate and orchestrate critical processes: the tool can handle all the important tasks for you; hence, you can automate and organize everything smoothly, making sure nothing falls through the cracks.
- Custom solutions: With Dynatrace, you can make your own apps that use all the important data you have without worrying about tricky stuff like security or making it work for lots of people.
- 650+ supported technologies: It works with all the big cloud platforms and other tools you might use. It’s like having a big map that shows you everything that’s happening in your digital world, no matter where it comes from.
- Application observability: It helps you see exactly what’s slowing things down or causing problems so you can fix them quickly and keep your users happy.
Cons:
- Cost: Dynatrace is a powerful tool, but it comes with a price tag. For smaller teams or businesses with tight budgets, it might be a bit too expensive.
Pricing
AppDynamics offers a free plan that limits agent units; however, the full-featured pro version starts at a price of $3,600 (£2,739) per unit, per year. On the other hand, Dynatrace is reported to be around $10,000 (£7,607) for a yearly subscription. This makes both products fairly expensive application monitoring solutions. AppDynamics is available as a SaaS, on-premises, and hybrid solution. We recommend AppDynamics with respect to price as it is the less expensive of the two.
AppDynamics vs Dynatrace: The Final Verdict
Each of these tools offers a robust and diverse application performance experience that is unparalleled by most other providers on the market. Though both of these products have a tremendous amount of power and versatility, AppDynamics takes the win. While Dynatrace is a top-class product, it appears a little bit dated when standing side by side with AppDynamics.
The platform that is right for you depends on what you’re aiming to achieve from your application monitoring efforts. Sometimes the person handling the product is just as important as the product itself. In the right hands, there are next to no limits for application monitoring with either product. It all comes down to how they are applied within your environment.
AppDynamics vs Dynatrace FAQs
What is the difference between AppDynamics and Dynatrace?
AppDynamics and Dynatrace are two application performance monitoring systems that are both cloud-based and both use AI to project resource shortages and raise alerts. The two systems are very similar but the big difference is the price – AppDynamics starts at $3,600 per year and Dynatrace costs about $10,000 per year.
Is Dynatrace real time monitoring?
Dynatrace provides live monitoring of IT systems and can also implement historical analysis of stored metrics.

